BTCUSD (Daily) - Tomando ganancias parciales de $5200Tomando ganancias parciales de $5200 para 1/8 de mi posición largo. Ver idea relacionada para más detalle.
X-indicator

BTCUSD (Daily) - Tomando ganancia de $3100Tomando ganancia de $3100 para final 1/8 de mi posición largo. Ver idea relacionada para más detalle.

BTCUSD (Daily) - Tomando ganancia de $2400Tomando ganancia de $2400 para final 1/8 de mi posición largo. Ver idea relacionada para más detalle.

Mercado de Acciones: Emplear un indicador de tendencia.El volumen se mueve en dirección al precio. Así, cuando el precio se ve en alza, el incremento del volumen confirma la tendencia. La disminución del volumen avisa el final de esta tendencia. Cuando el precio está a la baja, el incremento de volumen confirma las bajadas, y la disminución avisa el fin de la tendencia bajista.

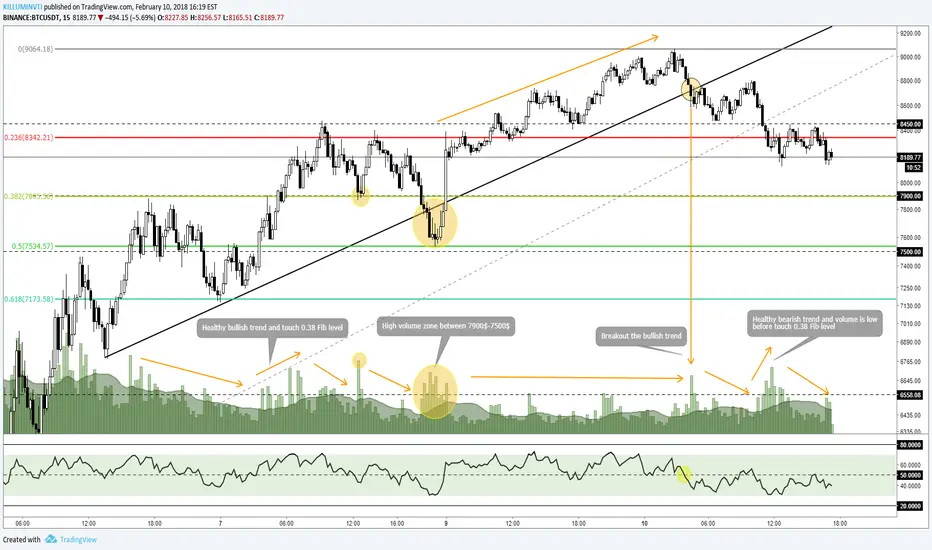
BTC/USD Key Support BTC has an important volume every time he has touched the 0.38 level Fibonacci (7900$) I expect bounce on that area because the bears are winnig right now
The RSI is using the level 50 as resistance and its look he is going on the ride to the oversold levels, and brekas with high volume the bullish trend line on the price
On the more long term is better to maintain the bullish trend it the price holds above 7500$ and keep the pattern of H&S valid.
EURJPY (Daily) - Tomando ganancia de 510 pips para final 1/8 posTomando ganancia de 510 pips para final 1/8 de mi posición corto. Ver idea relacionada para más detalle.

USOIL (Daily) - Tomando ganancia de $6.80Tomando ganancia de $6.80 para 1/4 de mi posición corto. Stop loss a breakeven también. Ver idea relacionada para más detalle.

GBPUSD (daily) - Tomando ganancia de 450 pipsTomando ganancia de 450 pips para 1/8 de mi posición corto. Stop loss a breakeven también. Ver idea relacionada para más detalle.


USDCAD (Daily) - Tomando ganancia de 330 pips para final 1/8 posTomando ganancia de 330 pips para final 1/8 de mi posición largo. Ver idea relacionada para más detalle.

AUDUSD (Daily) - Tomando ganancia de 305 pips Tomando ganancia de 305 pips para final 1/8 de mi posición corto. Ver idea relacionada para más detalle.

EURJPY (Daily) - Tomando ganancia de 400 pipsTomando ganancia de 400 pips para 1/8 de mi posición corto. Stop loss a breakeven también. Ver idea relacionada para más detalle.

US10 (D) - Tomando ganancia de un 4.20% ganancia en los preciosTomando ganancia de un 4.20% ganancia en los precios de bono para 1/2 de mi posición largo. Stop loss a breakeven también. Ver idea relacionada para más detalle.

AUDUSD (Daily) - Tomando ganancia de 270 pipsTomando ganancia de 270 pips para 1/8 de mi posición corto. Stop loss a breakeven también. Ver idea relacionada para más detalle.

USDCAD (Daily) - Tomando ganancia de 300 pipsTomando ganancia de 300 pips para 1/8 de mi posición largo. Stop loss a breakeven también. Ver idea relacionada para más detalle.

EURUSD (Daily) - Tomando ganancia de 215 pipsTomando ganancia de 215 pips para 1/8 de mi posición corto. Stop loss a breakeven también. Ver idea relacionada para más detalle.

USOIL (Daily) - Tomando ganancia de $4.00 Tomando ganancia de $4.00 para 1/4 de mi posición corto. Stop loss a breakeven también. Ver idea relacionada para más detalle.

EURJPY (Daily) - Tomando ganancia de 280 pipsTomando ganancia de 280 pips para 1/4 de mi posición corto. Stop loss a breakeven también. Ver idea relacionada para más detalle.

EURUSD (Daily) - Tomando ganancia de 145 pipsTomando ganancia de 145 pips para 1/4 de mi posición corto. Stop loss a breakeven también. Ver idea relacionada para más detalle.

BTCUSD (daily) - Tomando ganancia de $1800Tomando ganancia de $1800 para 1/4 de mi posición largo. Stop loss a breakeven también. Ver idea relacionada para más detalle.

BTCUSD (Daily) - Tomando ganancia de $600 Tomando ganancia de $600 para 1/4 de mi posición largo. Stop loss a breakeven también. Ver idea relacionada para más detalle.

EURJPY (Daily) - Tomando ganancia de 200 pipsTomando ganancia de 200 pips para 1/4 de mi posición corto. Stop loss a breakeven también. Ver idea relacionada para más detalle.

USOIL (Daily) - Tomando ganancia de $2.25 Tomando ganancia de $2.25 para 1/4 de mi posición corto. Stop loss a breakeven también. Ver idea relacionada para más detalle.
