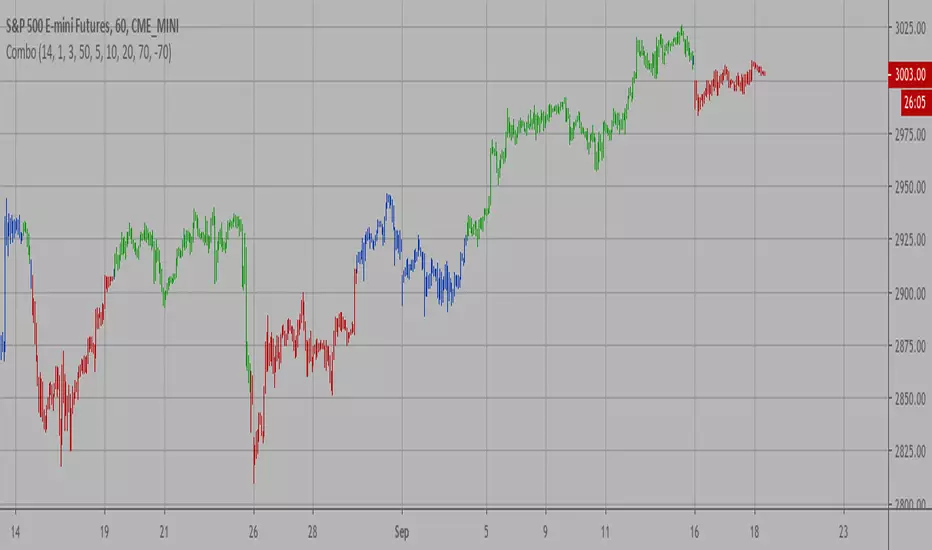
Combo Backtest 123 Reversal & D_ELI (Ehlers Leading Indicator) This is combo strategies for get a cumulative signal.
First strategy
This System was created from the Book "How I Tripled My Money In The
Futures Market" by Ulf Jensen, Page 183. This is reverse type of strategies.
The strategy buys at market, if close price is higher than the previous close
during 2 days and the meaning of 9-days Stochastic Slow Oscillator is lower than 50.
The strategy sells at market, if close price is lower than the previous close price
during 2 days and the meaning of 9-days Stochastic Fast Oscillator is higher than 50.
Second strategy
This Indicator plots a single
Daily DSP (Detrended Synthetic Price) and a Daily ELI (Ehlers Leading
Indicator) using intraday data.
Detrended Synthetic Price is a function that is in phase with the dominant
cycle of real price data. This one is computed by subtracting a 3 pole Butterworth
filter from a 2 Pole Butterworth filter. Ehlers Leading Indicator gives an advanced
indication of a cyclic turning point. It is computed by subtracting the simple
moving average of the detrended synthetic price from the detrended synthetic price.
Buy and Sell signals arise when the ELI indicator crosses over or under the detrended
synthetic price.
See "MESA and Trading Market Cycles" by John Ehlers pages 64 - 70.
WARNING:
- For purpose educate only
- This script to change bars colors.
Buscar en scripts para "oscillator"

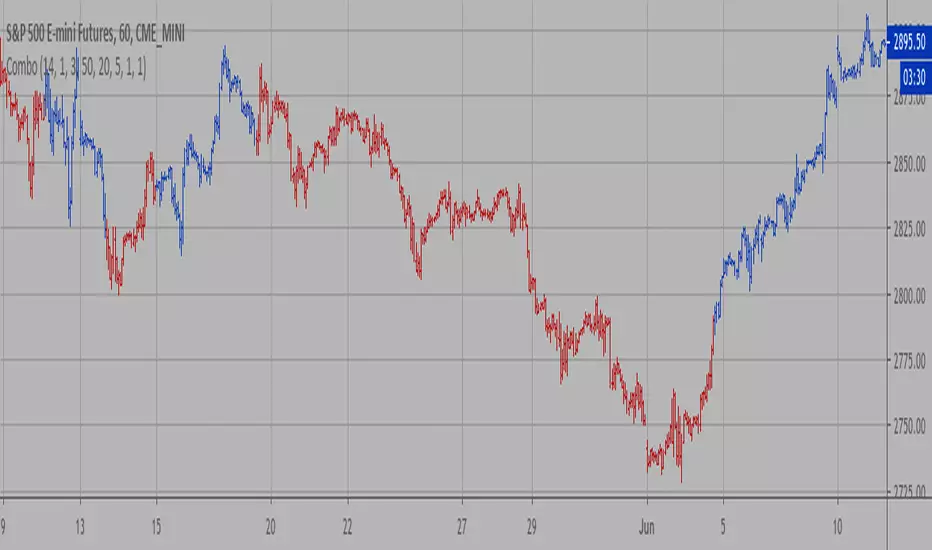
Combo Backtest 123 Reversal & D_DSP (Detrended Synthetic Price) This is combo strategies for get a cumulative signal.
First strategy
This System was created from the Book "How I Tripled My Money In The
Futures Market" by Ulf Jensen, Page 183. This is reverse type of strategies.
The strategy buys at market, if close price is higher than the previous close
during 2 days and the meaning of 9-days Stochastic Slow Oscillator is lower than 50.
The strategy sells at market, if close price is lower than the previous close price
during 2 days and the meaning of 9-days Stochastic Fast Oscillator is higher than 50.
Second strategy
Detrended Synthetic Price is a function that is in phase with the
dominant cycle of real price data. This DSP is computed by subtracting
a half-cycle exponential moving average (EMA) from the quarter cycle
exponential moving average.
See "MESA and Trading Market Cycles" by John Ehlers pages 64 - 70.
WARNING:
- For purpose educate only
- This script to change bars colors.

Combo Strategy 123 Reversal & Cueing Off Sup/Res Levels This is combo strategies for get a cumulative signal.
First strategy
This System was created from the Book "How I Tripled My Money In The
Futures Market" by Ulf Jensen, Page 183. This is reverse type of strategies.
The strategy buys at market, if close price is higher than the previous close
during 2 days and the meaning of 9-days Stochastic Slow Oscillator is lower than 50.
The strategy sells at market, if close price is lower than the previous close price
during 2 days and the meaning of 9-days Stochastic Fast Oscillator is higher than 50.
Second strategy
Cueing Off Support And Resistance Levels, by Thom Hartle
modified by HPotter for trade signals.
The related article is copyrighted material from Stocks & Commodities.
WARNING:
- For purpose educate only
- This script to change bars colors.
Combo Strategy 123 Reversal & Confluence This is combo strategies for get a cumulative signal.
First strategy
This System was created from the Book "How I Tripled My Money In The
Futures Market" by Ulf Jensen, Page 183. This is reverse type of strategies.
The strategy buys at market, if close price is higher than the previous close
during 2 days and the meaning of 9-days Stochastic Slow Oscillator is lower than 50.
The strategy sells at market, if close price is lower than the previous close price
during 2 days and the meaning of 9-days Stochastic Fast Oscillator is higher than 50.
Second strategy
This is modified version of Dale Legan's "Confluence" indicator written by Gary Fritz.
================================================================
Here is Gary`s commentary:
Since the Confluence indicator returned several "states" (bull, bear, grey, and zero),
he modified the return value a bit:
-9 to -1 = Bearish
-0.9 to 0.9 = "grey" (and zero)
1 to 9 = Bullish
The "grey" range corresponds to the "grey" values plotted by Dale's indicator, but
they're divided by 10.
WARNING:
- For purpose educate only
- This script to change bars colors.
Combo Strategy 123 Reversal & Comparative Relative Strength This is combo strategies for get a cumulative signal.
First strategy
This System was created from the Book "How I Tripled My Money In The
Futures Market" by Ulf Jensen, Page 183. This is reverse type of strategies.
The strategy buys at market, if close price is higher than the previous close
during 2 days and the meaning of 9-days Stochastic Slow Oscillator is lower than 50.
The strategy sells at market, if close price is lower than the previous close price
during 2 days and the meaning of 9-days Stochastic Fast Oscillator is higher than 50.
Second strategy
Comparative Relative Strength Strategy for ES
WARNING:
- For purpose educate only
- This script to change bars colors.

Combo Strategy 123 Reversal & CMOfilt This is combo strategies for get a cumulative signal.
First strategy
This System was created from the Book "How I Tripled My Money In The
Futures Market" by Ulf Jensen, Page 183. This is reverse type of strategies.
The strategy buys at market, if close price is higher than the previous close
during 2 days and the meaning of 9-days Stochastic Slow Oscillator is lower than 50.
The strategy sells at market, if close price is lower than the previous close price
during 2 days and the meaning of 9-days Stochastic Fast Oscillator is higher than 50.
Second strategy
This indicator plots a CMO which ignores price changes which are less
than a threshold value. CMO was developed by Tushar Chande. A scientist,
an inventor, and a respected trading system developer, Mr. Chande developed
the CMO to capture what he calls "pure momentum". For more definitive
information on the CMO and other indicators we recommend the book The New
Technical Trader by Tushar Chande and Stanley Kroll.
The CMO is closely related to, yet unique from, other momentum oriented
indicators such as Relative Strength Index, Stochastic, Rate-of-Change, etc.
It is most closely related to Welles Wilder`s RSI, yet it differs in several ways:
- It uses data for both up days and down days in the numerator, thereby directly
measuring momentum;
- The calculations are applied on unsmoothed data. Therefore, short-term extreme
movements in price are not hidden. Once calculated, smoothing can be applied to the
CMO, if desired;
- The scale is bounded between +100 and -100, thereby allowing you to clearly see
changes in net momentum using the 0 level. The bounded scale also allows you to
conveniently compare values across different securities.
WARNING:
- For purpose educate only
- This script to change bars colors.
Combo Strategy 123 Reversal & CMOavThis is combo strategies for get a cumulative signal.
First strategy
This System was created from the Book "How I Tripled My Money In The
Futures Market" by Ulf Jensen, Page 183. This is reverse type of strategies.
The strategy buys at market, if close price is higher than the previous close
during 2 days and the meaning of 9-days Stochastic Slow Oscillator is lower than 50.
The strategy sells at market, if close price is lower than the previous close price
during 2 days and the meaning of 9-days Stochastic Fast Oscillator is higher than 50.
Second strategy
This indicator plots average of three different length CMO's. This indicator
was developed by Tushar Chande. A scientist, an inventor, and a respected
trading system developer, Mr. Chande developed the CMO to capture what he
calls "pure momentum". For more definitive information on the CMO and other
indicators we recommend the book The New Technical Trader by Tushar Chande
and Stanley Kroll.
The CMO is closely related to, yet unique from, other momentum oriented
indicators such as Relative Strength Index, Stochastic, Rate-of-Change, etc.
It is most closely related to Welles Wilder?s RSI, yet it differs in several ways:
- It uses data for both up days and down days in the numerator, thereby directly
measuring momentum;
- The calculations are applied on unsmoothed data. Therefore, short-term extreme
movements in price are not hidden. Once calculated, smoothing can be applied to
the CMO, if desired;
- The scale is bounded between +100 and -100, thereby allowing you to clearly see
changes in net momentum using the 0 level. The bounded scale also allows you to
conveniently compare values across different securities.
WARNING:
- For purpose educate only
- This script to change bars colors.
Combo Strategy 123 Reversal & CMOabs This is combo strategies for get a cumulative signal.
First strategy
This System was created from the Book "How I Tripled My Money In The
Futures Market" by Ulf Jensen, Page 183. This is reverse type of strategies.
The strategy buys at market, if close price is higher than the previous close
during 2 days and the meaning of 9-days Stochastic Slow Oscillator is lower than 50.
The strategy sells at market, if close price is lower than the previous close price
during 2 days and the meaning of 9-days Stochastic Fast Oscillator is higher than 50.
Second strategy
This indicator plots the absolute value of CMO. CMO was developed by Tushar
Chande. A scientist, an inventor, and a respected trading system developer,
Mr. Chande developed the CMO to capture what he calls "pure momentum". For
more definitive information on the CMO and other indicators we recommend the
book The New Technical Trader by Tushar Chande and Stanley Kroll.
The CMO is closely related to, yet unique from, other momentum oriented indicators
such as Relative Strength Index, Stochastic, Rate-of-Change, etc. It is most closely
related to Welles Wilder`s RSI, yet it differs in several ways:
- It uses data for both up days and down days in the numerator, thereby directly
measuring momentum;
- The calculations are applied on unsmoothed data. Therefore, short-term extreme
movements in price are not hidden. Once calculated, smoothing can be applied to
the CMO, if desired;
- The scale is bounded between +100 and -100, thereby allowing you to clearly see
changes in net momentum using the 0 level. The bounded scale also allows you to
conveniently compare values across different securities.
WARNING:
- For purpose educate only
- This script to change bars colors.

Combo Strategy 123 Reversal & Chaikin Volatility This is combo strategies for get a cumulative signal.
First strategy
This System was created from the Book "How I Tripled My Money In The
Futures Market" by Ulf Jensen, Page 183. This is reverse type of strategies.
The strategy buys at market, if close price is higher than the previous close
during 2 days and the meaning of 9-days Stochastic Slow Oscillator is lower than 50.
The strategy sells at market, if close price is lower than the previous close price
during 2 days and the meaning of 9-days Stochastic Fast Oscillator is higher than 50.
Second strategy
Chaikin's Volatility indicator compares the spread between a security's
high and low prices. It quantifies volatility as a widening of the range
between the high and the low price.
You can use in the xPrice1 and xPrice2 any series: Open, High, Low, Close, HL2,
HLC3, OHLC4 and ect...
WARNING:
- For purpose educate only
- This script to change bars colors.

Combo Strategy 123 Reversal & Center Of Gravity This is combo strategies for get a cumulative signal.
First strategy
This System was created from the Book "How I Tripled My Money In The
Futures Market" by Ulf Jensen, Page 183. This is reverse type of strategies.
The strategy buys at market, if close price is higher than the previous close
during 2 days and the meaning of 9-days Stochastic Slow Oscillator is lower than 50.
The strategy sells at market, if close price is lower than the previous close price
during 2 days and the meaning of 9-days Stochastic Fast Oscillator is higher than 50.
Second strategy
The indicator is based on moving averages. On the basis of these, the
"center" of the price is calculated, and price channels are also constructed,
which act as corridors for the asset quotations.
WARNING:
- For purpose educate only
- This script to change bars colors.
Combo Strategy 123 Reversal & CCI This is combo strategies for get a cumulative signal.
First strategy
This System was created from the Book "How I Tripled My Money In The
Futures Market" by Ulf Jensen, Page 183. This is reverse type of strategies.
The strategy buys at market, if close price is higher than the previous close
during 2 days and the meaning of 9-days Stochastic Slow Oscillator is lower than 50.
The strategy sells at market, if close price is lower than the previous close price
during 2 days and the meaning of 9-days Stochastic Fast Oscillator is higher than 50.
Second strategy
The Commodity Channel Index (CCI) is best used with markets that display cyclical or
seasonal characteristics, and is formulated to detect the beginning and ending of these
cycles by incorporating a moving average together with a divisor that reflects both possible
and actual trading ranges. The final index measures the deviation from normal, which indicates
major changes in market trend.
To put it simply, the Commodity Channel Index (CCI) value shows how the instrument is trading
relative to its mean (average) price. When the CCI value is high, it means that the prices are
high compared to the average price; when the CCI value is down, it means that the prices are low
compared to the average price. The CCI value usually does not fall outside the -300 to 300 range
and, in fact, is usually in the -100 to 100 range.
WARNING:
- For purpose educate only
- This script to change bars colors.

Combo Strategy 123 Reversal & Bull Power This is combo strategies for get a cumulative signal.
First strategy
This System was created from the Book "How I Tripled My Money In The
Futures Market" by Ulf Jensen, Page 183. This is reverse type of strategies.
The strategy buys at market, if close price is higher than the previous close
during 2 days and the meaning of 9-days Stochastic Slow Oscillator is lower than 50.
The strategy sells at market, if close price is lower than the previous close price
during 2 days and the meaning of 9-days Stochastic Fast Oscillator is higher than 50.
Second strategy
Bull Power Indicator
To get more information please see "Bull And Bear Balance Indicator"
by Vadim Gimelfarb.
WARNING:
- For purpose educate only
- This script to change bars colors.
Combo Strategy 123 Reversal & Bull And Bear Balance This is combo strategies for get a cumulative signal.
First strategy
This System was created from the Book "How I Tripled My Money In The
Futures Market" by Ulf Jensen, Page 183. This is reverse type of strategies.
The strategy buys at market, if close price is higher than the previous close
during 2 days and the meaning of 9-days Stochastic Slow Oscillator is lower than 50.
The strategy sells at market, if close price is lower than the previous close price
during 2 days and the meaning of 9-days Stochastic Fast Oscillator is higher than 50.
Second strategy
This new indicator analyzes the balance between bullish and
bearish sentiment.
One can cay that it is an improved analogue of Elder Ray indicator.
To get more information please see "Bull And Bear Balance Indicator"
by Vadim Gimelfarb.
WARNING:
- For purpose educate only
- This script to change bars colors.

Combo Strategy 123 Reversal & Breakout Range Short This is combo strategies for get a cumulative signal.
First strategy
This System was created from the Book "How I Tripled My Money In The
Futures Market" by Ulf Jensen, Page 183. This is reverse type of strategies.
The strategy buys at market, if close price is higher than the previous close
during 2 days and the meaning of 9-days Stochastic Slow Oscillator is lower than 50.
The strategy sells at market, if close price is lower than the previous close price
during 2 days and the meaning of 9-days Stochastic Fast Oscillator is higher than 50.
Second strategy
Breakout Range Short Strategy
WARNING:
- For purpose educate only
- This script to change bars colors.

Combo Strategy 123 Reversal & Breakout Range Long This is combo strategies for get a cumulative signal.
First strategy
This System was created from the Book "How I Tripled My Money In The
Futures Market" by Ulf Jensen, Page 183. This is reverse type of strategies.
The strategy buys at market, if close price is higher than the previous close
during 2 days and the meaning of 9-days Stochastic Slow Oscillator is lower than 50.
The strategy sells at market, if close price is lower than the previous close price
during 2 days and the meaning of 9-days Stochastic Fast Oscillator is higher than 50.
Second strategy
Breakout Range Long Strategy
WARNING:
- For purpose educate only
- This script to change bars colors.

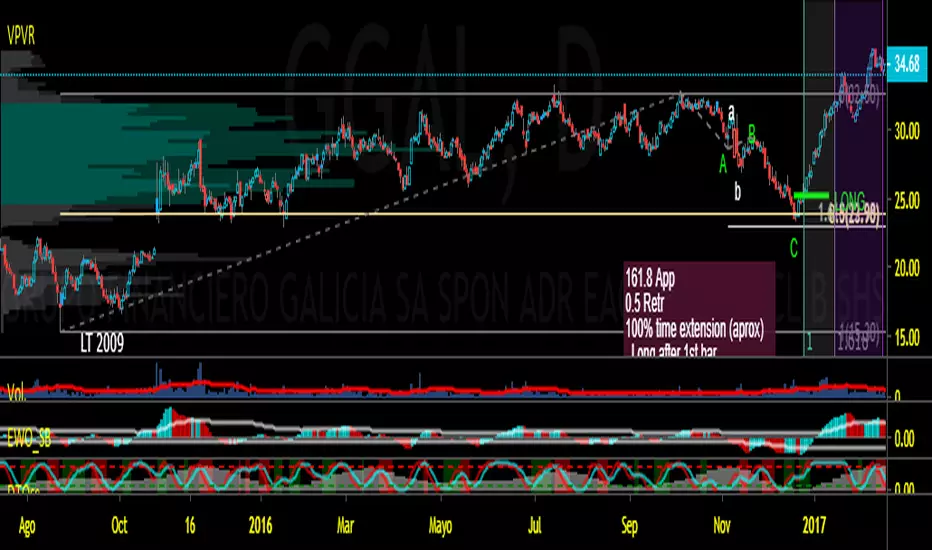
DTOsc Dual time Frame V2Actualization of previous V1 (Read Description of version 1)
The green zones are improved because is no needed that higher time Frame Osc makes a bullish Cross (or bearish). Its only needed
that comes to OS zone (or OB)
Besides the green zones are also improved becouse of crosses on OB zones of lower time frame (for bullish) are discarded.
Remember that this oscillator is used as a filter. Pattern, price, time are needed to take a trade with higher probability.
Remember also that the Gray shaded is the oscillator one time frame higher and Switched automatically with TF!!
Comments are welcomed!!