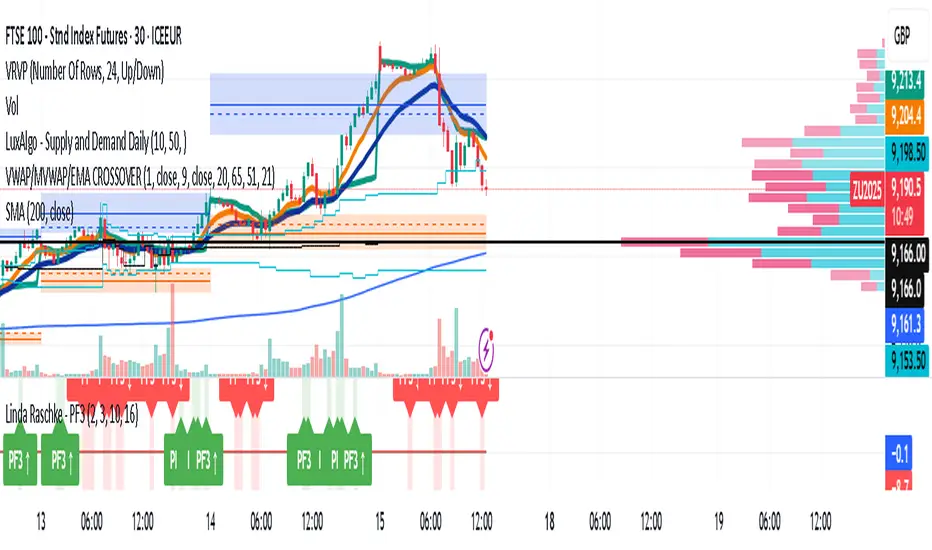
Linda Raschke - PF3This is PF3 indicator where there are confluence agreement of 3 oscillators. Means the market is giving its most!
Buscar en scripts para "oscillator"
Chef MomentumChef momentum is a simple stochastic indicator that uses the hull moving average (hma). The oscillator can be used like most oscillators available.
Default setting:
%K length: 25
%K smoothing: 100
The user can adapt the parameters to study other values.
how to use :
When the length of the stoch K crossover hline 25 , a green circle appears which indicates the potential arrival of momentum.
When the length of the stock K crossover hline 80 , a red circle appears indicating the potential end of the momentum.

KPOS (Keltner Position)Shows closing prices relative to dynamic keltner channel (STARC bands), normalized as oscillator. Default settings are same as Adam H Grimes' who has posted some statistics on the bands. KPOS values show position of closing price relative to lower bands (as a percentage), such that 0 = lower band, 50 = ema (midpoint), and 100 = upper band. Bands can be widened or narrowed by adjusting ATR Multiple. Best used with confluence of support and resistance to identify momentum breakouts, continuations, and divergences.

wabba.1What you see is the close - hullMA (user defined length (source = open)) displayed as an oscillator.
When the red line crosses the green line from below 0 it could mean a short position = (red dot)
When the green line crosses the red line from below 0 it could mean a long position = ( green dot )
Enjoy:)


Stochastic RSI with Crossover AlertsThis draws your Stochastic RSI just like normal except it adds red or green squares everytime there is a crossover at the bottom or the top of the oscillator. Green crossover is bullish, red is bearish.

BTC/Dominance RSI by Sajad BagheriTitle: "BTC/Dominance RSI by Sajad Bagheri"
Description: "Combines BTC Price RSI (Red) and BTC Dominance RSI (Green) to detect trend conflicts and overbought/oversold conditions."
Category: Oscillators
Tags: #BTC, #Dominance, #RSI, #Bitcoin
Access: Public/Private

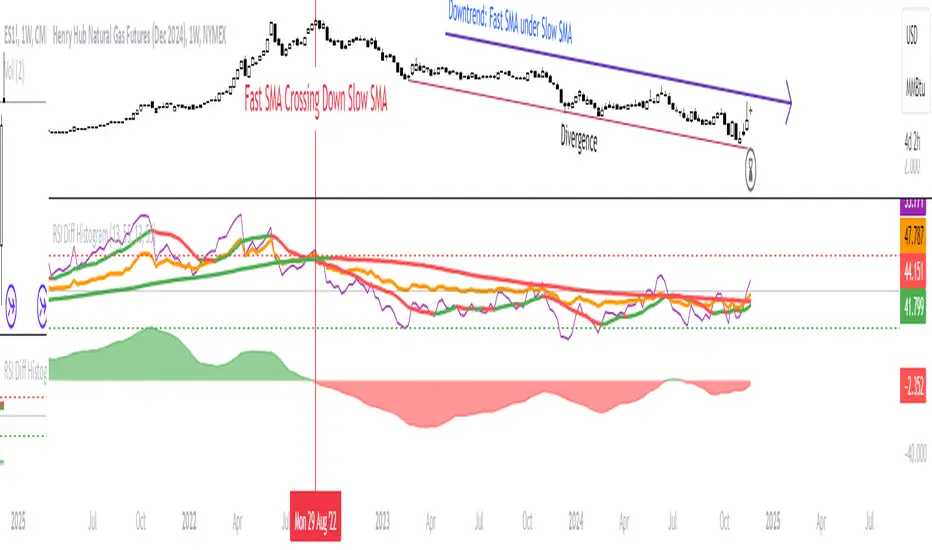
RSI Difference (Fast and Slow)Introduction
Oscillators like the RSI are fundamental tools for identifying trends in financial markets. Their ability to measure price momentum allows traders to detect overbought, oversold levels, and divergences, anticipating trend changes. Are there ways to improve the use of traditional RSI? How can we obtain more detailed information about current trends? This indicator answers these questions by expanding the functionalities of the traditional RSI and offering an additional tool for analysis.
How does it work?
This indicator provides a framework for trend analysis based on the following setup:
Fast RSI
Slow RSI
SMA of the fast RSI
SMA of the slow RSI
Histogram
Custom Indicator Settings
My preferred configuration is based on the 13 and 55 moving averages. The rest of the setup is as follows:
I typically use the 13 and 55 moving averages to configure both the RSI and short- and long-term moving averages.
Interpretation and Signals: Including a Long-Period RSI
Including a long-period RSI helps identify key patterns in market behavior. Crossovers between the two can be used to establish entry patterns:
If the fast RSI crosses above the slow RSI, this could indicate a long-entry pattern.
If the fast RSI crosses below the slow RSI, this could indicate a short-entry pattern.
Interpretation and Signals: Including Moving Averages
Including moving averages for both the short- and long-period RSI can help identify the base trend of the movement and, consequently:
Avoid false signals.
Trade in favor of the trend.
A simple way to start working with these is to use the crossover of the moving averages to identify the current trend:
If the short-period SMA is above the long-period SMA, the trend is bullish.
If the short-period SMA is below the long-period SMA, the trend is bearish.
Interpretation and Signals: The Histogram
The histogram represents the difference between the moving averages. If the histogram is positive, the short average is above the long average. If the histogram is below zero, the short average is below the long average. Divergences with price provide signals of potential exhaustion in the movement, indicating a possible reversal.
Indicator Details
This indicator builds upon the traditional RSI by integrating additional features that enhance its utility for traders. Here’s how each component is calculated and how they contribute to the originality of the script:
Fast RSI and Slow RSI: The fast RSI is calculated using a shorter lookback period, allowing it to capture rapid changes in momentum. The slow RSI uses a longer period to smooth out fluctuations and provide a broader view of the trend. These two RSIs work together to identify significant momentum shifts.
SMA of RSI values: The simple moving averages (SMA) of the fast and slow RSI help filter out noise and provide clear crossover signals. The SMAs are calculated using standard formulas but applied to the RSI values rather than price data, which adds a layer of insight into momentum trends.
Histogram calculation: The histogram represents the difference between the SMA of the fast RSI and the SMA of the slow RSI. This value gives a visual representation of the convergence or divergence of momentum. When the histogram crosses zero, it signifies a potential shift in the underlying trend.
This indicator combines multiple layers of analysis: fast and slow momentum, trend confirmation through SMAs, and divergence detection via the histogram. This multi-dimensional approach provides traders with a more comprehensive tool for trend analysis and decision-making.
Conclusion
This article has explored how to use this indicator to identify trends, leverage entry patterns, and analyze divergences by combining the fast RSI, slow RSI, their moving averages, and a histogram. Additionally, I’ve detailed how I usually interpret this indicator:
Identifying RSI patterns to anticipate momentum changes.
Using SMAs to confirm base trends.
Leveraging the histogram to detect divergences and potential price reversals.

Dynamic ZonesA port of the MT4 indicator of Mladen Rakic found at www.mql5.com
which is based on Dynamic Zones that was originally published in Stocks & Commodities 1996 issue.
Dynamic Zones is meant to be applied to oscillators to get dynamic overbought and oversold levels
quantified using statistical methods.

Parabolic Stoch SAR VisualizerParabolic Stoch SAR Visualizer — Momentum-Driven Trend Precision Tool
Overview:
Parabolic Stoch SAR Visualizer is a thoughtfully engineered hybrid indicator that blends momentum oscillation and trend-following mechanics into one robust system. By applying a custom Parabolic SAR calculation directly on a double-smoothed stochastic oscillator (rather than on price), it generates cleaner signals with enhanced trend detection and fewer false positives than typical Parabolic RSI or standard SAR variants.
Unique Functionality:
Momentum smoothing : The base stochastic %K undergoes double smoothing via consecutive simple moving averages, significantly cutting down random noise and erratic swings common in raw stochastic readings. This stabilizes momentum tracking, isolating true price strength and weakness.
Custom Parabolic SAR on smoothed momentum : Traditional SAR algorithms operate on price data, acting as trailing stops. This indicator repurposes SAR to work on smoothed stochastic values, effectively converting it into a momentum-driven directional filter. This yields a more adaptive and responsive trend signal focused on genuine momentum shifts instead of price noise.
Bounded SAR range and adjustable acceleration : SAR values are mathematically restricted between 0 and 100, aligning with the stochastic scale to prevent distortions. Traders can customize acceleration parameters (start, increment, max) to fine-tune trend sensitivity relative to market volatility or specific strategies.
Signal clarity through filterin g: Minimum bar spacing and minimum SAR movement thresholds between plotted dots reduce chart clutter, highlighting only meaningful trend changes and filtering out insignificant fluctuations.
Enhanced visuals : The oscillator line smoothly transitions its color gradient between defined uptrend and downtrend hues, intuitively signaling momentum strength. Parabolic SAR dots are offset from the oscillator line with multi-layered glow effects, making trend flips easy to spot at a glance.
Trading Application:
Trend identification : Momentum-based SAR dots offer precise marking of trend shifts, helping traders avoid false breakouts and premature trades.
Entry and exit timing : Combining the double-smoothed stochastic oscillator and SAR dots creates a reliable framework to confirm momentum shifts and optimal trade entries or exits.
Customizable for volatility regimes : Adjustable acceleration and filtering parameters allow scalpers to increase signal sensitivity, while swing traders can dial back noise for smoother trend recognition.
Visual clarity for fast decisions : Gradient color coding and glowing SAR dots facilitate immediate momentum assessment without complex analysis, empowering quicker, more confident trade actions.
Advantages over Parabolic RSI and similar indicators:
Parabolic RSI’s direct application of SAR on RSI often results in noisy, choppy signals prone to whipsaws. This indicator’s double-smoothed stochastic foundation delivers a cleaner, steadier signal.
Applying SAR to smoothed momentum rather than price transforms it into a directional filter that better captures true market strength with reduced lag.
Adaptive plotting thresholds and enhanced visuals minimize clutter and ambiguity, improving trader focus and execution speed.

Sri_Momentum Sri_Momentum - Advanced Oscillator for Market Trends
Description
The Sri_Momentum is a powerful momentum-based oscillator that helps traders analyze price trends and market strength. This indicator utilizes two simple moving averages (SMA) to calculate the Awesome Oscillator (AO) and a signal line for trend confirmation. The histogram dynamically changes color based on the crossover between AO and the signal line, providing clear bullish and bearish signals.
✅ Awesome Oscillator (AO) Calculation - Measures market momentum using a fast and slow SMA.
✅ Signal Line for Confirmation - A smoothed moving average of AO to help traders identify trend shifts.
✅ Dynamic Histogram Color Coding - Easy-to-interpret histogram with four colors indicating trend strength and direction.
✅ Custom Sensitivity Input - Adjusts the AO calculation to fine-tune responsiveness.
✅ Zero Line Reference - A baseline to differentiate bullish and bearish momentum.
How It Works
Fast SMA (default: 5-period) and Slow SMA (default: 34-period) are calculated based on the average of high and low prices.
AO (Awesome Oscillator) = (Fast SMA - Slow SMA) * Sensitivity
Signal Line = Smoothed AO using a 7-period SMA
Histogram Color Logic:
🔵 Strong Bullish → AO > Signal & AO ≥ 0 (Green)
🔴 Weak Bullish → AO > Signal & AO < 0 (Light Red)
🟢 Weak Bearish → AO < Signal & AO ≥ 0 (Light Green)
🔥 Strong Bearish → AO < Signal & AO < 0 (Dark Red)
How to Use the Sri_Momentum Indicator
📌 Bullish Momentum → When AO crosses above the Signal Line, and the histogram turns green.
📌 Bearish Momentum → When AO crosses below the Signal Line, and the histogram turns red.
📌 Trend Strength → Darker colors indicate stronger trends; lighter colors suggest weaker trends.
📌 Zero Line Crossover → If AO moves above zero, it suggests bullish strength; if below zero, bearish control.

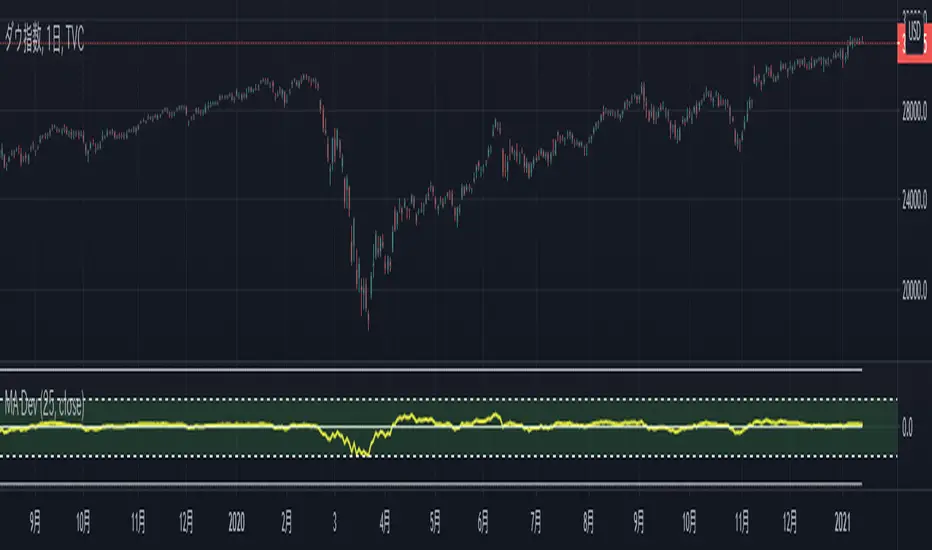
MA Deviation
Script description
A script that displays the deviation rate of the specified moving average line.
You can non-display the oscillator line by setting it.
Default setting
Moving average divergence rate : 25 SMA
Oscillator line (50) : display
Oscillator line (75) : non-display
Oscillator line (100) : non-display
スクリプトの説明
指定した移動平均線の乖離率を表示するスクリプトです。
設定によりオシレーター上の水平線の表示非表示を切り替えることができます。
デフォルト設定
移動平均乖離率:25 SMA
水平線(50):表示
水平線(75):非表示
水平線(100):非表示
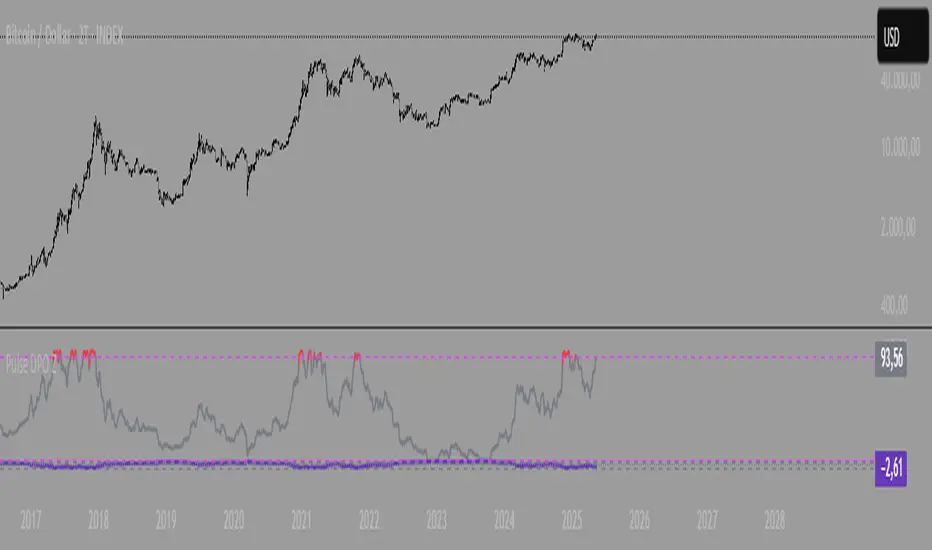
Pulse DPO with Z-Score📌 Pulse DPO with Z-Score — Indicator Description (English)
The Pulse DPO (Detrended Price Oscillator) helps identify major market cycle tops and bottoms by removing long-term trends and focusing on shorter-term price cycles.
This enhanced version includes:
A normalized oscillator (0–100) based on recent price deviations.
A smoothed signal to reduce noise.
A Z-Score transformation, scaling the output to a range from –3 to +3, where:
–3 represents extreme oversold conditions (former normalized value = 100),
+3 represents extreme overbought conditions (former normalized value = 1).
🔍 How it works:
The indicator subtracts a delayed moving average from price to isolate short-term cycles (DPO logic).
It then normalizes the oscillator within a lookback window.
Finally, it converts this to a Z-Score scale for easier interpretation of extremes.
🟢 Suggested Usage:
Consider Long entries or Short exits when Z-Score reaches –2 to –3 (deep oversold).
Consider Short entries or Long exits when Z-Score reaches +2 to +3 (deep overbought).
Use in combination with other signals for higher-confidence setups.
RSI and CCICombined RSI and CCI Indicator for MetaTrader
The Combined RSI and CCI Indicator is a powerful hybrid momentum oscillator designed to merge the strengths of two popular indicators—the Relative Strength Index (RSI) and the Commodity Channel Index (CCI)—into a single, visually intuitive chart window. This tool enhances traders’ ability to identify overbought and oversold conditions, divergences, trend strength, and potential reversal zones with improved precision.
Purpose
By integrating RSI and CCI, this indicator helps filter out false signals that often occur when using each tool independently. It is especially useful for swing trading, trend confirmation, and spotting high-probability entry/exit zones. This dual-oscillator approach combines RSI’s relative momentum insights with CCI’s deviation-based analysis to produce a more reliable signal structure.
Key Features
Dual Oscillator Display: Plots both RSI and CCI on the same subwindow for easy comparison and correlation analysis.
Customizable Parameters:
RSI Period and Level (default: 14)
CCI Period and Typical Price Type (default: 20, TP)
Overbought/Oversold Levels for both indicators
Color-Coded Zones:
Background highlights when both RSI and CCI enter overbought/oversold territory, signaling high potential reversal zones.
Combined Signal Logic (Optional Feature):
Buy Signal: RSI < 30 and CCI < -100
Sell Signal: RSI > 70 and CCI > 100
These can be visualized as arrows or plotted as signal markers.
Trend Filter Overlay (Optional):
Can be combined with a moving average or price action filter to confirm trend direction before accepting signals.
Divergence Detection (Advanced Option):
Optional plotting of bullish or bearish divergence where both indicators diverge from price action.
Multi-Timeframe Compatibility:
Allows the use of higher timeframe RSI/CCI values to confirm signals on lower timeframes.
Benefits
Improved Signal Accuracy: Using both RSI and CCI together helps avoid false breakouts and whipsaws.
More Informed Decision-Making: Correlating momentum (RSI) with deviation (CCI) provides a well-rounded picture of market behavior.
Efficient Charting: Saves screen space and cognitive load by combining two indicators into one clean panel.
Scalable Strategy Integration: Can be used in discretionary trading or coded into automated strategies/alerts.
Use Case Example
In a ranging market, the indicator highlights zones where both RSI and CCI are oversold, alerting traders to potential bounce opportunities.
In trending markets, it confirms trend strength when RSI and CCI are both aligned with trend direction.
When RSI is diverging from price but CCI isn’t, it can be a clue of weakening momentum, helping traders scale out or avoid traps.
This combined indicator offers a versatile, high-performance toolset for traders looking to elevate their technical analysis by leveraging multiple momentum perspectives simultaneously.

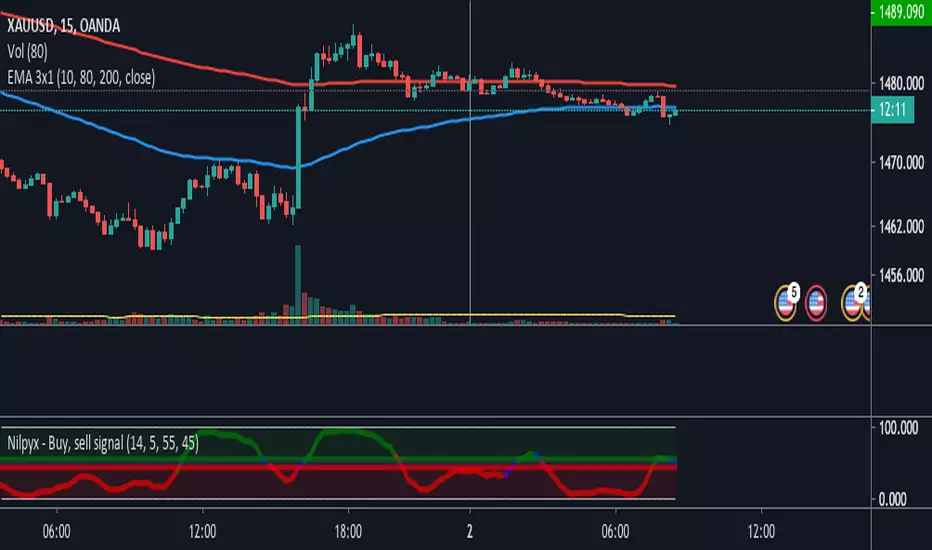
Nilpyx - Buy, sell signalThis indicator detects market entry signals.
Green Oscillator = Buy
Blue Oscillator = Do nothing
Red oscillator = Sell
// ESP
Oscilador verde = compra
Oscilador azul = No hacer nada
Oscilador rojo = venta
TTM Squeeze Ribbon V1Edited Greeny's script to make ribbons
Squeeze dots are idential to Greeny-TTM
Blue and Red is main TTM-Momentum Oscillator
Yellow shows Acceleration, and leads the Momentum Oscillator
Ribbons are multiples of Main Oscillator, 2x, 3x, 4x etc... to 12x

Katz Exploding PowerBand FilterUnderstanding the Katz Exploding PowerBand Filter (EPBF) v2.4
1. Indicator Overview
The Katz Exploding PowerBand Filter (EPBF) is an advanced technical indicator designed to identify moments of expanding bullish or bearish momentum, often referred to as "power." It operates as a standalone oscillator in a separate pane below the main price chart.
Its primary goal is to measure underlying market strength by calculating custom "Bull" and "Bear" power components. These components are then filtered through a versatile moving average and a dual signal line system to generate clear entry and exit signals. This indicator is not a simple momentum oscillator; it uses a unique calculation based on exponential envelopes of both price and squared price to derive its values.
2. On-Chart Lines and Components
The indicator pane consists of five main lines:
Bullish Component (Thick Green/Blue/Yellow/Gray Line): This is the core of the indicator. It represents the calculated bullish "power" or momentum in the market.
Bright Green: Indicates a strong, active long signal condition.
Blue: Shows the bull component is above the MA filter, but the filter itself is still pointing down—a potential sign of a reversal or weakening downtrend.
Yellow: A warning sign that bullish power is weakening and has fallen below the primary signal lines.
Gray: Represents neutral or insignificant bullish power.
Bearish Component (Thick Red/Purple/Yellow/Gray Line): This line represents the calculated bearish "power" or downward momentum.
Bright Red: Indicates a strong, active short signal condition.
Purple: Shows the bear component is above the MA filter, but the filter itself is still pointing down—a sign of potential trend continuation.
Yellow: A warning sign that bearish power is weakening.
Gray: Represents neutral or insignificant bearish power.
MA Filter (Purple Line): This is the main filter, calculated using the moving average type and length you select in the settings (e.g., HullMA, EMA). The Bull and Bear components are compared against this line to determine the underlying trend bias.
Signal Line 1 (Orange Line): A fast Exponential Moving Average (EMA) of the stronger power component. It acts as the first level of dynamic support or resistance for the power lines.
Signal Line 2 (Lime/Gray Line): A slower EMA that acts as a confirmation filter.
Lime Green: The line turns lime when it is rising and the faster Signal Line 1 is above it, indicating a confirmed bullish trend in momentum.
Gray: Indicates a neutral or bearish momentum trend.
3. On-Chart Symbols and Their Meanings
Various characters are plotted at the bottom of the indicator pane to provide clear, actionable signals.
L (Pre-Long Signal): The first sign of a potential long entry. It appears when the Bullish Component rises and crosses above both signal lines for the first time.
S (Pre-Short Signal): The first sign of a potential short entry. It appears when the Bearish Component rises and crosses above both signal lines for the first time.
▲ (Post-Long Signal): A stronger confirmation for a long entry. It appears with the 'L' signal only if the momentum trend is also confirmed bullish (i.e., the slower Signal Line 2 is lime green).
▼ (Post-Short Signal): A stronger confirmation for a short entry. It appears with the 'S' signal only if the momentum trend is confirmed bullish.
Exit / Take-Profit Symbols:
These symbols appear when a power component crosses below a line, suggesting that momentum is fading and it may be time to take profit.
⚠️ (Exit Signal 1): The Bull/Bear component has crossed below the main MA Filter. This is the first and most sensitive take-profit signal.
☣️ (Exit Signal 2): The Bull/Bear component has crossed below the faster Signal Line 1. This is a moderate take-profit signal.
🚼 (Exit Signal 3): The Bull/Bear component has crossed below the slower Signal Line 2. This is the slowest take-profit signal, suggesting the trend is more definitively exhausted.
4. Trading Strategy and Rules
Long Entry Rules:
Initial Signal: Wait for an L to appear at the bottom of the indicator. This confirms that bullish power is expanding.
Confirmation (Recommended): For a higher-probability trade, wait for a green ▲ symbol to appear. This confirms the underlying momentum trend aligns with the signal.
Entry: Enter a long (buy) position on the opening of the next candle after the signal appears.
Short Entry Rules:
Initial Signal: Wait for an S to appear at the bottom of the indicator. This confirms that bearish power is expanding.
Confirmation (Recommended): For a higher-probability trade, wait for a maroon ▼ symbol to appear. This confirms the underlying momentum trend aligns with the signal.
Entry: Enter a short (sell) position on the opening of the next candle after the signal appears.
Take Profit (TP) Rules:
The indicator provides three levels of take-profit signals. You can choose to exit your entire position or scale out at each level.
For a long trade, exit when you see ⚠️, ☣️, or 🚼 appear below the Bullish Component.
For a short trade, exit when you see ⚠️, ☣️, or 🚼 appear below the Bearish Component.
Stop Loss (SL) Rules:
The indicator does not provide an explicit stop loss. You must use your own risk management rules. Common methods include:
Swing High/Low: For a long position, place your stop loss below the most recent significant swing low on the price chart. For a short position, place it above the most recent swing high.
ATR-Based: Use an Average True Range (ATR) indicator to set a volatility-based stop loss.
Fixed Percentage: Risk a fixed percentage (e.g., 1-2%) of your account on the trade.
5. Disclaimer
This indicator is a tool for technical analysis and should not be considered financial advice. All trading involves significant risk, and past performance is not indicative of future results. The signals generated by this indicator are probabilistic and can result in losing trades. Always use proper risk management, such as setting a stop loss, and never risk more than you are willing to lose. It is recommended to backtest this indicator and use it in conjunction with other forms of analysis before trading with real capital. The indicator should only be used for educational purposes.

Top and Bottom Probability
The top and bottom probability oscillator is an educational indicator that estimates the probability of a local top or bottom using four ingredients:
price extension since the last RSI overbought/oversold,
time since that OB/OS event,
RSI divergence strength,
Directional Momentum Velocity (DMV) — a normalized, signed trend velocity.
It plots RSI, two probability histograms (Top %, Bottom %), and an optional 0–100 velocity gauge.
How to read it
RSI & Levels: Standard RSI with OB/OS lines (70/30 by default).
Prob Top (%): Red histogram, 0–100. Higher values suggest increasing risk of a local top after an RSI overbought anchor.
Prob Bottom (%): Green histogram, 0–100. Higher values suggest increasing chance of a local bottom after an RSI oversold anchor.
Velocity (0–100): Optional line. Above 50 = positive/upward DMV; below 50 = negative/downward DMV. DMV pushes Top risk when trending down and Bottom chance when trending up.
These are composite, scale-free scores, not certainties or trade signals.
What the probabilities consider
Price Delta: How far price has moved beyond the last OB (for tops) or below the last OS (for bottoms). More extension → higher probability.
Time Since OB/OS: Longer time since the anchor → higher probability (until capped by the “Time Normalization (bars)” input).
Oscillator Divergence: RSI pulling away from its last OB/OS reading in the opposite direction implies weakening momentum and increases probability.
Directional Momentum Velocity (DMV):
Computes a regression slope of hlc3 vs. bar index, normalized by ATR, then squashed with tanh.
Downward DMV boosts Top probability; upward DMV boosts Bottom probability.
Toggle the velocity plot and adjust its sensitivity with Velocity Lookback, ATR Length, and Velocity Gain.
All four terms are blended with user-set weights. If Normalize Weights is ON, weights are rescaled to sum to 1.
Inputs (most useful)
RSI Length / OB / OS: Core RSI setup.
Time Normalization (bars): Sets how quickly the “time since OB/OS” term ramps from 0→1.
Weights:
Price Delta, Time Since OB/OS, Osc Divergence, Directional Velocity.
Turn Normalize Weights ON to keep the blend consistent when you experiment.
Settings:
Velocity Lookback: Window for slope estimation (shorter = more reactive).
ATR Length: Normalizes slope so symbols/timeframes are comparable.
Velocity Gain: Steepens or softens the tanh curve (higher = punchier extremes).
Show Velocity (0–100): Toggles the DMV display.
Tip: If you prefer momentum measured on RSI rather than price, in the DMV block replace hlc3 with rsi (concept stays identical).
Practical tips
Use Top/Bottom % as context, not triggers. Combine with structure (S/R), trend filters, and risk management.
On strong trends, expect the opposite probability (e.g., Top % during an uptrend) to stay suppressed longer.
Calibrate weights: e.g., raise Osc Divergence on mean-reversion symbols; raise Velocity in trending markets.
For lower noise: lengthen Velocity Lookback and ATR Length, or reduce Velocity Gain.

MVRV and RSI Std DevThis indicator provides a comprehensive, long-term view of market risk and opportunity for Bitcoin by combining fundamental on-chain data with classic momentum analysis.
How It Works:
The oscillator's value is calculated by multiplying two key metrics:
MVRV Ratio: An on-chain metric that indicates if the market price is "fair," "overvalued," or "undervalued" relative to the average price at which all coins last moved.
Weekly RSI: The standard Relative Strength Index on a weekly timeframe to measure long-term market momentum and identify overbought/oversold conditions.
Key Features:
Adaptive Risk Bands: Instead of fixed "overbought/oversold" levels, this indicator uses dynamic bands based on a long-term 4 year moving average and standard deviation. These bands automatically adjust to the market's changing volatility and cyclical nature, ensuring the risk/reward zones remain relevant over time.
Gradient Coloring: The oscillator line is colored on a smooth gradient from deep green (high reward/low risk) to bright red (high risk/low reward). This provides an intuitive, at-a-glance visualization of the market's "temperature."

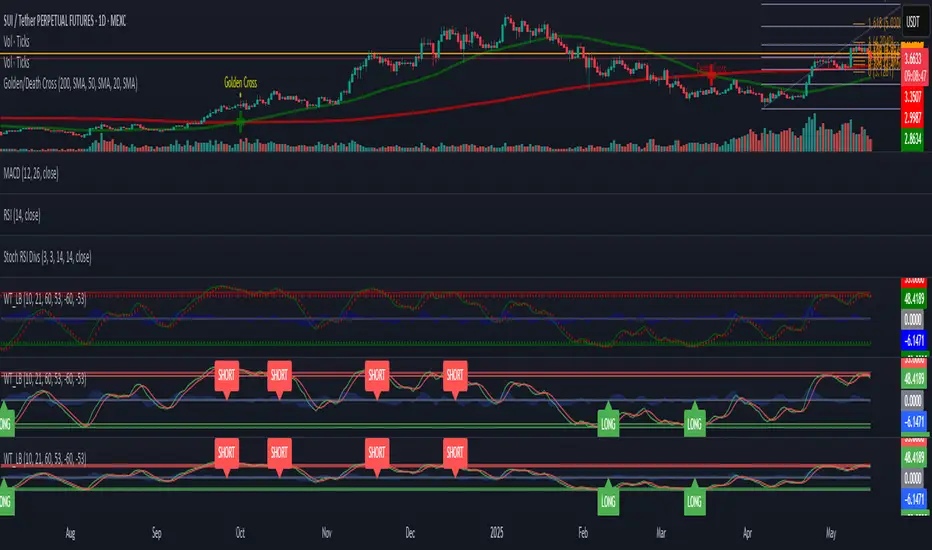
WaveTrend [LazyBear] with Long/Short LabelsWaveTrend Oscillator with Entry Signals (LONG/SHORT) – Advanced Edition
This indicator is based on the renowned WaveTrend Oscillator by LazyBear, a favorite among professional traders for spotting trend reversals with precision.
🚀 Features:
Original WaveTrend formula with dual-line structure (WT1 & WT2).
Customizable overbought and oversold zones for visual clarity.
Automatic LONG and SHORT signals plotted directly on the chart:
✅ LONG: When WT1 crosses above WT2 below the oversold zone.
❌ SHORT: When WT1 crosses below WT2 above the overbought zone.
Momentum histogram shows strength of market moves.
Fully optimized for Pine Script v5 and lightweight across all timeframes.
🔍 How to use:
Combine with support/resistance levels or candlestick reversal patterns.
Works best on 15min, 1H, or 4H charts.
Suitable for all markets: crypto, stocks, forex, indices.
📊 Ideal for:
Traders seeking clean, reliable entry signals.
Reversal strategies with technical confluence.
Visual confirmation of WaveTrend crossovers without manual interpretation.
💡 Pro Tip: Combine with EMA or RSI filters to further enhance accuracy.
Money Maykah -- MA slopesThe idea behind this script is to play with the idea of summing integration (IT) and differentiation (DT) of a T3 signal (smoothed with sma or ema). The sum is IT + DT.
Obviously this is not exactly these mathematical concepts, but what occurs is that it generates an oscillator that somewhat gets rid of skew in the oscillations in the market.
There is a signal IDE which sums the full IT + DT which shows a longer term oscillation. This will have a much larger range of numbers in amplitude so it may be a little annoying to move the scale around by hand. I don't care to fix this right now but I'm sure it can be done quite easily for someone else.
I was also playing with the idea of using a Normalization oscillator with this and seeing how the two compare and whether they could be used in some sort of strategy. Both have unpredictable behaviors but hey the market is unpredictable so have at it!
SMOOTHED RSI SWITCHThis more complex take on the traditional RSI provides clearer entry and exit points and looks beyond just overbought/oversold levels, altogether creating a more robust trading strategy.
The RSI is smoothed by the Hull MA with adjustable periods.
Although a variety of strategies can be developed using this indicator. I intended its most profitable use be as follows:
Entries are to be taken when the oscillator flips from red to clear and/or directly from red to green. Sell/short positions are to be take when the oscillator flips from green to clear and/or directly from green to red.
