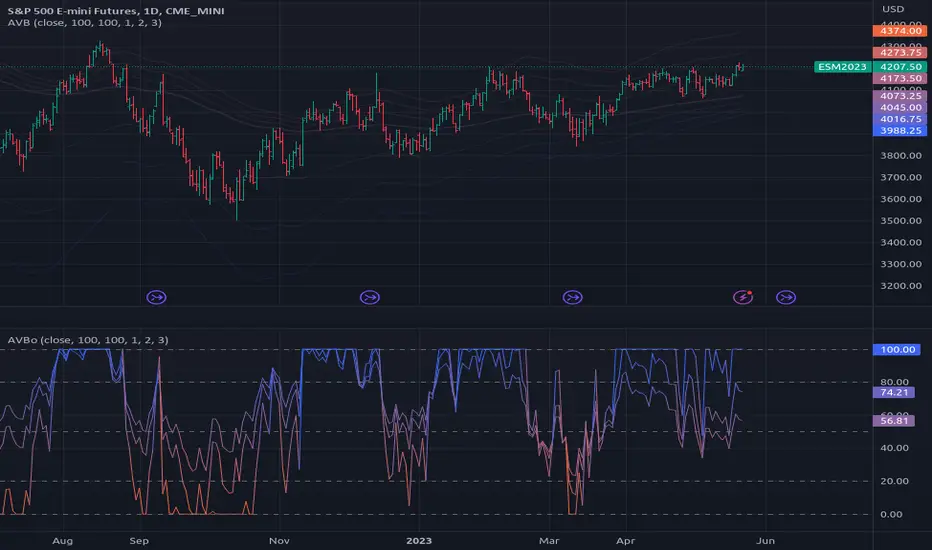
Average Variation Bands OscillatorSimilar to how a donchian% of channel helps to visualize trend and volatility, this tool helps identify those same characteristics, if the oscillator is generally above the 50 mark, it is considered to be trending upwards, and the reverse if it is generally bellow 50.
Buscar en scripts para "oscillator"
Trend Oscillatorwhat is "Trend Oscillator"?
it is an indicator for determining the trend.
what it does?
analyzes the price action by reducing it to 4 different situations. Red means strong bear, orange means bearish, yellow means weak bull and green means strong bull. It was developed to help traders who trade in the direction of the trend and its biggest promise is to simplify price action.
how it does it?
He defines 4 different situations as follows. If the velocity of the price is positive and the acceleration is positive, it is a strong bull, if the velocity is positive and the acceleration is negative, it is a weak bull, if the velocity is negative and the acceleration is positive, it is a weak bear, if both velocity and acceleration are negative, it is a strong bear.
2 for strong bull
1 for the weak bull
-1 for weak bear
Creates a function that takes values of -2 for the strong bear. this function is the velocity of the principal indicator, and then the integral of this function forms the principal indicator.
how to use it?
"source" is used to change the source of the indicator,
"length" makes the indicator give a later but less signal.
you can use it to follow or analyze the trend. colors make it easy to use. learns about current or past trends by looking at colors. Like any trend indicator, it can give unsuccessful signals in a horizontal trend.

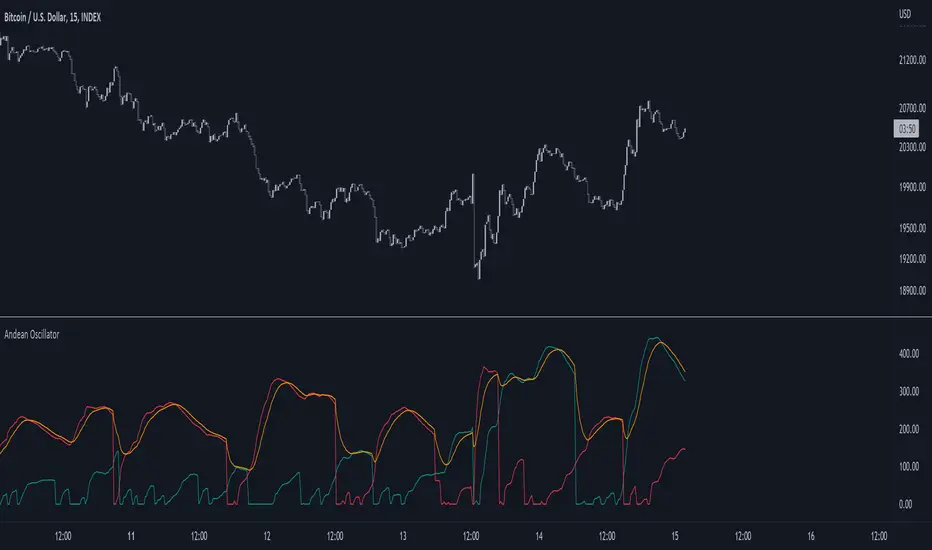
Andean OscillatorThe following script is an original creation originally posted on the blog section of the broker Alpaca.
The proposed indicator aims to measure the degree of variations of individual up-trends and down-trends in the price, thus allowing to highlight the direction and amplitude of a current trend.
Settings
Length : Determines the significance of the trends degree of variations measured by the indicator.
Signal Length : Moving average period of the signal line.
Usage
The Andean Oscillator can return multiple information to the user, with its core interpretation revolving around the bull and bear components.
A rising bull component (in green) indicates the presence of bullish price variations while a rising bear component (in red) indicates the presence of bearish price variations.
When the bull component is over the bear component market is up-trending, and the user can expect new higher highs. When the bear component is over the bull component market is down-trending, and the user can expect new lower lows.
The signal line (in orange) allows a more developed interpretation of the indicator and can be used in several ways.
It is possible to use it to filter out potential false signals given by the crosses between the bullish and bearish components. As such the user might want to enter a position once the bullish or bearish component crosses over the signal line instead.
Details
Measuring the degree of variations of trends in the price by their direction (up-trend/down-trend) can be done in several way.
The approach taken by the proposed indicator makes use of exponential envelopes and the naive computation of standard deviation.
First, exponential envelopes are obtained from both the regular prices and squared prices, thus giving two upper extremities, and two lower extremities.
The bullish component is obtained by first subtracting the upper extremity of the squared prices with the squared upper extremity of regular prices, the square root is then applied to this result.
The bearish component is obtained in the same way, but makes use of the lower extremities of the exponential envelopes.
Optimized Trend Tracker Oscillator OTTOOTTO - Optimized Trend Tracker Oscillator is a derivative of Anıl Özekşi's OTT - Optimized Trend Tracker:
It is more sensitive to price movements when compared to its ancestor OTT.
There are 2 more parameters of VIDYA moving average lengths FAST and SLOW.
Fast VIDYA has length of 10 bars and Slow VIDYA has 25.
Correction Constant is a crucial parameter to make the calculation more stable.
you can use 1000 to 100000000 by the powers of ten to obtain more accurate graphic values.
Buy and Sell signals make indicator more meaningful.

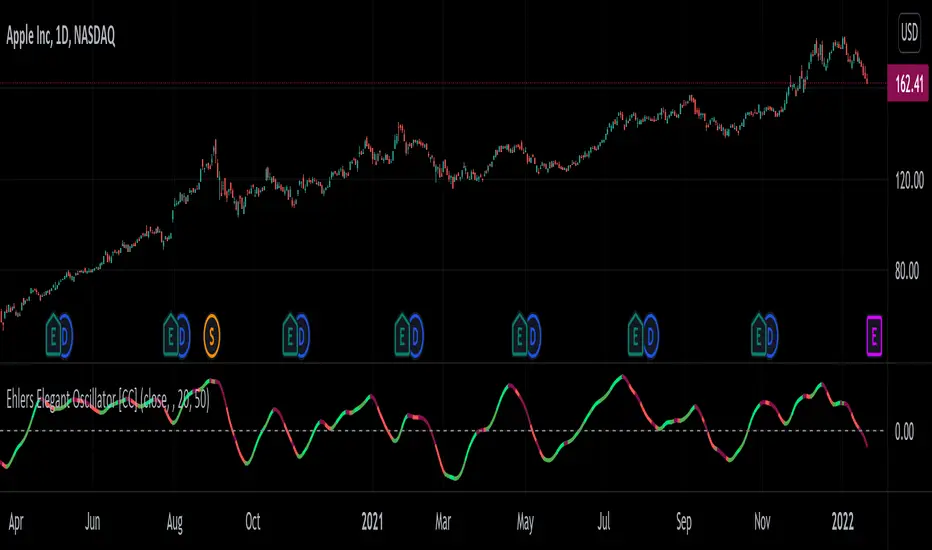
Ehlers Elegant Oscillator [CC]The Elegant Oscillator was created by John Ehlers (Stocks and Commodities Feb 2022 pg 21) and for those of you who don't know, he introduced the indicators for the Fisher Transform and Inverse Fisher Transform and this is a new updated version to that idea based on his latest research. This uses a soft limiter which he says is superior to a hard limiter. There are several ways to interpret this indicator. First if the indicator is above the 0 line then it is a long term bullish trend and below 0 a long term bearish trend. Second this indicator can be used for reversal points with the peaks and valleys. Finally when the indicator line starts moving higher for example it is a bullish short term trend and vice versa. I have included strong buy and sell signals in addition to normal ones so strong signals are darker in color and normal are lighter in color. Buy when the line turns green and sell when it turns red.
Let me know if there are any other indicators or scripts you would like to see me publish!
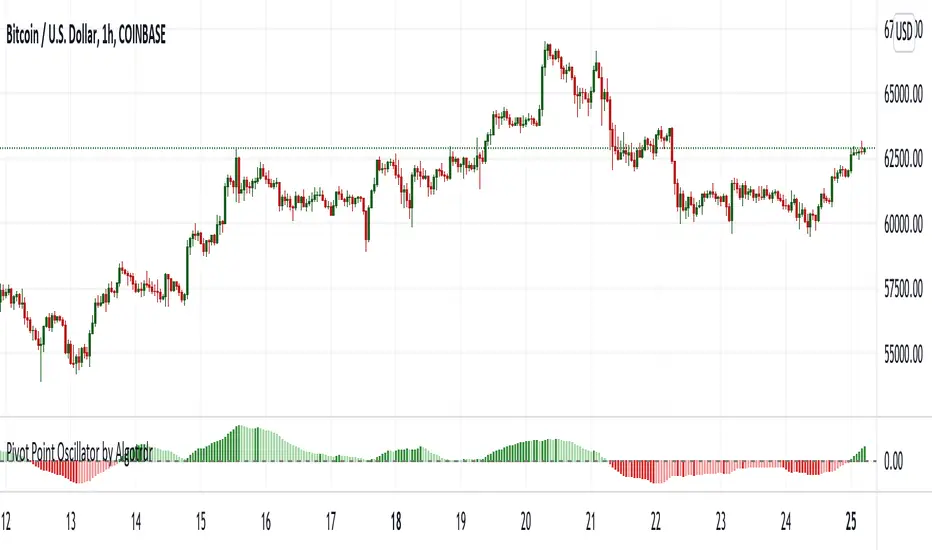
Pivot Point Oscillator by AlgotrdrThis script tracks moments where price closes over s/r levels on 3 sets of pivot points and turns it into an oscillator to help users analyze price movements at a glance. Enjoy!
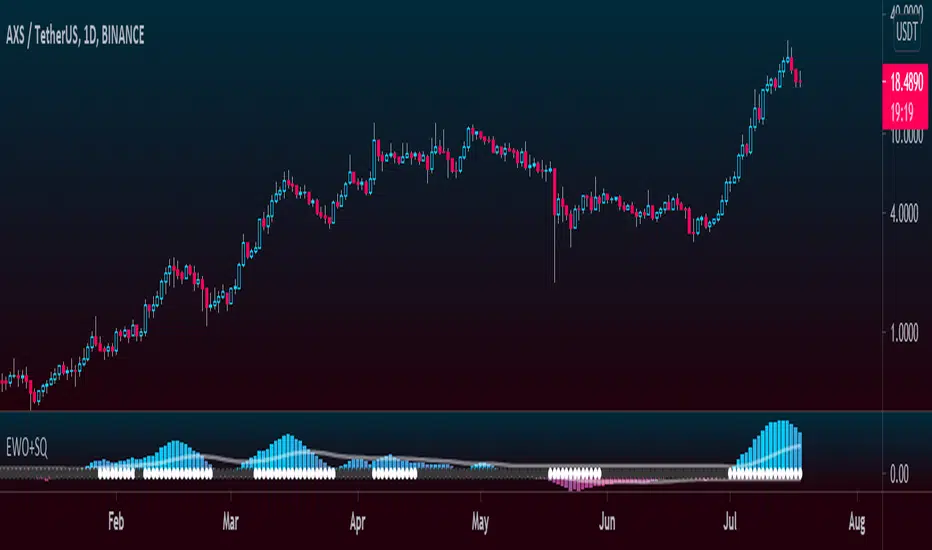
Elliott Wave Oscillator + TTM SqueezeThe Elliott Wave Oscillator enables traders to track Elliott Wave counts and divergences. It allows traders to observe when an existing wave ends and when a new one begins. It works on the basis of a simple calculation: The difference between a 5-period simple moving average and a 34-period simple moving average.
Included with the EWO are the breakout bands that help identify strong impulses.
To further aid in the detection of explosive movements I've included the TTM Squeeze indicator which shows the relationship between Keltner Channels & Bollinger Bands, wich highlight situations of compression/low volatility, and expansion/high volatility. The dark dots indicate a squeeze, and white dots indicates the end of such squeeze and therefore the start of an expansion.
Enjoy!
Center Of Gravity OscillatorThe COG Oscillator (center of gravity) is an indicator based on statistics and the Fibonacci golden ratio. It uses ALMA as a trigger and LSMA as "zero line". The trigger is set tight by default but can be tweaked by adjusting the window size and sigma in settings. This is a great indicator for setting up trades and spotting reversals. There are 2 main strategies that come with this indicator:
Strategy 1: Long positions are entered when current low point is higher than previous low. Short positions are entered as current high is lower than previous high. (Shown in image above)
Strategy 2 : If market is bullish long trades are entered as COG line crosses over red LSMA line. Traders have the option of scalping the first crossover or even scaling out of trade to close on second exit. This works the opposite for shorts when market is bearish.
Above shows different configurations of the indicator. Top shows length of 50, Middle has length of 21 and bottom is default 9.

Relative Difference Of Squares Oscillator [CC]The Relative Difference Of Squares Oscillator was created by Marco Alves (Stocks and Commodities Aug 2020 pg 10) and this is a heavily customized version of his indicator that works for single stocks instead of the entire market. I have included extra buy and sell signals to account for strong signals vs normal signals based on some user feedback I got. Buy when the line turns green and sell when it turns red. Keep in mind that this is a lagging indicator so good for trend confirmation.
Let me know if there are any other scripts you would like to see me publish!

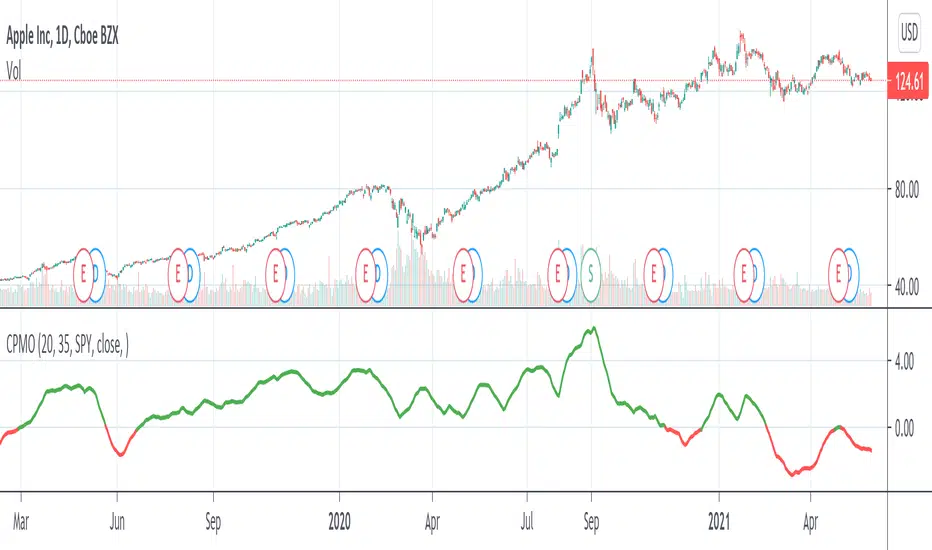
Compare Price Momentum Oscillator [CC]The Compare Price Momentum Oscillator was created by Vitali Apirine (Stocks and Commodities Aug 2020 pg 16) and this is a handy indicator to compare the momentum of the current symbol you are looking at to the s&p to determine the relative strength of the underlying security. Buy when the line turns green and sell when it turns red.
Let me know if there are any other scripts you would like to see me publish!
Flunki TWAP minus MTF TWAP Oscillator
Heys,
Herewith a another simple oscillator that show the difference in price between a selectable timeframe TWAP and another alternative selectable timeframe TWAP
This is shown as a histogram.
Use numeric TWAP values for minutes (30, 60 ,720 whatever) and D, 3D, W, M for higher values
There is also a global timeframe which will set the timeframe for a global alternate timeframe (instead of current chart resolution)
On top of that is a Moving Average of the histogram value, shown as a blue / red line with an option to highlight this MA crossing zero, and an option to colour bars to this line.
Simple idea : Code open
Enjoy !
Amazing Oscillator MTF MulticolorIngles
The amazing multitemporal oscillator, allows you to see in a single graph the Waves that move the market in different temporalities, that is, you will be able to see the market trend, the impulse movement, the forced movement, and the entry and exit points, as well as also how both collide with each other, to understand why the smaller waves succumb to the impulse of the larger waves.
Elliot already described them as such, in his legacy of the Elliot waves and their different sub-waves, just as Wycoff spoke of the theory of effort and result.
Español:
El oscilador asombroso multitemporal, permite ver en una sola grafica las Ondas que mueven el mercado en diferentes temporalidades, es decir, podrás ver la tendencia del mercado, el movimiento de impulso, el movimiento de fuerza y los puntos de entrada y salida, así como también como ambos chocan entre si, para entender porque las ondas mas pequeñas sucumben al impulso de las ondas de mayor tamaño.
Ya Elliot las describía como tal, en su legado de las ondas de Elliot y sus diferentes sub-ondas, al igual que Wycoff hablaba de la teoría de esfuerzo y resultado.

Amazing Oscillator MTF plusIngles
The amazing multitemporal oscillator, allows you to see in a single graph the Waves that move the market in different temporalities, that is, you will be able to see the market trend, the impulse movement, the force movement and the entry and exit points, as well as also how both collide with each other, to understand why the smaller waves succumb to the impulse of the larger waves.
Elliot already described them as such, in his legacy of the Elliot waves and their different sub-waves, just as Wycoff spoke of the theory of effort and result.
Español:
El oscilador asombroso multitemporal, permite ver en una sola grafica las Ondas que mueven el mercado en diferentes temporalidades, es decir, podrás ver la tendencia del mercado, el movimiento de impulso, el movimiento de fuerza y los puntos de entrada y salida, así como también como ambos chocan entre si, para entender porque las ondas mas pequeñas sucumben al impulso de las ondas de mayor tamaño.
Ya Elliot las describía como tal, en su legado de las ondas de Elliot y sus diferentes sub-ondas, al igual que Wycoff hablaba de la teoría de esfuerzo y resultado.

Recent Volume Higher Oscillator [Takazudo]This indicator has two lines that are the recent volume EMA and the past volume EMA. When the recent one is higher than the past one, it highlights the background. It means the volume is relatively getting higher.
This oscillator is designed to detect the entry timing for trend following strategy. It is said that we need to confirm the trend by the volume.

Customizable Percentage Price Oscillator (PPO)The PPO is basically the MACD but in percentage terms. This is better for comparing momentum across different securities.
This script is a standard PPO but with many options for customization. You can set the moving average type of the signal and the oscillator lines separately. You can also weight any moving average of the PPO by volume.
Supported Types of MA:
SMA
EMA
ALMA
HMA
WMA
Personally, I believe weighting by volume is helpful across markets but especially helpful for equities. I like to use 3,10,16 settings similar to Linda Raschke but with EMA instead of SMA. This indicator is especially useful for signaling trend continuation and generating exit signals. For entries, I believe this indicator should not be blindly followed and works better when combined with a trend or price action signal.
If there are requests for more types of moving average to be used with the PPO, I would be down to implement them, but I believe most moving averages are pretty similar.
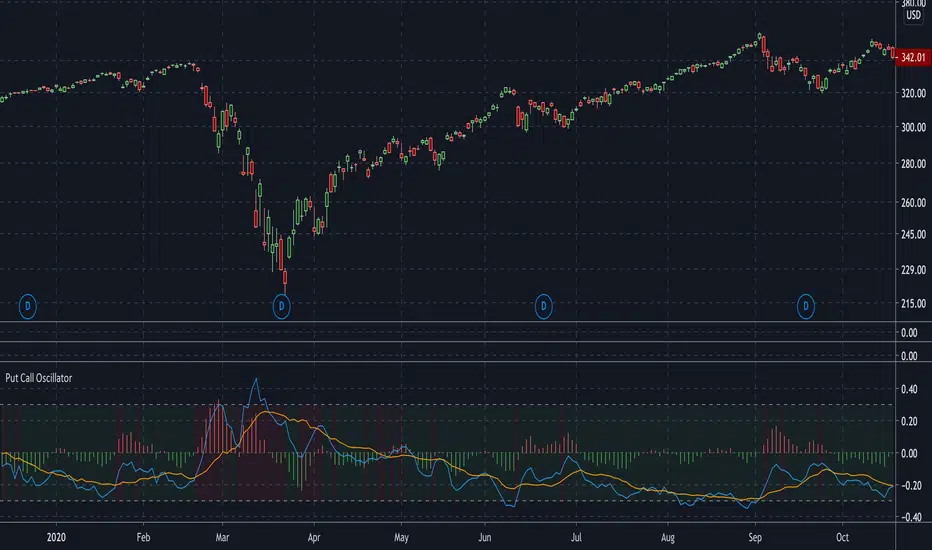
Put Call OscillatorThis is a volume-based oscillator used for detecting market sentiment.
This plots two moving averages of the CBOE S&P500 PCR (put call ratio), and a histogram to measure the distance between them. The histogram will generate signals of green (bullish) or red (bearish), depending on whether put volume is decreasing or increasing.
The moving averages are adjustable. They are set at 4 and 16 by default. Increasing the moving averages will generate less signals, while decreasing them will generate more signals.
The background will change color from red to green depending on whether the PCR is above or below 1.
I used capriole_charles script "Put/Call Ratio (PCR)" to help me build this.
Flunki VWAP minus MA OscillatorHerewith a simple oscillator that show the difference in price between a Moving Average of the price, and the current VWAP
This show as a histogram
On top of that is a Moving Average of the histogram value, shown as a blue / red line with an option to hight these crossing and also crossing zero
Simple idea ; code open.

Linear Correlation OscillatorYou don't need loops to get the rolling correlation between an input series and a linear sequence of values, this can be obtained from the normalized difference between a WMA and an SMA of the input series.
The closed-form solutions for the moving average and standard deviation of a linear sequence can be easily calculated, while the same rolling statistics for the input series can be computed using cumulative sums. All these concepts were introduced in previous indicators posts long ago.
This approach can allow to efficiently compute the rolling R-Squared of a linear regression, as well as its SSE.
Using the rolling correlation as a trend indicator is often attributed to John Ehlers with the correlation trend indicator (Correlation As A Trend Indicator), but the applications of this precise method can be traced back quite a while ago by a wide variety of users, in fact, the LSMA can be computed using this precise indicator. You can see an example where the correlation oscillator appears below:
WaveTrend Oscillator v2 [Aspenforest]This is your regular WaveTrend Oscillator, which was originally scripted by LazyBear, but I updated the source code to Pine Script version 4, refactored the logic, and made the indicator more aesthetically pleasing.

Smart Money Oscillator [Nic]Smart money index (SMI) or smart money flow index is a technical analysis indicator demonstrating investors' sentiment. The index was invented and popularized by money manager Don Hays. The indicator is based on intra-day price patterns.
The main idea is that the majority of traders (emotional, news-driven) overreact at the beginning of the trading day because of the overnight news and economic data. There is also much buying on market orders and short covering at the opening. Therefore, the basic strategy is to bet against the morning price trend and bet with the evening price trend. The SMI may be calculated for many markets and market indices (S&P 500, Dow Jones, etc.)
This script turns the smart money index into an oscillator so you can determine the relative strength of the smart money.
Variable Linear Regression With Pearsons R OscillatorThis is the Oscillator that is meant to go with the Variable Linear Regression With Pearsons R Script. Set this to match the settings you have on the other script.
To use this, you want to do trades something like this:
The bottom -0.80 (green line) means that the trend is very strong in the upward direction. This almost always means it's about to finish its trend soon and reverse the other direction. If you see the other linear regression lines also coincide with this result it would best to get ready to reverse your position and do a short once some other indicators show you it is turning the other direction in addition to this.
The reverse for longing would be the case after a large downtrend and the 0.80 line (red line) is touched by many of the linear regressions, usually it means the downtrend is ending and there is a good buy opportunity soon.
This is called a variable linear regression systems because you can set as many variable linear regressions as you want. I have capped it at 10 but you can modify the code to raise this if really necessary. Every color is customizable for each different linear regression trend.

Percentage Oscillator Swing highest high and lowest lowThis is a simple but efficient indicator.
Its made from an oscillator, which is calculated from the current close price with the highest high and the lowest low over a period of time.
This way we can see how much prices has changed over a X ammount of candles ( in positive or negative ) .
Bitcoin DAA OscillatorAn oscillator of Bitcoin's Daily Active Addresses (DAA) and fundamental metric of the utilization of the Bitcoin network.
Helps to identify:
Potential buy zones (green) - when the network utilization is low & increasing
Potential sell zones (red) - when the network utilization is high & decreasing
