QQE ADQQE AD is based on my Average Difference Oscillator (AD line). Basically, this indicator is a QQE of AD.
When the green line (AD line) is above the red line (QQE line), go long, and vise versa.
I encourage you to play around with the settings to find what is optimal for your system.
I have a feeling that this will be a good exit indicator.
Enjoy, and as always hit the like & follow buttons :)
Buscar en scripts para "oscillator"

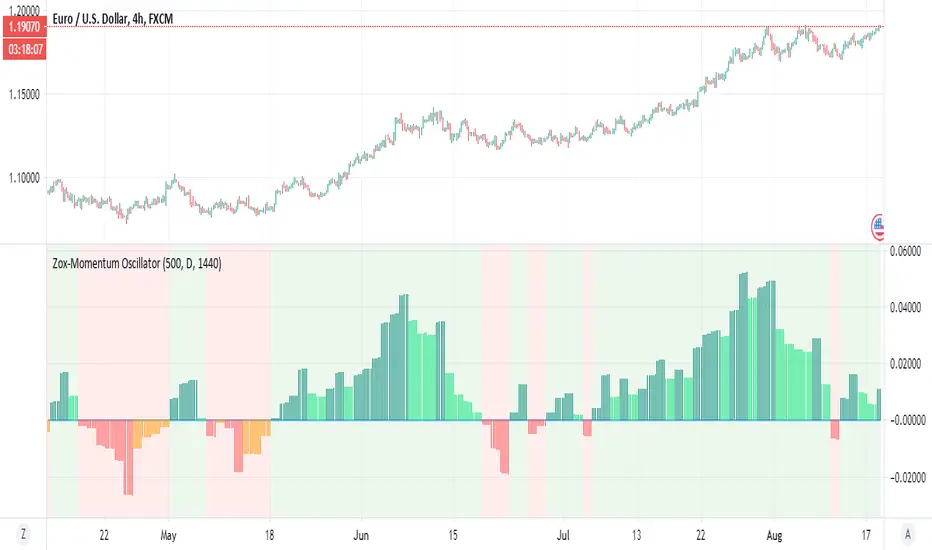
Zox-Momentum OscillatorThis is a new member of the Zox indicator which is based on momentum
look pretty accurate
green is stron buy
lime =weak buy
red=strong sell
orange=weak sell
its no repainting MTF as it has no security attach to it
try to play with length and MTF and candle time for better results
examples crypto
stocks
index
gold
silver
dow
forex
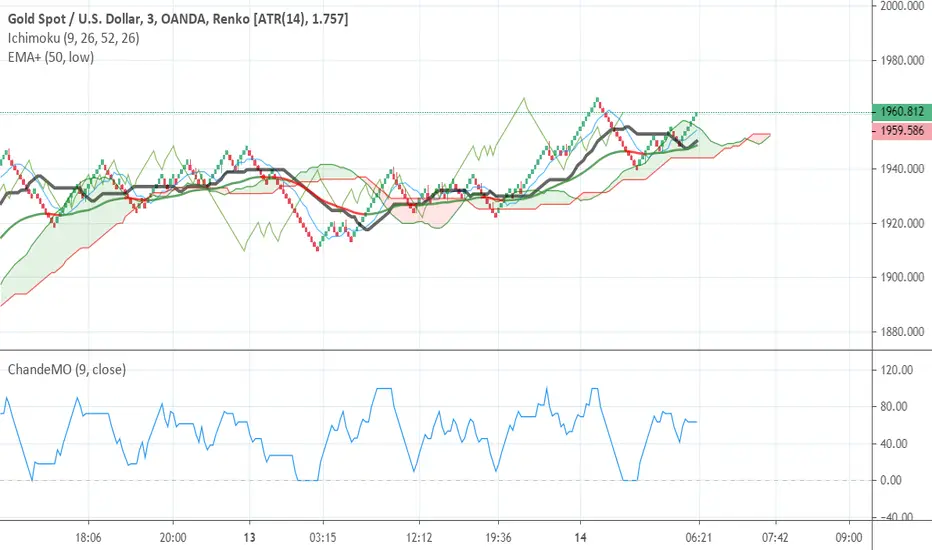
Chande Momentum Oscillator - Fixed (0,100)I just did little trick to change the old scale to (0,100)
Aroon OscillatorThis indicator is aimed towards people who like Aroon.
The indicator produces the same signals as Aroon, but presents them in columns.
Enjoy guys!

Stochastic_Impulse_%k ver0Stochastic Oscillator combined with a Rate of Change Indicator. Current period - previous period Stochastic . The Stochastic has no smoothing and is the Rate of Change of %k value only.


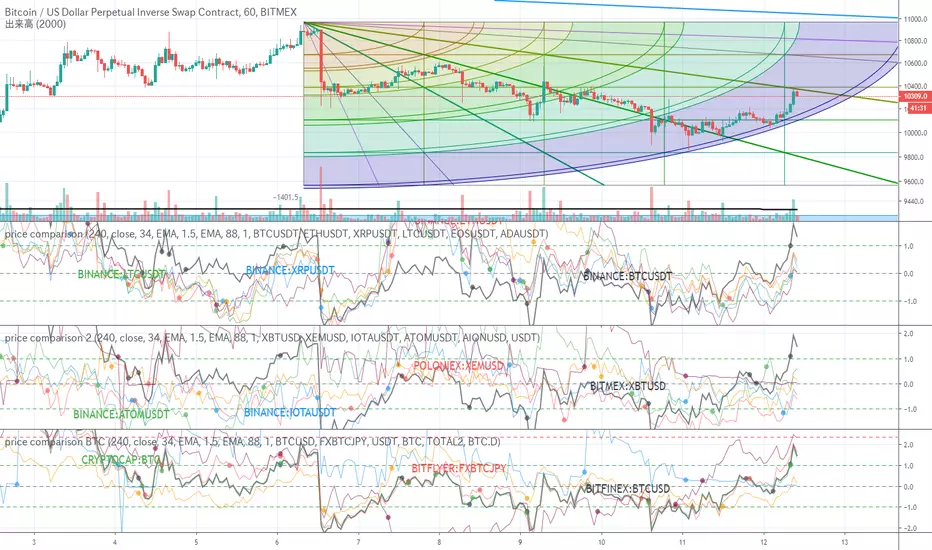
price comparisonI wanted to compare multiple prices, so I created it.
The price of 6 can be compared at once.
Since simply different ones cannot be compared, the Keltner channel is made into an oscillator and compared.
I added an alert that broke the Bollinger Band.
複数の価格比較をしたかったので、作成しました。
6個の価格が一気に比較できます。
単純に異なるものは比較できないので、ケルトナーチャンネルをオシレータ化して比較しています。
ついでにボリンジャーバンドをブレイクしたアラートを付けておきました。

BitGin 3 Scalping Method AlertCombined 3 indicators
WaveTrend with Crosses
Ehlers Stochastic CG Oscillator
Slow Stochastic

KusKus Starlight + EMAThe original script was posted on ProRealCode by user Nicolas.
The KusKus Starlight indicator is an oscillator built using Fisher price transformation. It is also normalized over the last range periods. Smoothing can be adjusted in the parameters.
This version adds an EMA to the histogram


linreg-histogramThis oscillator is based on linear regression slope
there is two system how the use it first is more conservative which is buy if cross the zero and sell if cross down the zero.
the second is based on direction of the slope - if the slope go up or down .
lets say the asset fall to bellow zero and the price start to pick then the color of histogram will be change from dark red to light red
and before its crossing the zero you can buy
on the other hand let say the asset was going strong high above zero then you can look if the color start to be lighter and the direction is down in this scenario you sell even it above the zero as the momentum is negative
here example of 5 min forex where you can use either system 1 or system 2

Sudhir - Center of Gravity Oscillator with Standard DeviationGives you a sense of when a move is normal. Modified from existing work from others as I learn the language.

COLOUR CODED ULTIMATE OSCILLATOR WITH LEVELS (70/50/30)Just added 70/30/50 levels to @LazyBear 's "Color Coded UO" script.
Happy Trading!

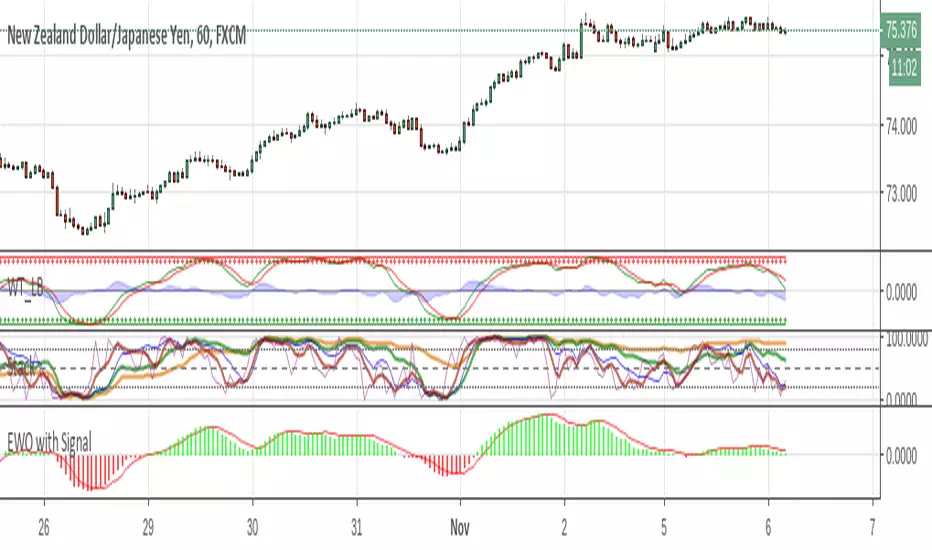
Elliott Wave Oscillator w/ Signal LineI just added a signal line to Koryu's code to fit my trading style. When the signal line crosses zero, it confirms to me that it's safe to trade.

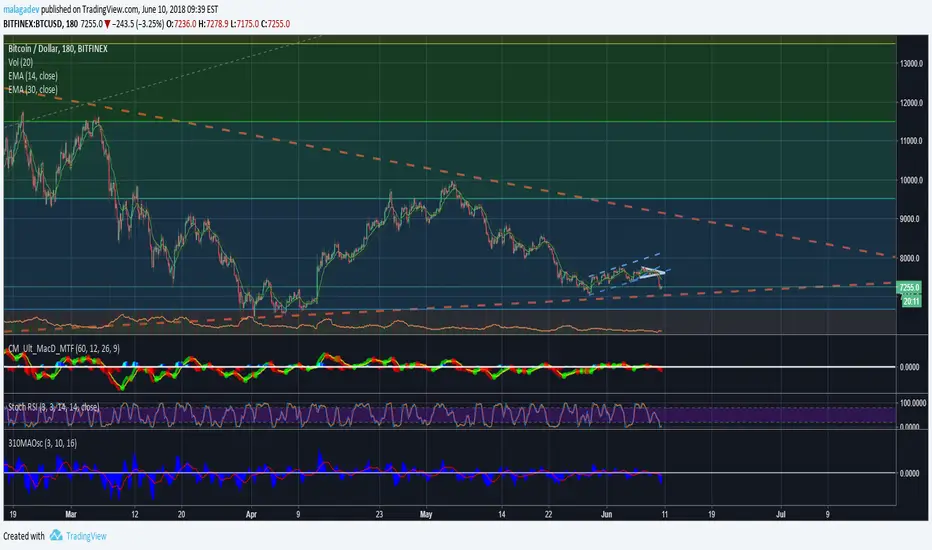
3-10 MA Oscillator (Wyckoff) by malagadev- If ControlSMA(16) exceeds 0 means market is bullish, below 0 means market is bearish.
- Difference between SMA(3,10) is represented with blue area.
- You can operate using changes in color or trend, or simply knowing that once 0 is crossed upwards, it means the pullback is proportional so we just need a simple pattern in the price or, entering after it just crosses.
- It's better to open positions in the first pullback after the ControlSMA(16) firstly crosses 0 ("First Cross").
- It's possible to operate using momentum divergences.

OBV Oscillatori like lazyBear's script.
it is also from his.
and i added ma.
that ma can help you to read volume moving direction.
i just think so.

DSS Bresser Scalper Improved by ShizaruThe original script was posted on ProRealCode by user Nicolas.
This indicator is derived from Bressert's works in market cycles (Double Smooth Stochastic). It is converted from MT4 code and it is a part of a complete trading strategy of scalping, I certainly post on forums soon.
The DSS indicator is intended to spot overbought and oversold areas with less false signals than any other stochastic indicator. When the oscillator remains longer into one of the area, it is the beginning of a trend change.
I found it useful to spot price rebound while in a already formed trend. Of course, because stochastic is most used to find price reversal over a calculated price center, this indicator can also be nicely used in ranging markets.
Credits to: www.prorealcode.com
