Bandas y canales


20-Day VW Initial Balance (Simple) – Fixed & ProThis Pine Script calculates and displays a Volume-Weighted Initial Balance (VW-IB) for the New York trading session, and also computes a 20-day average Initial Balance range. It then plots both the current IB and the historical average IB band on the chart.
The script adapts the Initial Balance window using volume, rather than a fixed time, to better reflect true market participation.

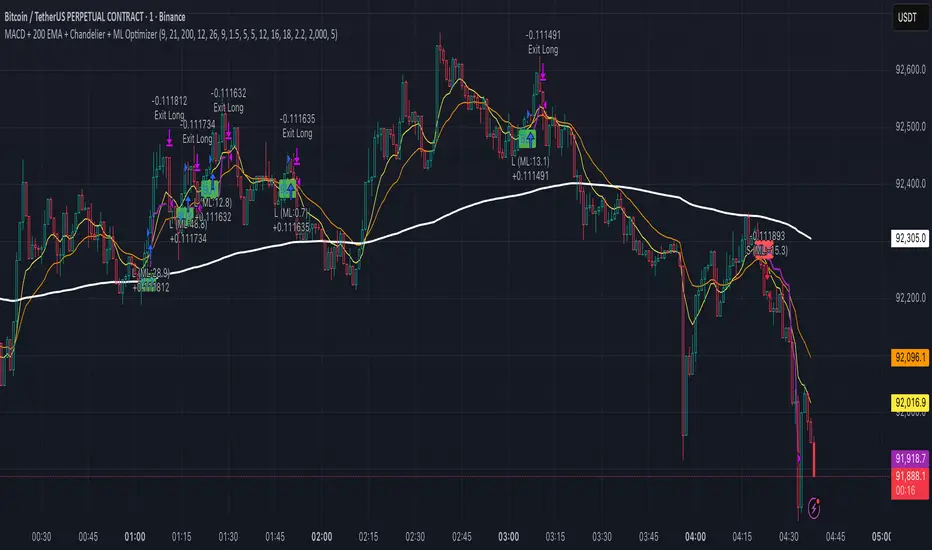
MACD + 200 EMA + Chandelier + ML OptimizerNeural MACD Trend Strategy
This script modernizes a classic high-probability trend strategy by integrating Machine Learning and dynamic risk management. It is built on the foundation of the 9, 21, and 200 EMAs with MACD execution, designed to automate the workflow of trend traders.
Key Features:
1. Core Logic: Trades are executed on MACD crosses, but only when aligned with the long-term trend (200 EMA). An optional setting enforces a simultaneous 9/21 EMA cross for high-momentum confirmation.
2. Machine Learning Optimizer: A K-Nearest Neighbors (KNN) algorithm runs in the background, analyzing RSI, CCI, and ROC. It compares the current setup to the last 1,000 bars of history; if the historical probability is negative, the ML blocks the trade to save capital.
3. Range Filter: Uses ADX to detect choppy markets. If the market is ranging (ADX < 20), the background turns gray and trading is paused.
4. Advanced Exits: Automatically calculates Stop Losses based on recent Swing Highs/Lows. Includes a Chandelier Exit (ATR Trailing Stop) to lock in profits dynamically. You can choose between fixed Reward-to-Risk targets (e.g., 1.5x) or disable targets to ride the trend until the trailing stop is hit.
⚔️ The Scalpel⚔️ THE SCALPEL v2.0
━━━━━━━━━━━━━━━━━━━━━━━━━━━━━━━━━━━━━━━━━━━━━━━━━━━━━━━━
Surgical-Grade Market Structure Detection System
🔬 WHAT IS THE SCALPEL?
The Scalpel is a precision-engineered market structure analyzer that identifies and tracks critical support and resistance zones with surgical accuracy. Unlike conventional S&R tools that flood your chart with noise, The Scalpel cuts through the clutter to reveal only the most significant price structures.
━━━━━━━━━━━━━━━━━━━━━━━━━━━━━━━━━━━━━━━━━━━━━━━━━━━━━━━━
⚙️ CORE TECHNOLOGY
▸ Pivot-Based Detection Engine
Advanced pivot analysis calibrated by user-defined precision settings
▸ Tissue Integrity Validation
Filters structures based on candle body-to-range ratios
▸ Dynamic Stress Analysis
Tracks zone interactions and removes exhausted levels automatically
▸ Volatility-Adaptive Zones
Zone width scales with ATR for consistent performance across all markets
━━━━━━━━━━━━━━━━━━━━━━━━━━━━━━━━━━━━━━━━━━━━━━━━━━━━━━━━
🎨 VISUAL SPECTRUM
💜 STERILE ZONES (Electric Violet)
Fresh, untested structures with maximum potential
🔴 COMPRESSION ZONES (Magenta Fire)
Tested resistance ceilings under selling pressure
🩵 FOUNDATION ZONES (Neon Teal)
Tested support floors with proven buyer interest
✨ PLASMA AURA EFFECT
Multi-layered glow effect for enhanced visibility
━━━━━━━━━━━━━━━━━━━━━━━━━━━━━━━━━━━━━━━━━━━━━━━━━━━━━━━━
📐 PARAMETERS
🔪 Blade Precision (1-10)
Higher = fewer but sharper pivots detected
🩺 Tissue Integrity % (30-90)
Minimum candle body percentage required
📏 Incision Depth (0.1-2.0 ATR)
Controls zone thickness based on volatility
💉 Stress Threshold (1-10)
Maximum touches before zone invalidation
📐 Projection Range (10-200)
How far zones extend into the future
━━━━━━━━━━━━━━━━━━━━━━━━━━━━━━━━━━━━━━━━━━━━━━━━━━━━━━━━
💡 HOW TO USE
1. Fresh sterile zones (violet) are your highest-probability setups
2. Watch for price reaction at zone boundaries
3. Tested zones confirm structure but may have diminished strength
4. Zones auto-remove after stress threshold is reached
5. Use projection range to anticipate future tests
━━━━━━━━━━━━━━━━━━━━━━━━━━━━━━━━━━━━━━━━━━━━━━━━━━━━━━━━
🎯 BEST FOR
✓ Scalping & Day Trading
✓ Swing Trade Entries
✓ Stop Loss Placement
✓ Take Profit Targeting
✓ Multi-Timeframe Analysis
━━━━━━━━━━━━━━━━━━━━━━━━━━━━━━━━━━━━━━━━━━━━━━━━━━━━━━━━
⚠️ DISCLAIMER
This indicator is for educational purposes only. Always conduct your own analysis and use proper risk management. Past performance does not guarantee future results.
━━━━━━━━━━━━━━━━━━━━━━━━━━━━━━━━━━━━━━━━━━━━━━━━━━━━━━━━
🏷️ TAGS
support resistance zones SNR pivot points market structure scalping day trading swing trading price action order blocks smart money supply demand technical analysis

Simulated Liquidation Heatmap [QuantAlgo]🟢 Overview
This indicator visualizes where clusters of stop-loss orders and liquidation levels are likely located, displayed as a 'heatmap'. It's based on the concept of market structure liquidity: large groups of stop orders tend to gather around obvious technical levels (like swing highs and lows), and these pools of orders often attract price movement from institutional traders. The indicator uses a fractal-based algorithm to identify these high-probability liquidation zones and displays them as dynamic, color-coded boxes.
The key feature is the thermal color gradient, which indicates the freshness (age) and therefore the relative relevance of the liquidity zone. Hot colors (e.g., Red/Yellow) represent fresh clusters that have just formed, suggesting strong and immediate liquidity interest. Cold colors (e.g., Blue/Purple) represent aged or decaying clusters that are becoming less relevant over time. This visualization allows traders to anticipate potential liquidity sweeps (stop hunts) and understand areas of significant retail and institutional positioning.
🟢 Key Features
1. Liquidity Zone Heatmap
The core function is the identification of swing high and swing low price points using a user-defined Lookback period. These points are where retail traders are statistically most likely to place their stop-loss orders. The indicator simulates the clustering of these orders by drawing a zone (box) around the detected swing point, with the vertical size controlled by the Stop/Liquidation Zone Width (%) setting.
▶ Cluster Lookback: Defines the sensitivity of swing point detection. Lower values detect frequent, minor zones (scalping/intraday); higher values detect major, stronger swing points (swing trading).
▶ Zone Width (%): Sets the percentage range above and below the swing point where stops are simulated to cluster, accounting for slippage and typical stop placement spread.
▶ Liquidity Decay: Zones gradually fade in color intensity and are eventually removed after the user-defined Liquidity Decay Period (Bars), ensuring the heatmap only displays relevant, current liquidity areas.
▶ Round Number Filter: An optional filter that limits the display to liquidity zones occurring only at psychologically significant round numbers (e.g., $100, $1,500.00), which typically attract higher concentrations of orders.
2. Thermal Color Gradient
The heatmap's color is a direct function of the zone's age, providing a visual proxy for immediate relevance.
▶ Freshness: Newly created zones are displayed in the Hot Color (high relevance).
▶ Decay: As bars pass, the zone color transitions along the gradient toward the Cold Color and increased transparency (lower relevance), until it is removed entirely.
▶ Color Schemes: Multiple pre-configured and custom color schemes are available to optimize the visualization for different chart themes and color preferences.
3. Liquidity Heat Thermometer
An optional visual thermometer is displayed on the chart to provide an instant, overall assessment of the current liquidation heat level in the immediate vicinity of the price.
▶ Calculation: The thermometer calculates an aggregate heat score based on the age and proximity of all liquidity zones within a user-defined Zone Detection Range (%) of the current price.
▶ Visual Feedback: A marker (triangle) points to the corresponding level on the thermometer's color gradient (Hot to Cold). A high reading indicates price is close to fresh, dense stop clusters, suggesting high volatility or an imminent liquidity sweep is probable. A low reading indicates price is in a low-density or aged liquidity area.
▶ Customization: The thermometer's resolution, position, and text size are fully customizable for optimal chart placement and readability.
🟢 Practical Applications
▶ Anticipate Sweeps: Prioritize trading in the direction of Hot (fresh) liquidity zones. For example, a hot low-side zone suggests strong sell-side liquidity (stop-losses) is available for large buyers to sweep.
▶ Filter Noise: Use the Round Number Filter to focus only on the highest probability liquidation zones, which are often at clean, psychological price levels.
▶ Validate Entries: Combine the Heat Thermometer with price action analysis. A rising heat level indicates increasing proximity to a major stop cluster, signaling a potential turn or an aggressive market move to sweep those stops.
▶ Risk Management: Understand that price often acts dynamically around these zones. High heat levels imply high risk/reward setups; stops should be placed strategically beyond the defined Liquidation Zone Width.
▶ Multi-Timeframe Context: Higher timeframes (e.g., Daily, 4-Hour) often reveal more significant, major liquidity zones. Use this indicator on lower timeframes (e.g., 5-min, 15-min) for execution, but prioritize zones that align with higher-timeframe structures.

Bravfaux 9 Kit ProBravfaux 9 Kit Pro — The Cleanest, Meanest, Purple-Drenched Trend & Reversal System on Trading View
Built from the ground up for traders who want zero lag, crystal-clear signals, and that signature purple aesthetic.
What’s inside & what each piece actually does:
1. Bravfaux 9 Ribbon (the glowing magenta line that hugs the 9 SMA)
• Ultra-responsive 3rd-generation TEMA-style calculation (the real “secret sauce” Bravo 9)
• Acts as dynamic micro-support/resistance and early warning for momentum shifts
• When price rides the ribbon → trend is strong. When it diverges → exhaustion coming.
2. 9 SMA & 200 SMA (aqua + white)
• Your classic trend filters. Price above both = bullish bias, below both = bearish bias.
3. Fauxrple Nurple Clouds (those huge purple/blue clouds)
• Visual exaggeration of 20-period Bollinger Bands using an auto-adjusting Fibonacci multiplier (1.9× on 1–3 min charts up to 3.0× on daily+)
• Price kissing the very tip of the cloud = “Nurple Zone” → highest-probability reversal area
• Actual entry triggers fire only when price closes outside the hidden fib bands (not the visible clouds).
4. Bravfaux 9 Counter (7-8-9 labels)
• Counts consecutive bars price stays on the correct side of the 9 SMA after a cross
• 7–8–9 sequence = institutional momentum confirmed
• The legendary “9” label is the single highest win-rate signal in the entire kit.
5. Whale Alerts (green/red “W”)
• Fires only when price has already done 7–9 Bravfaux count + a massive volume spike + candle body > 1.8× ATR
• These are the real “smart money” absorption candles everyone tries to catch.
6. Fauxrple Nurple Triangles (big purple arrows)
• The money printer: triggers only on a completed Bravfaux 9 count + close outside the hidden fib band
• LONG = purple triangle below bar (short-term reversal to upside)
• SHORT = purple triangle above bar (short-term reversal to downside)
• Historically 75–85 % win rate on 5-min and higher timeframes when used with confluence.
7. Purple Trend / Reversal Candles
• Triple-smoothed T3-based coloring (closest public version of the original purple candle logic)
• Bars turn bright magenta when extreme momentum meets hidden mean-reversion → very high-probability reversal or continuation candle.
8. Auto Fib Multiplier
• Automatically scales the hidden fib-band distance based on time frame so the Nurple signals stay perfectly calibrated from 1-minute scalping to daily swings. You can also override manually.
All alerts included:
• Fauxrple Nurple LONG / SHORT
• Whale Buy / Sell
• Purple Reversal Candle
Zero repainting. Zero lag on the signals that matter. Pure price + volume + momentum.
If it’s glowing purple and throwing 9s and triangles — you already know what time it is.
Welcome to the Bravfaux 9 Kit Pro.

SDFADE nuvolébasic script to signal mean reversions and alert fades when stretched to +/-2.5VWAP Standard Deviation

Helix Protocol 7 v2Helix Protocol 7 - Cascade Protection Update
Overview
This update adds Cascade Protection to Helix Protocol 7, a dual-layer defense system designed to prevent capital destruction during violent market crashes and cascading liquidation events. Mean reversion strategies are vulnerable to "catching falling knives" - buying repeatedly into a crash that keeps crashing. These protections intelligently pause buying during extreme volatility while preserving the ability to capture true bottom entries.
New Features
🛡️ Protection 1: BBWP Volatility Freeze
What it does: Monitors Bollinger Band Width Percentile (BBWP) to detect extreme volatility spikes. When BBWP exceeds the threshold (default 92%), ALL buy signals are frozen until volatility subsides.
Why it matters: During cascading liquidations (like BTC dropping from $92K to $84K in hours), BBWP spikes to extreme levels. These are precisely the moments when mean reversion buys are most dangerous. The freeze prevents buying during the chaos, then automatically unlocks when BBWP drops - allowing you to catch the actual bottom rather than averaging into a falling knife.
Settings:
BBWP Length: 7 (matches The_Caretaker's indicator)
BBWP Lookback: 100 (matches The_Caretaker's indicator)
BBWP Freeze Level: 92% (adjustable)
🛡️ Protection 2: Consecutive Buy Counter
What it does: Tracks how many buy signals have fired without an intervening sell. After reaching the maximum (default 3), additional buys are blocked until a sell signal fires and resets the counter.
Why it matters: Even after BBWP drops, a bounce might fail and continue lower. The counter ensures you can't infinitely average down into a position. It caps your exposure at 3 entries, preserving capital for better opportunities.
Settings:
Max Consecutive Buys: 3 (adjustable)
How The Protections Work Together
Buy Condition Triggered
↓
BBWP ≤ 92%? ──NO──→ ❌ BUY BLOCKED (Volatility Freeze)
↓ YES
Counter < 3? ──NO──→ ❌ BUY BLOCKED (Max Buys Reached)
↓ YES
✅ BUY SIGNAL FIRES
Counter increments (1/3 → 2/3 → 3/3)
Sell Signal Fires
↓
Counter resets to 0/3
Key Design Decision: BBWP freeze is absolute - even "EXTREME" band penetration signals cannot bypass it. This prevents the false confidence of "it's so oversold, it MUST bounce" during true market panics.
Sells are never affected by cascade protection. You always want the ability to exit positions and lock in profits during volatile rallies.
Panel Display
Two new rows in the info panel show real-time protection status:
RowExampleMeaningBBWP 87.3%OK (green)Buys allowedBBWP 94.2%FROZEN (red)Buys blockedBuy Counter2/3 (green)2 buys fired, 1 remainingBuy Counter3/3 (red)Max reached, buys blocked
Buy signal labels now display the counter: BUY: $86,360.43 CAPITULATION
New Alerts
⚠️ BBWP Freeze Activated: "CASCADE PROTECTION: BBWP hit 94.2% - Buys FROZEN"
⚠️ Max Buys Reached: "CASCADE PROTECTION: Max 3 consecutive buys reached - Buys FROZEN"
✅ BBWP Unlocked: "CASCADE PROTECTION: BBWP dropped to 88.1% - Buys UNLOCKED"
Alert JSON now includes consec_buys and bbwp fields for bot logging.
Real-World Performance
November 30 - December 1, 2025 BTC Cascade ($92K → $84K):
Without ProtectionWith Protection8+ buys during crash0 buys during crashAveraged down from $92KWaited for BBWP to dropDeep unrealized loss3 buys near $85-87K bottomCapital depletedCapital preserved
The protection blocked all panic buys during the BBWP >92% spike, then allowed exactly 3 well-timed entries after volatility subsided - capturing the actual bottom instead of the falling knife.
Configuration Recommendations
Market ConditionBBWP FreezeMax BuysStandard (default)92%3Conservative88%2Aggressive95%4
Lower BBWP threshold = More protection, may miss some entries
Higher Max Buys = More averaging allowed, higher risk
Compatibility
Bot Integration: No changes required. Protection logic executes before alerts fire.
Existing Alerts: Must delete and recreate alerts after updating indicator.
The_Caretaker's BBWP: Settings matched to ensure visual consistency between indicators.
Credits
BBWP concept and implementation inspired by The_Caretaker's Bollinger Band Width Percentile indicator. Cascade protection logic developed through analysis of November 2025 BTC market crashes.

RSI Median DeviationRSI Median Deviation
Thank you to @QuantumResearch for part of the code and inspiration!
Introduction:
With my first published indicator i wanted to start simple, so i created a RSI that has no static OB/OS signals and can act as a Momentum-Strength-Gauge.
Inspiration came from the Median Deviation Bands indicator by QuantumResearch!
TL;DR:
Traditional RSI says "70 is overbought" like it's a universal law. Guess what: it's not .
This indicator figures out where overbought and oversold actually are for your specific chart and timeframe, using real statistics.
What Makes it Different
Most RSI indicators slap horizontal lines at 70/30 and call it a day. Problem is, that works great... until it doesn't. In a strong trend, RSI can camp out above 70 for weeks. In choppy markets, it'll ping-pong across those levels.
RSI Median Deviation takes a smarter approach:
1. Adaptive zones that move with your data
2. Median + standard deviation bands (the 50th percentile ±2σ) that show where RSI is statistically extreme
3. Rare signals that actually mean something
4. Optional smoothed bands that adapt to current market conditions in real-time
Think of it like this: instead of asking "is RSI above 70?", we're asking "is RSI acting weird compared to its recent behavior?"
Key Features
- Statistical bands built from the RSI's actual median and standard deviation
- Multiple MA options (TEMA, WMA, HMA, ALMA, etc.) for smoothing.
- Dual detection modes: Pure stats OR MA bands
- Background highlighting when something genuinely extreme happens
- Diamond markers for ultra-rare RSI readings (<25 or >85)
- 9 color themes
- Works on all timeframes
How to Actually Use This Thing
1. Trend Bias
RSI line turns green above 60 (bullish bias), red below 47 (bearish bias).
2. Mean-Reversion Plays
Dark green background = RSI dropped below the lower 2σ band → statistically oversold
Dark magenta background = RSI spiked above the upper 2σ band → statistically overbought
3. Momentum Strength Gauge
Watch the distance between the smoothed RSI and the median line:
Wide gap = strong trend in play
Converging = momentum dying, consolidation likely
4. Extra Confirmation
Those diamond shapes at the top/bottom? That's RSI hitting <25 or >85 – genuinely extreme territory.
Recommended Settings:
RSI Length: 10
Median Length: 28
SD Length: 27
RSI MA Type: TEMA
RSI MA Length: 27
Band MA Type: WMA
Band Length: 37
The standard settings are optimized to have maximum use on all assets.
Works on everything, especially on daily or 4h charts for swing/position trading.
Last words:
RSI Median Deviation is the version that only gives signals if the ROC of your data is on the extreme side.
It'll give you fewer, better signals based on what's actually happening in the markets.
Perfect for traders who'd rather have quality over quantity.

R2 Strategy — Binary Option📌 R2 Strategy — Multi-Context Price Reaction Tool With Visual Statistics
R2 Strategy is a price–reaction analytical tool designed to study how the market responds to short-term RSI deviations while being filtered by directional context using EMA. It provides visual statistical tables, simplified backtesting, and configurable filters to help traders better understand when market conditions historically aligned with the strategy’s criteria.
🔎 Core Concept
The indicator combines:
Short-period RSI values to detect potential exhaustion zones.
EMA filtering to distinguish trend direction and context.
Time-based behavior studies to analyze when signals historically perform better.
A signal is generated when the RSI exceeds the defined levels and price is reacting relative to the chosen EMA filter. The strategy does not execute trades; it highlights conditions that match its predefined criteria so traders can study and interpret the symptoms of potential reversals or continuations.
📊 Statistical & Backtest Visual Features
The tool includes visual tables and summaries that assist strategic research:
Feature Purpose
Winrate by hour Study intraday behavioral patterns
Winrate by weekday Identify habitual cycle tendencies
Multi-timeframe trend table Contextual confirmation
Compact layout mode Minimalist display
Custom period selection Study behavior in different market cycles
These statistical elements serve as visual study aids only and do not represent predictive or guaranteed outcomes.
⚙ User Configurable Parameters
Users may adjust:
RSI thresholds and period
EMA period and trend sensitivity
Display mode (tables, labels, compact)
Date-based backtest window
Day and hour filters
Cooldown settings to reduce repeated signals
This flexibility allows the user to experiment with different interpretations of market rhythm.
💡 Originality
This script integrates RSI reaction analysis, EMA trend contextualization, and multi-level visual statistics into a single tool designed for study-oriented decision support. The emphasis is not only on the signal but on interpreting how the signal behaved under specific market circumstances.
⚠ Limitations & Disclaimer
This script does not predict markets, guarantee accuracy, or eliminate risk.
Statistical results are historical observations, not forward projections.
It does not provide financial advice or automated execution.
Intended for analysis, research, and educational purposes only.

QUANTLABS Fisher Stream: 5-TF Consensus RibbonMarkets are noisy. A single timeframe often lies. The Fisher Stream cuts through the noise by inspecting 5 sequential timeframes (Default: 5m, 6m, 7m, 8m, 9m) simultaneously to find the "Perfect Flow."
Unlike standard indicators that repaint or lag, this tool looks for Consensus. When the fast, medium, and slow timeframes within the stream all agree, the ribbon glows, and the background flashes, indicating a high-probability "Full Flow" state.
The Ribbon: Plots 5 distinct Fisher Transforms.
Blue Lines: Faster timeframes (leading indicators).
Orange Lines: Slower timeframes (trend confirmation).
Consensus Check:
FULL FLOW (Bull): When all 5 lines are > 0. The background flashes Green.
FULL FLOW (Bear): When all 5 lines are < 0. The background flashes Red.
MIXED (Chop): When the lines disagree. The background remains dark, warning you to stay out.
Dashboard: A heads-up display showing the exact Fisher value for every timeframe in the cluster.
Scalpers: Use the default settings (5m-9m). Enter only when the dashboard says "FULL FLOW" and the candles turn solid Green/Red.
Trend Traders: Change the inputs to higher timeframes (e.g., 15m, 30m, 45m, 1H, 4H) to catch major swing moves.

USD Liquidity / FX Swap + Money Market StressThis indicator shows, in a simple way, how tight or loose USD liquidity is. It combines two things: signs of stress in the FX market (Fed swap lines + dollar strength) and signs from the money market (the difference between repo rates like SOFR/TGCR and the Fed’s IORB rate). All of this is merged into a single blue line: when it rises, liquidity tends to be more abundant; when it falls, there is more stress and the dollar becomes “expensive” to obtain.
You read it like a traffic light:
If the background is red, the indicator is below the lower threshold → liquidity stress, an environment that is more prone to sell-offs and violent moves in risk assets (including crypto).
If the background is green, the indicator is above the upper threshold → more relaxed liquidity, a backdrop that is more favorable for risk rallies to be sustained.
No background color → neutral zone, neither very good nor very bad: you trade according to your usual system.
It is designed as a macro context filter, not as a buy/sell signal. In red, it makes sense to be more defensive with risk and leverage; in green, if your technical system gives a long signal, you have a somewhat more favorable tailwind. It should always be used together with other tools and strict risk management.

Lines Blue OrangeTry this without candles. Can be used with other indicators to help determine the direction.

Multi-MA Flow [longshorti]Multi-MA Flow
A versatile Moving Average indicator designed to visualize Trend Flow and identify key dynamic support/resistance levels. It features up to five customizable MAs and highlights the zone between the fast and slow MAs for a clear display of trend strength and direction.
🌟 Key Features
Dynamic Trend Flow (MA Flow Zone): The indicator colors the zone between the Fast MA (MA 2) and the Slow MA (MA 5). The fill visually represents trend direction and its Momentum (Divergence/Convergence) .
Trend Momentum Visualization: The fill color intensity and contrast signal trend strength. For example, Vibrant Fill indicates MA divergence, while Muted Fill signals convergence.
Flexible Moving Average System: Supports up to five (5) customizable MA lines (MA 1 through MA 5), each with independent period and visibility settings.
Supported MA Types: The indicator allows changing the type for all MAs to: EMA, SMA, WMA, or RMA .
Visual Notifications: Includes optional 'R' Retest Labels for finding potential entries on MA 2 and MA Value Labels showing current MA prices on the last bar.
Full Customizability: The entire color scheme, periods, and visibility of all elements are fully adjustable to suit any chart theme.
⚙️ Detailed Customization & Control
General Settings: Selects the Moving Average Type ( EMA, SMA, WMA, RMA ) for all MA lines.
MA Lines (5x): You can independently control Show/Hide , Period , Color , and Width for each of the five MA lines.
Flow Zone Fill:
The Enable MA2/MA5 Fill option allows you to toggle the flow zone visualization on or off.
You also define the Bullish/Bearish Fill Colors .
Labels & Retest: Control the visibility of MA Value Labels and the unique 'R' Retest Markers on MA 2.
Global Color: An option to override all line colors with a single selected Global Color .
💡 How to Use
Trend Direction: Observe the placement of MA 2 relative to MA 5.
Momentum: Watch the color and width of the fill. Widening lines with bright fill color indicates strong momentum.
Entry/Exit Points: Use the 'R' labels to locate potential retests of the fast MA in the direction of the dominant Flow Zone.

Quantum Ribbon Lite📊 WHAT IS IT?
Quantum Ribbon Lite is a trend trading indicator built on a 5-layer exponential moving average ribbon system. It analyzes price momentum, volume, and ribbon alignment to generate entry signals with pre-calculated stop loss and take profit levels.
The indicator is designed for traders who want a straightforward approach to trend trading without managing complex configurations.
🔧 HOW IT WORKS
The Ribbon System
The indicator uses 5 pairs of EMAs (10 moving averages total) that create colored "clouds" on your chart:
Blue/Teal ribbons indicate bullish alignment
Red/Pink ribbons indicate bearish alignment
Mixed colors indicate neutral or transitional periods
The ribbon spacing automatically adjusts from a fast EMA (21) to a slow EMA (60), creating layers that show trend strength and direction.
Signal Generation
Signals appear when multiple conditions align:
For LONG signals:
Fast EMAs are above slow EMAs
Price momentum is positive and strong (> 0.5 ATR)
Volume is above average (> 1.1x average)
Ribbon confirms bullish state
Minimum confidence threshold met (filters weak setups)
For SHORT signals:
Fast EMAs are below slow EMAs
Price momentum is negative and strong
Volume is above average
Ribbon confirms bearish state
Minimum confidence threshold met
📈 VISUAL COMPONENTS
Entry Signals
Green "BUY" label = Long entry signal at candle close
Red "SELL" label = Short entry signal at candle close
Signals only trigger on confirmed candle closes (no repainting).
Risk Management Lines
Three lines appear when you have an active position:
White dotted line = Entry price
Red dotted line = Stop loss level
Green dotted line = Take profit target
Performance Dashboard
The stats table shows:
Current position status (In Long/Short or Waiting for signal)
Entry, stop, and target prices when in a trade
Win/loss record
Win rate percentage with color coding
⚙️ SETTINGS
1. Signal Sensitivity (1-10)
Controls the minimum time between signals (cooldown period):
1 = 2 bars between signals (most frequent)
5 = 10 bars between signals (balanced)
10 = 20 bars between signals (most selective)
Lower values generate more signals, higher values filter for better setups.
2. Stop Loss Distance
Determines how stops are calculated using ATR (Average True Range):
Tight = 1.5x ATR from entry
Normal = 2.0x ATR from entry
Wide = 2.5x ATR from entry
ATR adapts to market volatility, so stops are tighter in calm markets and wider in volatile markets.
3. Take Profit Target
Sets your risk-to-reward ratio:
1.5R = Target is 1.5 times your risk
2R = Target is 2 times your risk
3R = Target is 3 times your risk
Example: With a $100 stop distance and 2R setting, your take profit will be $200 away from entry.
4. Show Stats Table
Toggle to show/hide the performance dashboard in the top-right corner.
5. Show Risk Lines
Toggle to show/hide the entry/stop/target lines on the chart.
📋 HOW TO USE
Step 1: Apply to Chart
Add the indicator to your preferred instrument and timeframe (daily recommended).
Step 2: Wait for Signal
A BUY or SELL label will appear on the chart when conditions align.
Step 3: Enter Position
Enter at the close of the signal candle in the indicated direction.
Step 4: Set Risk Parameters Use the displayed lines:
Red line = Your stop loss
Green line = Your take profit
Step 5: Hold Position
Wait for the position to hit either the stop or target. No new signals will appear while you're in a position.
Step 6: Review Results
Check the stats table to track your win rate and adjust settings if needed.
🎯 RISK MANAGEMENT
Stop Loss Calculation
Stops are based on ATR (Average True Range) which measures recent price volatility:
In quiet markets: Stops are placed closer to entry
In volatile markets: Stops are placed further away
This adaptive approach helps prevent stop-hunting while maintaining appropriate risk levels.
Take Profit Calculation
Targets are calculated as a multiple of your stop distance:
If stop is 50 points away and you use 2R, target is 100 points away
Maintains consistent risk-reward ratios across all trades
Required Win Rates To break even after fees:
1.5R requires ~40% win rate
2R requires ~34% win rate
3R requires ~25% win rate
📊 RECOMMENDED USAGE
Timeframes:
Daily charts show strongest performance in testing
4H and 1H timeframes work but may have lower win rates
Lower timeframes generate more signals but reduced quality
Markets:
Works on all instruments: Stocks, Forex, Crypto, Futures, Indices
Best suited for trending markets
May generate false signals in tight ranges or choppy conditions

Relative Measured Extension (RME)The Relative Measured Extension (RME) indicator is a powerful oscillator that helps traders identify extreme price extensions from a moving average by normalizing historical data on a scale of -100 to +100.
This indicator is inspired by the Deepvue RME indicator and brings its powerful methodology to TradingView with full customization options and additional features.
What Makes RME Unique?
Unlike traditional oscillators, RME dynamically calculates how extended the current price is compared to ALL previous extensions over your chosen lookback period. A reading of +100 means the stock is as far above the moving average as it has EVER been in the lookback window, while -100 indicates the maximum historical extension below the MA.
Key Features
✅ Adaptive Scaling - Automatically normalizes to historical extremes
✅ Multiple MA Types - Choose between SMA, EMA, WMA, or VWMA
✅ Visual Zones - Color-coded overbought (70-100) and oversold (-70 to -100) regions
✅ Info Dashboard - Real-time display of RME value, extension %, MA value, and status
✅ Built-in Alerts - Get notified when entering overbought/oversold zones or crossing zero
✅ Fully Customizable - Adjust all parameters to match your trading style
Recommended Settings
Position Traders:
Lookback Period: 250
MA Length: 50
Use for spotting significant trend changes and correction bottoms
Swing Traders (Option 1):
Lookback Period: 100
MA Length: 20
Faster signals for medium-term swings
Swing Traders (Option 2):
Lookback Period: 50
MA Length: 10
Most responsive for quick trades on strong momentum stocks
How to Interpret
+70 to +100 (Red Zone) - Overbought, potential pullback area
-70 to -100 (Green Zone) - Oversold, potential reversal area
Zero Line Cross - Momentum shift signal
RME at 0 in uptrends - Excellent entry points during pullbacks
Trading Application
Early in Trends: High RME readings can signal strength, though a consolidation may be needed
Late in Trends: Extreme readings may indicate exhaustion
During Corrections: Use on index ETFs (QQQ, SPY) to identify potential bottoms
Pro Tips
Compare current extremes to historical extremes in context
Strong stocks may hold near overbought zones longer
Pullbacks to zero in strong uptrends often provide low-risk entries
Works on all timeframes and instruments (stocks, crypto, forex, commodities)
Credit: Inspired by the Deepvue Relative Measured Extension indicator

Supertrend Cloud ProSupertrend Cloud Pro is a next-generation trend + breakout system designed for traders who want clean structure, early breakout confirmation, and disciplined exits.
The strategy combines Fast + Slow Supertrend layers, a dynamic cloud compression model , and a breakout-based entry engine to deliver clarity in trending as well as contracting markets.
How It Works
1. Dual Supertrend Structure (Fast + Slow)
Fast ST reacts quickly to volatility
Slow ST establishes dominant trend bias
Combined color logic instantly reveals market direction
Green Cloud → Bullish Trend
Red Cloud → Bearish Trend
Yellow Cloud → Compression / Squeeze Zone
2. Cloud Compression Logic
The zone between Fast/Slow Supertrend creates a structure-based “cloud.”
When price enters this zone, markets are typically preparing for expansion.
Yellow shading highlights these high-probability breakout zones.
3. Breakout Entry Engine
Long Entry : Price closes above the cloud top
Short Entry: Price closes below the cloud bottom
This avoids premature entries and filters out false noise.
4. Smart Exit Logic
Positions exit automatically when Fast or Slow Supertrend flips direction, ensuring disciplined exit and minimizing emotional decisions.

Jon Secret SauceJon Secret Sauce — Advanced Trend + Momentum Entry Signals
A premium trade-timing engine that combines MA trend confirmation, volatility filters, RSI momentum, and smart volume validation to identify high-probability long & short entries on your preferred timeframe.
Includes auto-managed exits (TP / SL / technical breakdown), professional visuals, and alert notifications so you catch the move and protect profits — without overcrowding your chart.

Dix$ons Tackle BoxDixsons Tackle Box — Multi-Tool Trend & Levels Suite (MA/EMA + VWAP + BB + Adaptive Trend Channels + Auto Fibs)
---
**Dixsons Tackle Box** is an all-in-one overlay for traders who want a clean chart with *stacked edge* instead of stacked indicators.
It combines:
* A **5-slot MA/EMA pack** with live slope % labels and MTF smoothing
* A **full VWAP engine** with event-based anchors, trend angle coloring, and VWAP bands
* **Bollinger Bands** with volatility-aware coloring and optional gradient background
* A **Short-Term & Long-Term Adaptive Trend Channel (ATC)** with automatic period detection, log-regression channels, and performance tables
* A **Dixson Auto Fibonacci suite**: ATR-based “rail” Fibs + Lookback Fibs off HH/LL, both driving a shared, fully customizable Fib bank
Everything is controlled logically by feature groups under the **“Tackle Box”** section, so you can quickly turn modules on/off and tune the tool to your style (scalp, intraday, swing, or position).
> **Important:** This is an analysis/visualization tool only. Nothing here is financial advice or an automatic trading system. Always test and manage risk yourself.
---
## 1. MA/EMA Pack — 5 Smart Averages with Slope %
**Group:** `Tackle Box` + per-slot groups `MA/EMA 1` … `MA/EMA 5`
**Main toggle:** `Enable MA's`
**Per-slot master row:** `_maRow1` … `_maRow5`
### What it does
This module gives you **five independent MA/EMA slots**, each with:
* Its own **type** (MA or EMA)
* **Length**, **color**, **line width**, and **plot style** (`Solid`, `Step`, or `Circles`)
* **Timeframe per slot** (MTF)
* Rich **label controls** (slope %, length/type text, timeframe text, etc.)
* **Label size** per slot (`tiny → huge`)
On top of that, each average has a **live slope % readout**, normalized by instrument tick size, so you can compare trend steepness across assets.
### Key features
* **Master slot row (1–5):**
In the `Tackle Box` group you have `_maRow1`–`_maRow5` toggles. These gate each slot globally, so you can quickly show/hide specific MAs without digging into each slot.
* **MTF Smoothed Mode:**
* `MTF Smoothed Mode` (on by default) makes higher-timeframe MAs **update only when the HTF bar closes (and on the last bar)**.
* That reduces the stair-stepping noise you often get when pulling HTF data onto an LTF chart, while still giving you accurate levels and a smooth, tradeable line.
* **Per-slot label text controls:**
Each MA group has toggles to control exactly what the label shows:
* `Show Label` – show/hide label entirely
* `Slope` – append slope % to the label
* `Len+Type` – show e.g. `50EMA` or `200MA`
* `TF` – show HTF name if the slot is on an MTF
* `'slope' text` – optionally include the word `slope` in the label
* **Slope % (angle) logic:**
Slope for each MA uses a normalized **“angle %” in **, based on the 1-bar change vs `syminfo.mintick`.
* Big positive values = strong uptrend
* Big negative values = strong downtrend
* Near zero = flat/neutral
This makes it easy to build rules like:
* “Only trade long if the **50EMA slope** is above +20% and price is above VWAP”
* “Take profit if slope on my faster MA collapses back toward 0.”
### Typical use
* Slot 1–2: **fast intraday EMAs** (e.g., 9 / 20 EMA)
* Slot 3–4: **structural EMAs/MAs** (e.g., 50 / 200)
* Slot 5: a **dedicated MTF trend filter** (e.g., 5-minute or 1-hour EMA on a 1-minute chart)
---
## 2. VWAP Engine + Bands — Anchor-Aware, Angle-Aware VWAP
**Group:** `Enable VWAP` + `------ VWAP Settings ------`, `Bands Settings`, `Color Settings`
### Core VWAP
* **Anchors:**
`Anchor Period` lets you choose where each VWAP reset starts:
* `Session` (day session VWAP, perfect for intraday)
* `Week`, `Month`, `Quarter`, `Year`, `Decade`, `Century`
* Corporate events: `Earnings`, `Dividends`, `Splits`
This lets you build VWAP logic around:
* **Intraday mean reversion** (Session VWAP + bands)
* **Swing anchor VWAPs** (Weekly/Monthly)
* **Event-based anchors** (earnings/dividend/split reaction)
* **Hide on DWM:**
`Hide VWAP on 1D or Above` lets you keep intraday VWAP from cluttering higher-TF charts.
* **Angle/Trend Detection:**
The VWAP engine computes a **regression slope** over each anchor segment and converts it to an **angle %**:
* `Angle Lookback (bars)` controls how many bars are used
* `Angle Trend Threshold (%)` sets the threshold where a slope is considered “trending”
With `Color VWAP by Trend` enabled:
* Uptrend > threshold → VWAP turns **trend up color** (e.g., lime)
* Downtrend < −threshold → VWAP turns **trend down color** (e.g., red)
* Inside threshold → VWAP uses a neutral color
You can also set separate **line widths** for neutral vs trend state and transparency to give a “Hull-style” visual feel.
* **VWAP Labels:**
You get a single, de-duplicated VWAP label on the last bar with:
* Optional **name** (`VWAP`)
* Optional **price** (`$xxx.xx`)
* Optional **angle %** and optional `"slope"` word
* Global **label size** for VWAP + bands
### VWAP Bands
* **Calc modes:**
`Bands Calculation Mode`:
* `Standard Deviation` – classic VWAP ± n * σ
* `Percentage` – bands as a fixed % of VWAP
* **Bands 1-3:**
Each band has:
* Visibility toggle, independent multiplier (`×`)
* Separate **upper/lower colors** per band
* Optional **fill** between upper/lower for each band
* Label toggles:
* `Show All Labels`
* `Show Band #X Label`
* `Band Labels: Show Names` (VWAP+1, VWAP-1, etc.)
* `Band Labels: Show Prices`
This lets you configure anything from a minimalist “just VWAP + 1 band” view to a full 3-band ladder.
### VWAP Highlight Fill
* **Premium/discount shading**:
Optional fill that shades:
* Region **above VWAP** when price is above (e.g., greenish)
* Region **below VWAP** when price is below (e.g., reddish)
This makes it extremely easy to see when price is trading at **premium vs discount** relative to the current anchor VWAP.
### Typical use
* Intraday scalpers: Session VWAP + 1–2 bands + highlight fill
* Swing traders: Weekly/Monthly VWAP + only the main line and label
* Event traders: Earnings-anchored VWAP, tracking post-earnings drift
---
## 3. Bollinger Bands — Volatility-Aware BB with Gradient Fill
**Group:** `Enable Bollinger Bands` + `------ Bollinger Band settings ------`
### What it adds
A clean Bollinger Band overlay designed to play nicely with the VWAP/MA stack:
* `Bollinger Bands Length` (default 20)
* `Bollinger Bands Multiplier` (default 2.0)
* `BB Basis Color` & **line width**
* Upper/lower bands colored based on **width change**:
* Expanding volatility → `BB Expanding Color`
* Contracting volatility → `BB Contracting Color`
You can also toggle:
* `Show Center Line MA Label` – prints something like `20ma` on the last bar.
* `Enable Gradient Background Fill` – draws a gradient between price and the bands:
* `Gradient Fill Up Color` for below-price fill
* `Gradient Fill Down Color` for above-price fill
### Why it’s unique here
Instead of just static bands, this implementation **flags volatility regimes** (expansion vs contraction) via color and optional gradient. That pairs nicely with ATR Fibs and VWAP:
* Use **BB contraction (squeeze)** + flat VWAP angle to anticipate breakouts.
* Use BB + VWAP bands to filter which “touches” are genuinely overextended.
---
## 4. Dixson Adaptive Trend Channel (ATC) — Short-Term & Long-Term Log Channels
**Master toggle:** `Enable Adaptive Trend Channel`
**Groups:** `------ Dixson ATC Settings ------`, `Short-Term Channel Settings`, `Long-Term Channel Settings`, `Short-Term Midline Settings`, `Long-Term Midline Settings`, `Channel Trend Background Fill Settings`, `Short-Term Table Settings`, `Long-Term Table Settings`
### Under the hood
ATC is a **log-scale regression channel engine** that automatically:
1. Scans a set of candidate periods.
* **Short-term:** 20 → 200 bars
* **Long-term:** 300 → 1200 bars
2. For each period, it computes:
* Log-price regression slope & intercept
* Standard deviation of residuals
* A Pearson-style R value (trend “strength”)
3. Picks the period with the **highest correlation (|R|)** and uses that as the **detected trend length**.
This yields a **data-driven channel** that adapts to whatever trend the market is actually respecting.
> For long-term stats, annualized return only makes sense on **daily/weekly** charts. On intraday charts, treat the “Annual Return” purely as informational.
### Short-Term Channel
Controls in `Short-Term Channel Settings` + `Short-Term Midline Settings`:
* `Show Short-Term Channel` – on/off
* `Deviation Multiplier (Short-Term)` – how wide the channel is (in standard deviations)
* **Upper/Lower colors**, line width, style (Solid/Dotted/Dashed), transparency
* `Line Extension Style` – Extend Right / Extend Both / Extend None / Extend Left
Optional **Short-Term Midline**:
* Toggle + color, style, width, transparency
* Tracks the regression line itself (center of the channel)
Background fill:
* `Enable ST Background Fill` with separate **ST Uptrend** / **ST Downtrend** colors
* Trend direction is inferred from regression slope sign
### Long-Term Channel
Mirrors the ST controls with its own group:
* `Show Long-Term Channel`
* `Deviation Multiplier (Long-Term)`
* Upper/Lower channel colors, thickness, style, transparency
* `Line Extension Style`
* Optional Long-Term midline + colors/styles
* Optional **background fill** with separate colors for up vs down
You can run **both channels at once**, giving a panel of:
* **Macro trend structure** (Long-Term ATC)
* **Current swing trend** (Short-Term ATC)
* MAs, VWAP, and Auto Fibs on top for entries/exits
### Trend Info Tables
Each channel has its own table options:
* `Show Detected Period` (bars used)
* `Show Trend Strength` – either:
* Descriptive text: “Extremely Weak” → “Ultra Strong”, or
* Raw Pearson R value if `Show Pearson R` is enabled
* `Show Annualized Return` (when timeframe is daily/weekly)
* Table position (`Top Left`, `Bottom Right`, etc.)
* Text size (`Small`, `Normal`, `Large`)
These tables quantify:
* Over what lookback the trend is being measured
* How “clean” that trend is
* What the approximate annualized performance of that trend has been
---
## 5. Dixson Auto Fibonacci Suite — ATR Fibs + Lookback Fibs + Shared Fib Bank
**Master toggle:** `Enable Auto Fibonacci`
**Groups:** `Dixson Auto Fibonacci`, `ATR Auto Fib`, `Previous ATR Fib`, `Lookback Auto Fib`, `Lookback Anchor Overrides`, `Fibonacci Levels`
You get **two separate engines** (ATR-based and Lookback-based) that both draw from the **same customizable Fib bank**, with optional log scaling.
---
### 5.1 Global Auto Fib Settings
* `Logarithmic Scale`
* When ON, Fib levels are interpolated in log-space (better for assets that move in percentages).
* When OFF, interpolation is linear in price.
This applies to **both** the ATR and Lookback engines.
---
### 5.2 ATR Auto Fib (Rail-Based, Supertrend-Driven)
**Groups:** `ATR Auto Fib`, `Previous ATR Fib`
The ATR engine builds **“rails”** that hug price without letting candles touch them, then projects Fib levels between these anchors.
#### How it works
1. Uses built-in `ta.supertrend` with:
* `ATR Period`
* `ATR Multiplier`
2. Builds dynamic **upper and lower rails** around price:
* Uses ATR to define a **proximity gap** (`Proximity (×ATR)`) so rails stay **just outside the wicks** (no-touch behavior).
* Smooths raw highs/lows slightly (RMA) to avoid spiky rails.
* Ensures the upper rail is always ≥ high+gap and lower rail ≤ low−gap.
3. The **direction** (uptrend/downtrend) is inferred from the Supertrend direction:
* On trend flips, the script:
* Captures the prior rail pair as a **“previous segment”**
* Starts a new rail segment in the new direction
4. From these rails, the script draws **directional Fib “ladders”**:
* For the **current ATR Fib**:
* The Fib is drawn from one anchor to the other depending on the trend sign.
* Rays are projected `Ray Length` bars to the right of `Current Offset`.
* For the **previous ATR Fib**:
* The last completed segment’s start/end rails are used as anchors
* Rays are projected using `Prev Fib Offset` and `Prev Fib Length`
#### Current ATR Fib controls
* `Enable ATR Fib` – toggles current ATR Fib bank
* `ATR Period`, `ATR Multiplier` – control the “engine” behind the rails and ST logic
* `Current Offset`, `Ray Length` – where and how far rays are drawn
* `Show Level Text`, `Show Price`, `Display % not ratio` – label style
* `Label Size (Current ATR Fib)` – for all current ATR Fib labels
Visual extras:
* `Plot Hi/Low Anchor Lines` – shows upper/lower rails
* `Plot ATR Trailing Stop` – shows clamped Supertrend as a continuous line
#### Previous ATR Fib controls
* `Enable Prev ATR Fib` – toggles previous segment ladders
* Independent `Prev Fib Offset`, `Prev Fib Length`
* Separate label controls:
* `Show Level Text (Prev)`
* `Show Price (Prev)`
* `Display % not ratio (Prev)`
* `Label Size (Previous ATR Fib)`
Use the **current ATR Fib** as your active trading “ladder” and the **previous ATR Fib** to track recently broken structure and potential retest zones.
---
### 5.3 Lookback Auto Fib — HH/LL-Driven Fib Bank, MTF + Manual Overrides
**Group:** `Lookback Auto Fib` + `Lookback Anchor Overrides`
This engine draws Fibs between **highest high** and **lowest low** within a given lookback window on a chosen timeframe.
#### How it works
1. Select higher timeframe:
* `Lookback Timeframe` (empty = chart timeframe)
2. Choose your range:
* `Lookback Bars` – number of bars on the selected TF to scan for extremes
3. Optionally allow look-ahead:
* `Look-ahead Bars (repainting)`
* `0` = no look-ahead (no forward info, no repainting)
* `>0` = uses `barmerge.lookahead_on` for forward-looking extremes (can repaint)
4. For that range, the script finds:
* Highest high + its bar offset
* Lowest low + its bar offset
5. Trend direction is determined by **which extreme is more recent**:
* Recent high → **down** direction (high → low)
* Recent low → **up** direction (low → high)
6. Manual direction overrides:
* `Force Uptrend` / `Force Downtrend` – override the auto decision
7. Manual anchor overrides:
* `Manual Anchor High (LB)`
* `Manual Anchor Low (LB)`
If both are set, those become the anchors and direction is deduced from which is higher.
8. The engine then draws a **directional Fib ladder**:
* Anchors between high/low based on direction
* Rays extend `Lookback Fib Length` bars from `Lookback Fib Offset`
#### Label controls
* `Show Level Text`, `Show Price`, `Display % not ratio`
* `Label Size (Lookback Fib)`
* Labels are prefixed with `LB` to distinguish them from ATR Fibs.
This engine is ideal for:
* **Swing structure mapping:** Drawing Fibs across the last major swing on the HTF.
* **Confluence:** Aligning Lookback Fibs with ATR Fibs, ATC channel boundaries, and VWAP bands.
---
### 5.4 Shared Fibonacci Levels — Fully Custom Fib Bank for Both Engines
**Group:** `Fibonacci Levels`
The ATR and Lookback engines **both** use the same Fib bank:
* **Ratios provided by default:**
* 0.000
* 0.146
* 0.236
* 0.382
* 0.500
* 0.618
* 0.650
* 0.707
* 0.786
* 0.886
* 1.000
* 1.130
* 1.272
* 1.618
* 2.000
Each ratio has its own:
* `Enable Level X.XXX`
* `Level X.XXX` (the actual ratio – fully editable)
* `Thickness X.XXX` (line width)
* `Style X.XXX` (Solid / Dashed / Dotted)
* `Color X.XXX` (line + label color)
Adjusting a level here **instantly updates both** ATR and Lookback ladders. This makes it very easy to:
* Run “standard” Fib sets for classic retracements
* Or define your **own Fib presets** (e.g., 0.25 / 0.5 / 0.75, or custom extension clusters)
---
## How to Use & Suggested Workflows
**Scalpers / 0DTE / Intraday:**
* Enable:
* MA/EMA pack (fast EMAs + one MTF slot)
* VWAP (Session anchor) + 1–2 VWAP bands + highlight fill
* ATR Auto Fib (current + previous)
* Optionally hide:
* Lookback Fibs
* Long-Term ATC (unless you want HTF bias on your intraday chart)
Use slope labels, VWAP angle %, and ATR Fib ladders to structure trades around pullbacks, mean reversion, and breakouts.
**Swing / Position traders:**
* Turn on:
* Long-Term ATC (with table)
* Short-Term ATC for swing structure
* Lookback Auto Fib on a higher timeframe (e.g., D on 4H chart)
* Keep VWAP anchored to Week or Month, and MA slots for key reference MAs.
Use ATC channels for **trend structure**, Lookback Fibs for **swing levels**, and long VWAPs for **value zones**.
---
## Final Notes & Disclaimer
* Works on **all symbols** and **all timeframes**, but some stats (like “Annualized Return”) are only meaningful on **daily/weekly** data.
* Some options (like Look-ahead mode for Lookback Fibs) can **repaint** on purpose. These are clearly labeled — use them only if you understand and want forward-looking behavior.
* This script does **not** place trades. It is a visual / analytical tool only.
* Nothing in this indicator or description is financial advice. Always do your own research, forward-test, and manage risk appropriately.
If you have **invite-only access** to **Dixsons Tackle Box**, you’re getting the full Dixson overlay stack in one place — designed to be the central “hub” for your chart, not just another line on it.

Yesterday Low LineTraces a red dotted line on the low of yesterdays session for the present graph - and extends into the future

Helix Protocol 7HELIX PROTOCOL 7
Overview
Helix Protocol 7 is an advanced trend-adaptive signal engine that dynamically adjusts its buy/sell thresholds based on real-time market regime detection. Unlike static indicators that use fixed overbought/oversold levels, Helix 7 recognizes that optimal entry and exit points shift dramatically depending on whether the market is trending strongly, ranging, or reversing.
The indicator fuses multiple analytical frameworks—momentum oscillators, trend strength metrics, volatility analysis, volume confirmation, and price structure—into a unified signal system that adapts to changing market conditions in real-time.
Core Philosophy
"Don't fight the trend—adapt to it."
In a strong uptrend, you want to buy dips early (before extreme oversold) and let winners run longer
In a downtrend, you want to sell bounces quickly and only buy true capitulation
In a neutral/ranging market, standard overbought/oversold levels apply
Helix Protocol 7 automatically detects which regime you're in and applies the appropriate thresholds.
Key Features
🔄 Trend-Adaptive Signal Thresholds
The indicator classifies markets into four states and adjusts Fisher Transform and RSI thresholds accordingly:
Trend StateDetection CriteriaBUY TriggersSELL TriggersSTRONG UPTRENDADX rising, ADX > 25, +DI > -DIFisher < 1.0, RSI < 50Fisher > 2.5, RSI > 70STRONG DOWNTRENDADX rising, ADX > 25, -DI > +DIFisher < -2.5, RSI < 25Fisher > 1.5, RSI > 60WEAK DOWNTRENDADX falling, -DI > +DIFisher < -2.5, RSI < 25Fisher > 1.5, RSI > 60NEUTRALDefault fallbackFisher < -2.0, RSI < 30Fisher > 2.0, RSI > 65
📊 Dynamic Envelope Bands
Adaptive bands that expand and contract based on:
ATR (Average True Range) - Base volatility measure
ADX (Trend Strength) - Bands widen in strong trends
Chaikin Oscillator - Volume-weighted band adjustment
🎯 Multi-Trigger Signal System
Signals can fire from multiple sources:
Trend-Based Signals - Fisher + RSI thresholds met for current regime
Band Touch Signals - Price touches upper/lower band (support/resistance)
EXTREME Signals - Price penetrates band by significant amount (bypasses cooldown)
⚡ Extreme Move Detection
When price makes an explosive move that penetrates the band by more than 30% of ATR (configurable), the signal fires with EXTREME priority and bypasses the normal cooldown period. This ensures you never miss major reversal opportunities.
📈 GXS Scoring System
A proprietary multi-factor scoring system (-1.0 to +1.0) that weighs:
Trend Strength (30%) - ADX direction and magnitude
Momentum (25%) - RSI, MACD, Stochastic, CCI, ROC consensus
Volume (20%) - OBV trend and volume surge detection
Price Structure (15%) - Band position and volatility percentile
Price Action (10%) - Bullish/bearish candle ratio
🔀 RSI Divergence Detection
Automatically detects and displays:
Regular Bullish Divergence - Price lower low + RSI higher low (reversal up)
Regular Bearish Divergence - Price higher high + RSI lower high (reversal down)
Hidden Bullish Divergence - Trend continuation signal (uptrend)
Hidden Bearish Divergence - Trend continuation signal (downtrend)
📉 BBWP Volatility Meter
Bollinger Band Width Percentile measures current volatility relative to historical norms:
LOW (< 30%) - Volatility compression, breakout imminent
MEDIUM (30-70%) - Normal market conditions
HIGH (> 70%) - Extended volatility, potential exhaustion
Visual Components
Money Line
A dynamic centerline (Linear Regression or Weighted EMA) colored by slope:
🟢 Green - Rising (bullish momentum)
🔴 Red - Falling (bearish momentum)
🟡 Yellow - Flat (consolidation)
Envelope Cloud
Shaded region between upper and lower bands, colored by Money Line slope direction for instant trend visualization.
Signal Labels
Clear entry/exit labels showing:
Price level
Trigger type (UPTREND DIP, CAPITULATION, BAND TOUCH, EXTREME, etc.)
Color coding (Green=Buy, Red=Sell, Lime=Extreme Buy, Fuchsia=Extreme Sell)
ADX Trend Bar
Bottom indicator showing trend state:
🟢 Lime - Strong Uptrend
🔴 Red - Downtrend
🟠 Orange - Weak/Transitional (ADX 15-24)
⚪ White - Ranging (ADX < 15)
🔵 Blue - Strong trend, neutral direction
Info Panel
Real-time dashboard displaying:
Current trend state
GXS Score
Active divergences
Volatility level (BBWP)
ADX value and direction
DI Spread
Fisher Transform value
RSI value
Context-sensitive BUY/SELL thresholds for current regime
Alert System
JSON Webhook Alerts (Bot-Ready)
json{
"action": "BUY",
"symbol": "BTC/USDT",
"price": "93500.00",
"trigger": "EXTREME",
"rsi": "28.5",
"fisher": "-2.31",
"adx": "32.4",
"trend_state": "STRONG DOWN"
}
Available Alert Conditions
Buy Signal / Sell Signal
Lower Band Touch / Upper Band Touch
EXTREME Lower Band / EXTREME Upper Band
Strong Uptrend Started
Downtrend Started
Neutral Trend Started
Trend State Change
Recommended Settings
Scalping (1m-5m)
Signal Cooldown: 3-5 bars
Extreme Penetration: 0.2 (more sensitive)
ADX Length: 10-12
Swing Trading (15m-4H)
Signal Cooldown: 5-8 bars
Extreme Penetration: 0.3 (default)
ADX Length: 14 (default)
Position Trading (Daily+)
Signal Cooldown: 8-12 bars
Extreme Penetration: 0.4-0.5 (less sensitive)
ADX Length: 14-20
Input Parameters
Core Settings
Money Line Type (Linear Regression / Weighted EMA)
Money Line Length
RSI Period
Fisher Period
Dynamic Bands
ATR Period & Multiplier
Adaptive Bands toggle
Chaikin Weight
Extreme Band Penetration threshold
Trend Detection
ADX Length & Slope Lookback
Strong Trend ADX Threshold
DI Spread for Neutral detection
Signal Thresholds (by Trend State)
Fully customizable Fisher/RSI/ADX levels for each regime
Separate BUY and SELL parameters
Display Options
Toggle bands, cloud, labels, panels
Cooldown period
Debug panel for troubleshooting
Best Practices
Confirm with price action - Signals are high-probability setups, not guarantees
Respect the trend state - The panel shows current thresholds for a reason
Watch for EXTREME signals - These indicate significant reversals
Use divergences as confluence - Especially powerful at band touches
Monitor volatility - Low BBWP often precedes big moves
Version: 7.0
Author: ralis24
