Liquidity Sweep & Reversal — Body Anchored + Risk (v6)Overview
The Liquidity Sweep & Reversal — Locked to Price (v6) indicator identifies liquidity sweeps around major swing highs and lows, confirming reversals when price closes back inside the swept level.
All signals are locked to price (bottom of green candle for BUY, top of red candle for SELL), so they remain perfectly aligned when zooming or scaling.
This indicator is ideal for swing traders and scalpers who trade reversals, liquidity events, and reclaim structures.
How It Works
Detects confirmed swing highs and lows using a pivot-based structure.
Waits for a liquidity sweep — when price wicks beyond a recent swing.
Confirms a reclaim when price closes back inside the previous swing level.
Triggers a BUY or SELL signal anchored to the candle body.
Automatically calculates stop loss and risk using ATR and your inputs.
Input Settings
Swing Detection
Swing Detection Strength: How many bars confirm a swing pivot. Higher = stronger swings.
Bars to Confirm Reclaim: Number of bars after a sweep for price to close back within the swing zone.
Swing Proximity %: How close price must come to a swing to count as a liquidity sweep.
Trend Filter (optional)
Use EMA Trend Filter: When enabled, only BUY in uptrend and SELL in downtrend.
Fast EMA Length / Slow EMA Length: Define EMAs used to detect trend direction.
Risk & Stop Management
ATR Length: Period for ATR calculation (volatility measurement).
Base ATR Stop Buffer (x ATR): Distance of stop loss from entry based on ATR multiplier.
Position Size (quote units): Your total position size in quote currency (e.g., USDT).
Risk % of (Position / 20): Defines how much of your position to risk per trade.
Example: (Position / 20) × Risk % = per-trade risk.
Chart Elements
BUY Arrow (green): Appears after a liquidity sweep and reclaim near a swing low.
SELL Arrow (red): Appears after a sweep and reclaim near a swing high.
Labels: Display entry price, stop loss (SL), and calculated risk dollar value.
EMAs: Optional fast/slow moving averages for directional bias.
Dynamic Stops: Adjust automatically using ATR × risk settings.
Trading Tips
Use BUY signals near liquidity sweeps under swing lows.
Use SELL signals near liquidity sweeps above swing highs.
Adjust swing length for different timeframes:
Lower values for scalping (3–5)
Higher values for swing trading (7–10)
Respect stop loss levels and use risk control settings for consistent sizing.
Combine with volume, OBV, or structure for confirmation.
Alerts
BUY — Locked to Price: "BUY: swing low reclaimed with dynamic stop."
SELL — Locked to Price: "SELL: swing high reclaimed with dynamic stop."
Best Use Cases
Liquidity-based reversals
Swing entry confirmation
Stop hunt reclaims
Structure-based entries
Author
Created by @roccodallas
For traders who value clean structure, risk control, and chart precision.
Bandas y canales

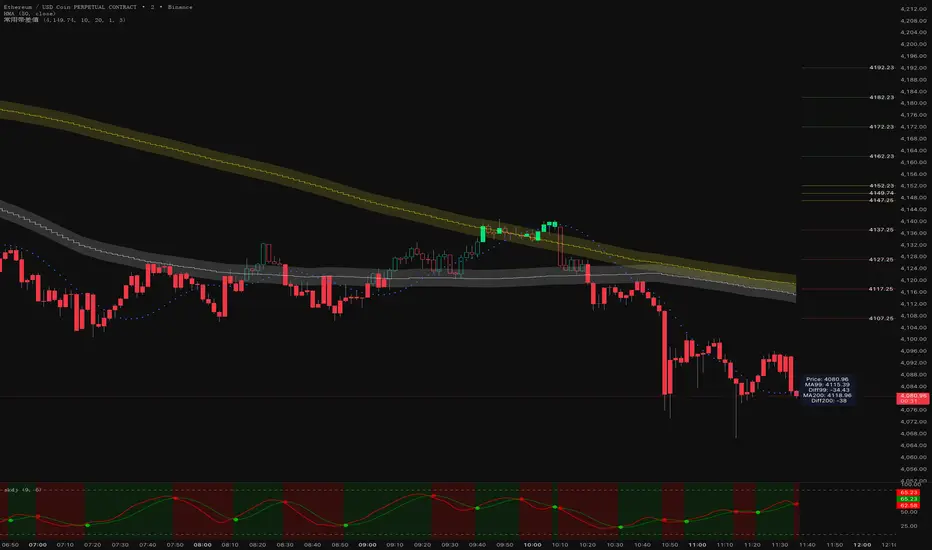
CHN-M-HA secure buy/sell indicator for futures and spot trading. A green cloud indicates a trend. A magic line is available as support or a stop level. Buy and sell signals. Voluminous candlesticks are indicated.

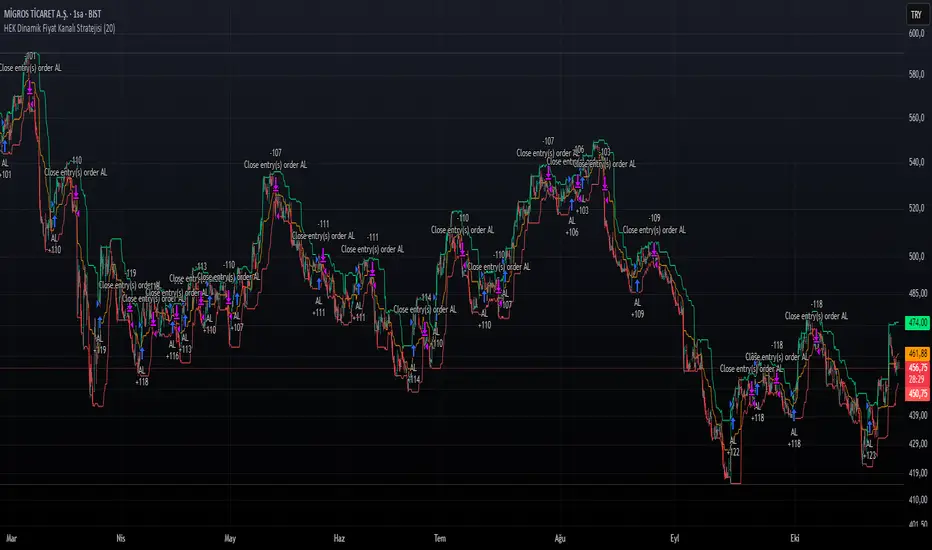
HEK Dynamic Price Channel StrategyHEK Dynamic Price Channel Strategy
Concept
The HEK Dynamic Price Channel provides a channel structure that expands and contracts according to price momentum and time-based equilibrium.
Unlike fixed-band systems, it evaluates the interaction between price and its balance line through an adaptive channel width that dynamically adjusts to changing market conditions.
How It Works
When the price reacts to the midline, the channel bands automatically reposition themselves.
Touching the upper band indicates a strengthening trend, while touching the lower band signals weakening momentum.
This adaptive mechanism helps filter out false signals during sudden directional changes, enhancing overall signal quality.
Advantages
✅ Maintains trend continuity while avoiding overtrading.
✅ Automatically adapts to changing volatility conditions.
✅ Detects early signals of short- and mid-term trend reversals.
Applications
Directional confirmation in spot and futures markets.
A supporting tool in channel breakout strategies.
Identifying price consolidation and equilibrium zones.
Note
This strategy is intended for educational and research purposes only.
It should not be considered financial advice. Always consult a professional financial advisor before making investment decisions.
© HEK — Adaptive Channel Approach on Dynamic Market Structures
MA99+MA200+MA400HMA+SLMA+HMA+SL,you can type your enter price,00000011111112222223333333444444455555666666
【SY】AI量化指标Strategy Description
This strategy is designed to capture market momentum through structured price behavior and dynamic risk management. It seeks to identify moments when the market transitions between accumulation and expansion phases, entering positions that align with the prevailing directional bias.
The approach prioritizes disciplined execution, precise trade timing, and consistent risk-to-reward balance. Position management follows a clear set of predefined conditions to reduce emotional interference and enhance long-term performance stability.
Emphasis is placed on adaptability rather than prediction — the strategy reacts to changing market structure, allowing profits to grow while protecting capital through controlled exit conditions. It performs best in trending or transitional environments where volatility supports directional continuation.

Multi Time Frame EMAsThree EMAs with the option to hide them on higher timeframes. Simple and easy to use.

Proactive Breakout Predictor - SAINTThe Proactive Breakout Predictor+ is an advanced intraday trading indicator designed to detect and confirm breakout opportunities with high accuracy — before they fully develop, and to identify ideal retest entries after the initial breakout.
It combines multiple layers of market structure, momentum, trend, and volume analysis to eliminate false breakouts and help traders enter with confidence.
Signal Type | Chart Marker | Meaning Bullish Breakout | 🟢 Up Triangle | Confirmed bullish breakout — strong upward
momentum with volume and trend confirmation.
Bearish Breakout | 🔴 Down Triangle | Confirmed bearish breakout — strong downward
momentum with volume and trend confirmation.
Bullish Retest | 🟢 Small Green Circle | Price retests breakout zone with low volume —
ideal re-entry or add-on for longs.
Bearish Retest | 🔴 Small Red Circle | Price retests breakdown zone with low volume —
ideal re-entry or add-on for shorts.

Z-Score du Graphique ActuelIndicator: Z-Score for Active Chart (Custom Spreads)
Description
This simple yet powerful indicator calculates and displays the Z-Score for the active chart.
It is specifically designed for traders who manually create and chart spreads (e.g., "MNQ1!-1.17*MES1!" or "AAPL-MSFT") directly in the TradingView symbol bar. Instead of requiring you to input multiple symbols into the indicator's settings, this script simply reads the closing price of whatever chart it is applied to.
This makes it a fast and efficient tool for analyzing the mean-reversion properties of any custom-built spread.
Key Features
• Simplicity: Works directly on the chart's current price (close). No complex inputs are needed.
• Ideal for Spreads: Perfect for pairs trading or analyzing custom spreads (futures, stocks, crypto, etc.) that you type into the main symbol input.
• Customizable Length: Set the lookback period (z_length) for the Z-Score calculation (which determines the simple moving average and standard deviation).
• Visual Trading Zones: The script plots customizable dashed lines for your entry thresholds (long and short) and dotted lines for your exit thresholds.
• Background Highlighting: The background changes color (red for short zone, green for long zone) when the Z-Score moves beyond your specified entry thresholds, providing a clear visual signal for potential over-extension.
How to Use
1. Create Your Spread: Go to the TradingView symbol bar at the top of your screen.
2. Type Your Formula: Type in your custom spread formula (e.g., MNQ1!-1.17*MES1!, AAPL-MSFT, or BTCUSD-ETHUSD). Press Enter.
3. Apply the Indicator: Add this "Z-Score (Chart)" indicator to the resulting spread chart.
4. Analyze: The indicator will instantly plot the Z-Score of your custom spread's price.
5. Adjust Settings: Go into the indicator's settings to adjust the Z-Score lookback period and your preferred entry/exit levels to match your trading strategy.
Inputs
• Z-Score Period: The lookback period (default 40) used to calculate the moving average and standard deviation.
• Short Entry Threshold: The positive Z-Score level (e.g., 1.8) above which you might consider a short position.
• Short Exit Threshold: The Z-Score level (e.g., 0.5) at which you might close a short position as it reverts to the mean.
• Long Entry Threshold: The negative Z-Score level (e.g., -1.8) below which you might consider a long position.
• Long Exit Threshold: The Z-Score level (e.g., -0.5) at which you might close a long position as it reverts to the mean.

ATR Money Line Bands V2The "ATR Money Line Bands V2" is a clever TradingView overlay designed for trend identification with volatility-aware bands, evolving from basic ATR envelopes.
Reasoning Behind Construction: The core idea is to blend a smoothed trend line with dynamic volatility bands for reliable signals in varying markets. The "Money Line" uses linear regression (ta.linreg) on closes over a length (default 16) instead of a moving average, as it fits data via least-squares for a cleaner, forward-projected trend without lag artifacts. ATR (default 12-period) powers the bands because it measures true range volatility better than std dev in gappy assets like crypto/stocks—bands offset from the Money Line by ATR * multiplier (default 1.5). A dynamic multiplier (boosts by ~33% on spikes > prior ATR * 1.3) prevents tight bands from false breakouts during surges. Trend detection checks slope against an ATR-scaled tolerance (default 0.15) to ignore noise, labeling bull/bear/neutral—avoiding whipsaws in flats.
Properties: It's an overlay with a colored Money Line (green bull, red bear, yellow neutral) and invisible bands (toggle to show gray lines) filled semi-transparently matching trend for visual pop. Dynamic adaptation makes bands widen/contract intelligently. An info table (positionable, e.g., top_right) displays real-time values: Money Line, bands, ATR, trend—great for quick scans. Limits history (2000 bars) and labels (500) for efficiency.
Tips for Usage: Apply to any timeframe/asset; defaults suit medium-term (e.g., daily stocks). Watch color flips: green for longs (enter on pullbacks to lower band), red for shorts (vice versa), yellow to sit out. Use bands as S/R—breakouts signal momentum, squeezes impending vol. Tweak length for sensitivity (shorter for intraday), multiplier for width (higher for trends), tolerance for fewer neutrals. Pair with volume/RSI for confirmation; backtest to optimize. In choppy markets, disable dynamic mult to avoid over-expansion. Overall, it's adaptive and visual—helps trend-follow without overcomplicating.

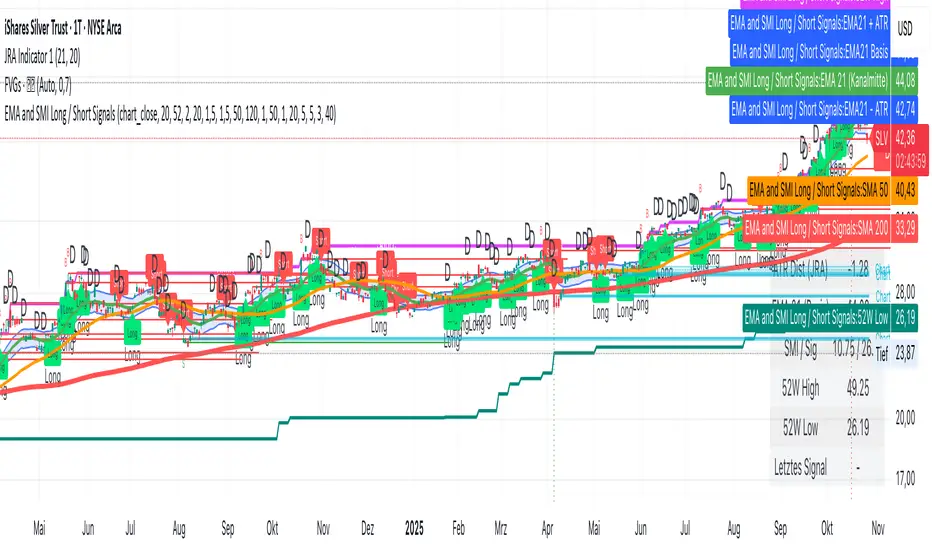
EMA and SMI Long / Short SignalsDescription:
This indicator combines several proven market mechanisms into a clearly structured system suitable for both swing traders and trend followers.
It helps to better classify market phases, identify entry and exit signals, and objectively measure trend strength.
The foundation is the 21 EMA, around which an ATR channel is drawn. This shows whether the current price is overextended or underextended (similar to Bollinger Bands, but based on volatility).
In addition, SMI-based momentum signals, volume spikes, 52-week high/low levels, and Wyckoff climax events are visualized.
The goal: clear, technically grounded decisions on trend direction, momentum, and market extremes.
Disclaimer
The information and publications are not intended to constitute, and do not represent, financial, investment, trading, or any other form of advice or recommendation provided or endorsed by TradingView.
Please refer to the Terms of Use for more information.
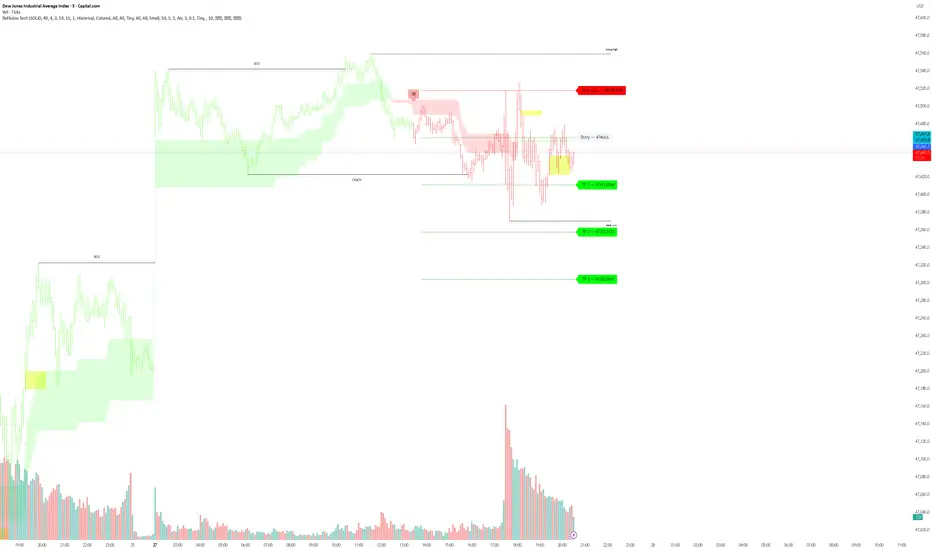
eFkolos TechMachine learning-enhanced SuperTrend indicator that uses k-means clustering to adaptively optimize SuperTrend parameters based on historical performance. Let me break down what makes this unique:
Key Innovation
Instead of using a single fixed SuperTrend factor, this indicator:
Calculates multiple SuperTrends simultaneously (with factors from 1 to 5 by default, stepped at 0.5)
Tracks performance of each variant using exponential smoothing
Clusters them into 3 groups (Best/Average/Worst) using k-means algorithm
Adapts by selecting the average factor from your chosen cluster
Clever Technical Aspects
Performance Metric: Uses a smart approach where performance = EMA of (price_change × signal_direction), giving positive values when the SuperTrend correctly predicts direction.
K-means Implementation: Properly initializes centroids using quartiles and iterates until convergence - this is solid unsupervised learning.
Adaptive MA Layer: The perf_ama that adapts faster when the performance index is high (more confidence) and slower when low.
Memory Management: Uses UDTs (User Defined Types) efficiently with arrays to handle multiple SuperTrend instances.
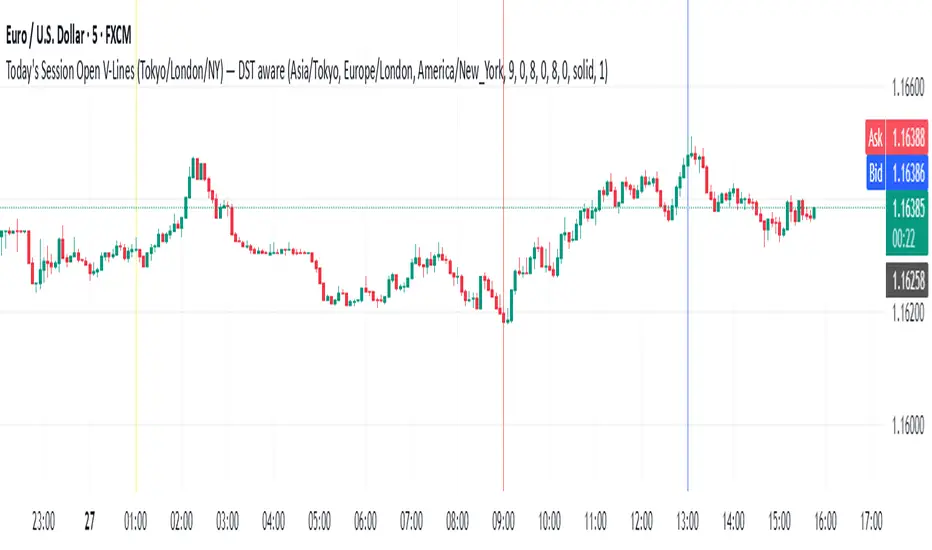
Todays Session Open LN,NYWhen are the Asian, London and New York open for each session simple stuff trading view made me right more stuff so i can publish this what to do c'est la vie
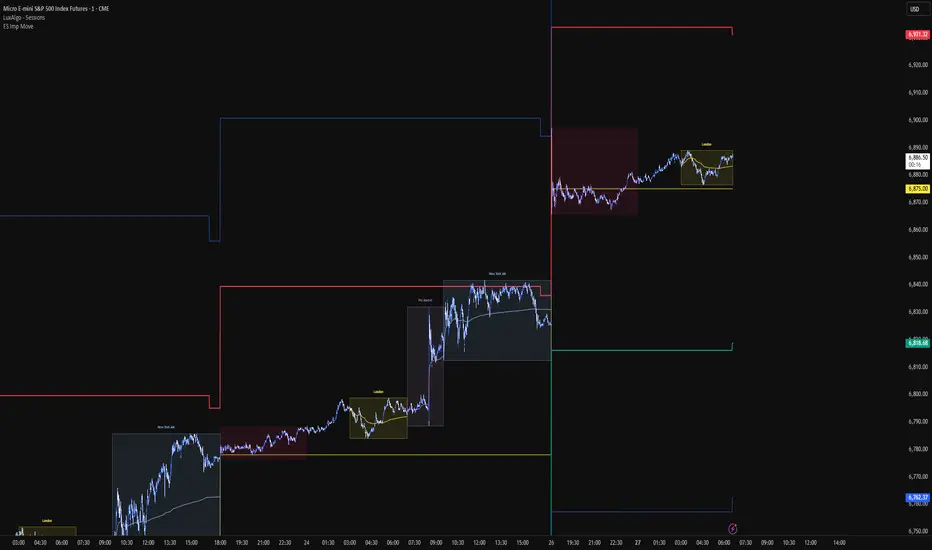
VIX Implied move on ESCalculated the moves based on VIX and draws horizontal lines on ES. Best timeframe to start is 18 hrs.
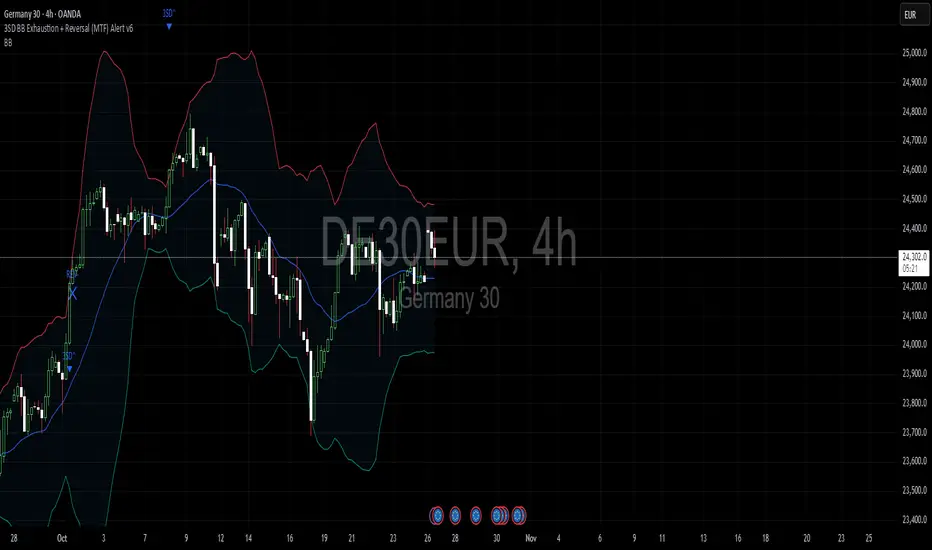
3SD Bollinger Exhaustion & Reversal Alert IndicatorThe Bollinger Band 3 Standard Deviation (3SD) captures roughly 99% of price action within its boundaries.
When price moves beyond these extremes, it often signals temporary overextension — creating opportunities for mean reversion trades, especially when aligned with the prevailing trend.
This indicator alerts you when:
- Price touches the 3SD Bollinger Band on higher timeframes (H4, D1, W1, M1), and
- A reversal reaction occurs — defined by a bullish or bearish candle close on H1 or H4.
Together, these conditions identify potential high-probability entry zones where exhaustion meets trend alignment.
🚀 Coming Soon
A premium version is in development, combining this 3SD exhaustion logic with my proprietary trend-following system.
It will generate confluence-based trade signals when price interacts with both the 3SD band and the trend-following band.
Stay tuned for updates.
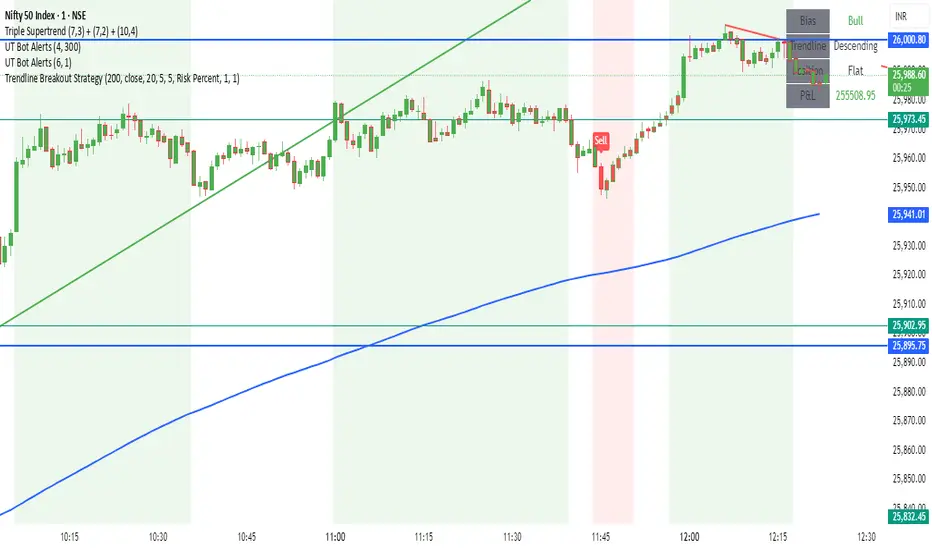
Trendline Breakout Strategy Strategy should place entries & exits so that it can be backtested (use strategy.entry and strategy.exit with explicit stop and limit prices). Include an option for fixed percent position sizing and an option for fixed contract size. Draw the trendline on the chart (with option to hide/show) and add labels that show: bias (Bull/Bear), trendline slope, entry price, SL, TP and the reason (e.g., "Trendline Breakout"). Provide user inputs for: EMA length (default 200), lookback for pivot detection, pivot sensitivity (left/right bars), quantity mode (percent / contracts), risk percent or fixed size, enable/disable backtest prints, and enable alerts. Avoid repainting: use confirmed pivot logic (pivot detection must use completed bars) and only take entry after breakout confirmed on close. Document any limitations (for example, trendline using two highest/highest bars inside lookback is approximate). Add clear comments, helpful variable names, and include example alertcondition lines for entry and exit signals.
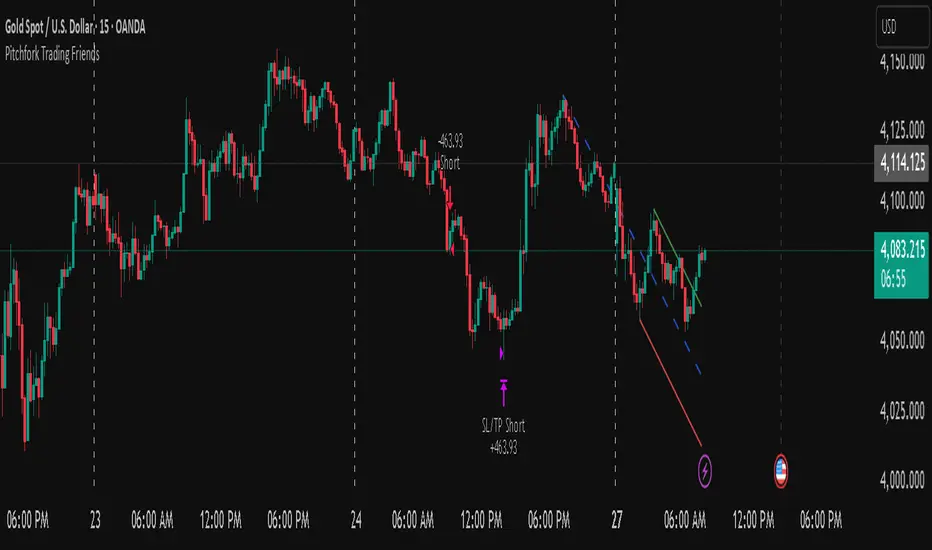
Pitchfork-Trading Friendsuses the pitchfork to give entry and exit zones, and gives a net overall summary for a beginner trader to enter into.
PDH & PDL Levels This indicator mark previous day high and low lines on current day. Lines will start at opening of the market and will remain there till end of the day. Lines are marked with PDH and PDL labels

Gaussian RibbonSummary
Adaptive Gaussian ribbon with inner/outer sigma bands and soft regime colors—green trend, red pressure, gray neutral.
What it is
A clean Gaussian filter ribbon that maps trend + volatility without the jitter. It uses a Gaussian smoother, a tiny EMA basis, and two standard-deviation bands. Color fades with distance from the basis, and flips softly (no knife-edge).
How it works
Gaussian core: IIR-style smoothing on your chosen source (default hlc3).
Basis: EMA(3) of the Gaussian for a steadier slope.
Bands: Inner = Basis ± (σ × Inner Mult), Outer = Basis ± (σ × Outer Mult).
Regime: z-score → softsign → EMA(3) → bull / neutral / bear.
Faded look: opacity ramps with distance; neutral turns gray.
What “Regime” Means (Simple)
A regime is the market’s “weather.” It shifts between Bull, Neutral, and Bear. Different tactics work in each.
How this indicator detects regime
Builds a smoothed score of price vs. the basis (z-score → softsign → EMA).
Score > 0 = Bull, score < 0 = Bear. Inside the inner band = Neutral filter to cut noise.
Color changes are soft (faded) so flips don’t knife-edge.
Playbook (What to do)
Bull (Green): Buy pullbacks to the inner band; add on strength; cut fast if price falls back inside the ribbon.
Neutral (Gray): Reduce size, fade extremes, or stand down. Wait for a clean break in either direction.
Bear (Red): Sell/short rallies to the ribbon; protect capital; flip long only after a confirmed regime turn.
For Pros (Tuning & Confirmation)
Timeframe bias: Use higher TF (1W/2W) for context; trade on 1D/4H in the higher-TF direction.
Smoother vs faster: Increase Length to reduce flip-flop; decrease for earlier turns.
Vol filter: Widen Outer/Inner multipliers in choppy markets; narrow in strong trends.
Confirm: Use structure (HH/HL vs LH/LL), volume/OBV, or your MA; ribbon = context, not a standalone trigger.
How to read it
Green = trend support; pullbacks to the inner band are typical buy-the-dip zones.
Gray = inside ribbon; chop/mean reversion. Size down or wait.
Red = trend pressure; rallies into ribbon are fade zones until regime flips.
Opacity increases with distance = stronger momentum.
Good starting presets
Macro (1W–2W): Length 90–110, Outer 2.3, Inner 1.3, Source hlc3.
Swing (1D): Length 60–80, Outer 2.0, Inner 1.4.
Intraday (1–4H): Length 30–40, Outer 1.8, Inner 1.2.
Options
Opens in a separate pane (overlay=false). Set overlay=true to place on candles (consider +5 transparency on fills).
Watermark is “CAYEN” (table-based, no editor drama).
Why it’s “safe”
No repaint. No lookahead; uses only closed-bar data.
Deterministic state and divide-by-zero guards.
Limitations
It’s a context tool. It will lag at regime turns (by design). Use structure/volume to time entries.
Credits
Script by Jason Cayen. Gaussian smoothing is classic DSP math (public domain).
Release notes (v1.0)
Initial public release: faded bands, neutral zone, soft regime colors, Non-repainting; pane by default.

FVG Donchian Channel strategy30min FVG + Donchian Channel strategy
buy sell by 30min fvg
and stoploss , take profit by Donchian Channel
Run the strategy on the 1min timeframe!

Bullish & Bearish Reversal Pattern with Sequential Bars20 Bollinger Bands and custom Stochasti_MTM Setup
Both long and short reversal signals.

Triple EMA (5, 8, 13) + Confirmed Alerts with SoundThis indicator uses three Exponential Moving Averages (EMA 5, 8, and 13) to generate buy and sell signals when the EMAs are properly aligned and not touching. Signals are confirmed on candle close and can trigger customizable sound alerts directly from the TradingView alert panel.

Reverse RSI LevelsSimple reverse RSI calculation
As default RSI values 30-50-70 are calculated into price.
This can be used similar to a bollinger band, but has also multiple other uses.
70 RSI works as overbought/resistance level.
50 RSI works as both support and resistance depending on the trend.
30 RSI works as oversold/support level.
Keep in mind that RSI levels can go extreme, specially in Crypto.
I haven't made it possible to adjust the default levels, but I've added 4 more calculations where you can plot reverse RSI calculations of your desired RSI values.
If you're a RSI geek, you probably use RSI quite often to see how high/low the RSI might go before finding a new support or resistance level. Now you can just put the RSI level into on of the 4 slots in the settings and see where that support/resistance level might be on the chart.
