EMA VIP STRThis strategy works on EMAS and standard deviation on both sides , the tp is decided on RSI levels. the strategy is a systematic trading setup
Bandas y canales
Closing Price Donchian Channels//@version=5
indicator("Closing Price Donchian Channels", overlay=true)
// Input parameters
length = input.int(20, "Period", minval=1)
showMid = input.bool(true, "Show Middle Line")
// Calculate upper and lower bands based on closing prices
upper = ta.highest(close, length)
lower = ta.lowest(close, length)
mid = (upper + lower) / 2
// Plot the bands
upperBand = plot(upper, "Upper Band", color=color.rgb(0, 184, 222))
lowerBand = plot(lower, "Lower Band", color=color.rgb(0, 184, 222))
midLine = plot(showMid ? mid : na, "Middle Line", color=color.rgb(209, 212, 220))
// Fill the area between bands
fill(upperBand, lowerBand, color=color.rgb(0, 184, 222, 90), title="Channel Fill")

Closing Price Donchian Channels Rayner//@version=5
indicator("Closing Price Donchian Channels", overlay=true)
// Input parameters
length = input.int(20, "Period", minval=1)
showMid = input.bool(true, "Show Middle Line")
// Calculate upper and lower bands based on closing prices
upper = ta.highest(close, length)
lower = ta.lowest(close, length)
mid = (upper + lower) / 2
// Plot the bands
upperBand = plot(upper, "Upper Band", color=color.rgb(0, 184, 222))
lowerBand = plot(lower, "Lower Band", color=color.rgb(0, 184, 222))
midLine = plot(showMid ? mid : na, "Middle Line", color=color.rgb(209, 212, 220))
// Fill the area between bands
fill(upperBand, lowerBand, color=color.rgb(0, 184, 222, 90), title="Channel Fill")

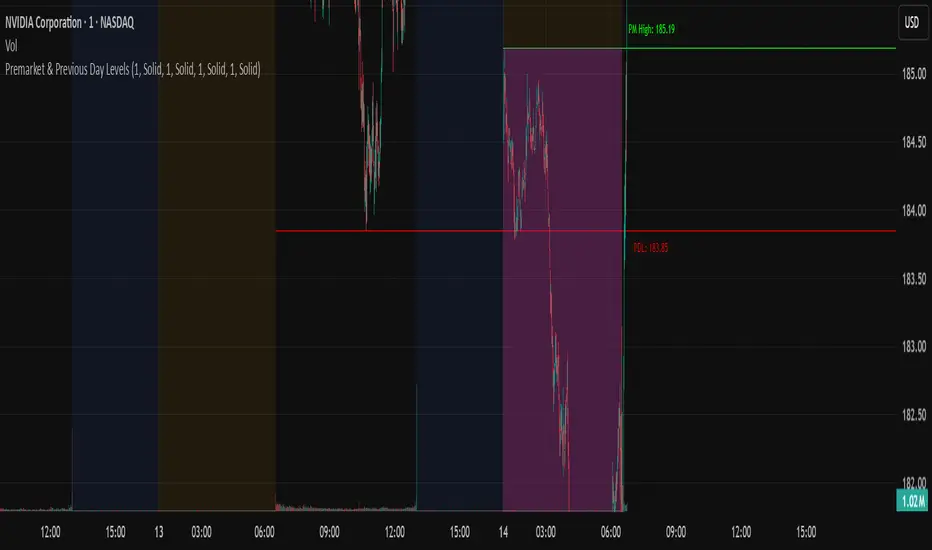
N Pops Premarket & Previous Day LevelsPrevious day high low, premarket high low, higher than previous high and lower than previous low
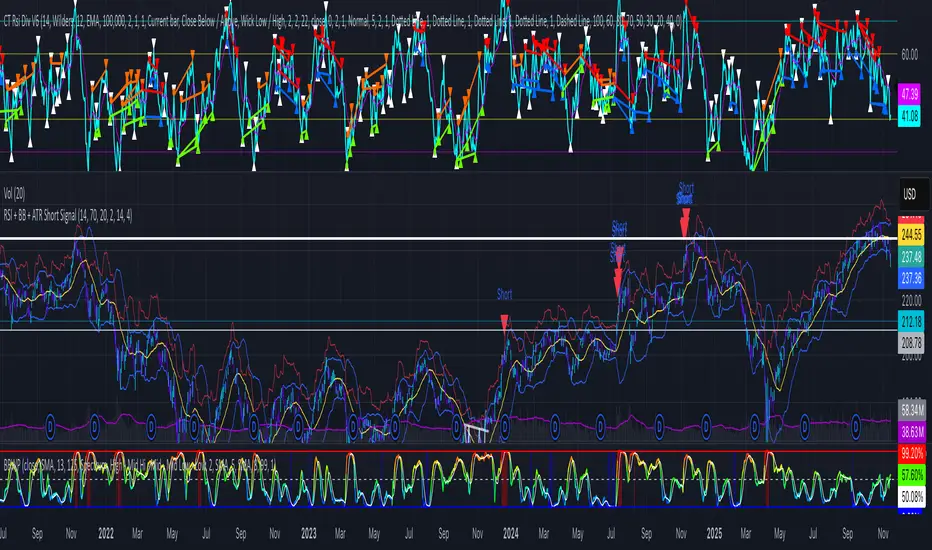
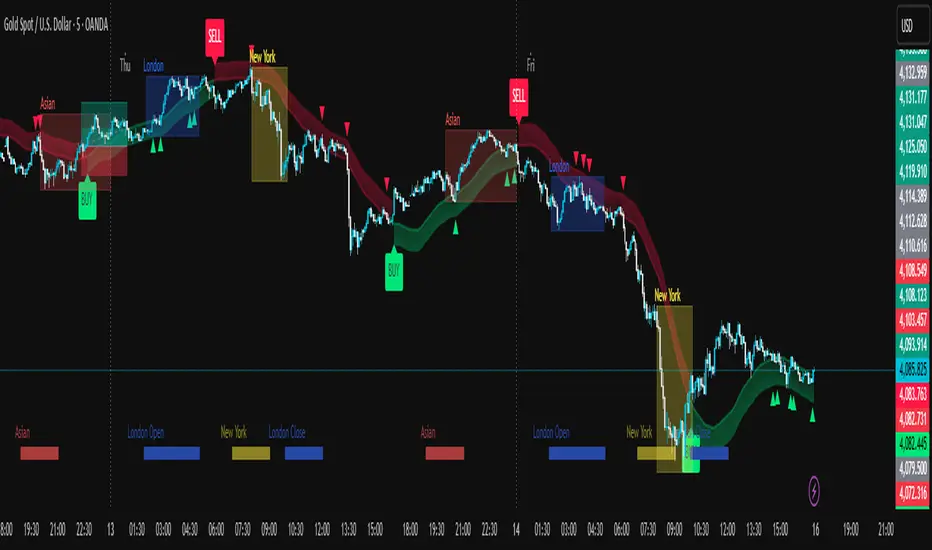
RSI + BB + ATR Short SignalThis indicator highlights potential short setups by combining three conditions:
RSI Overbought – RSI must be above the user-defined level.
Bollinger Band Break – Price must close above the upper Bollinger Band.
Extended Above the 5-Day Low – Price must sit at least X ATR above the recent 5-day low.
When all conditions line up on the same bar, the script plots a red triangle above the candle and triggers an alert so you can act immediately.
To help visualise the setup, the script also plots the full Bollinger Bands (upper, middle, lower) and a line showing the threshold of 5-day-low + ATR × multiplier. You can adjust RSI length and level, Bollinger settings, ATR length, and the ATR multiplier.
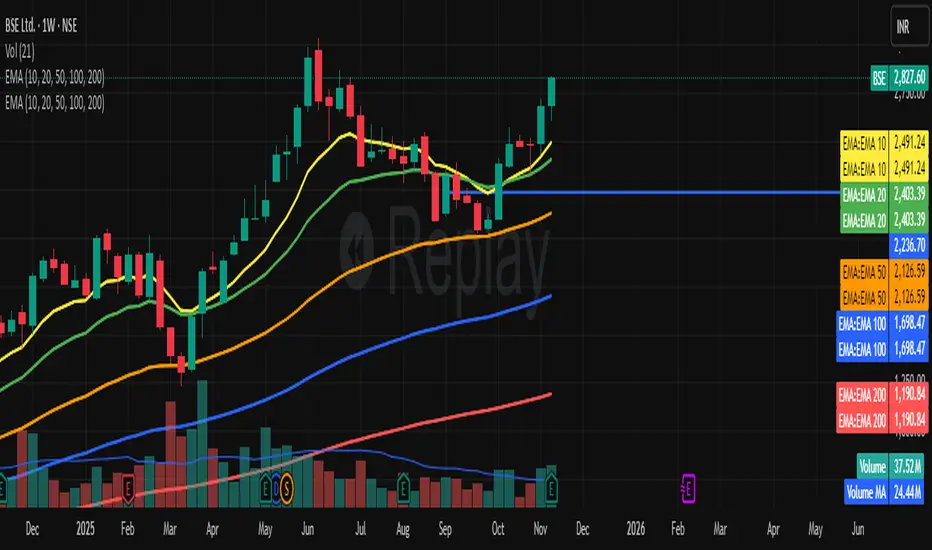
EMA Channel EMA Channel
All EMAs in single indicator
Customizable inputs
Clean color scheme
Works for any timeframe
Ideal for trend, pullback & momentum trading
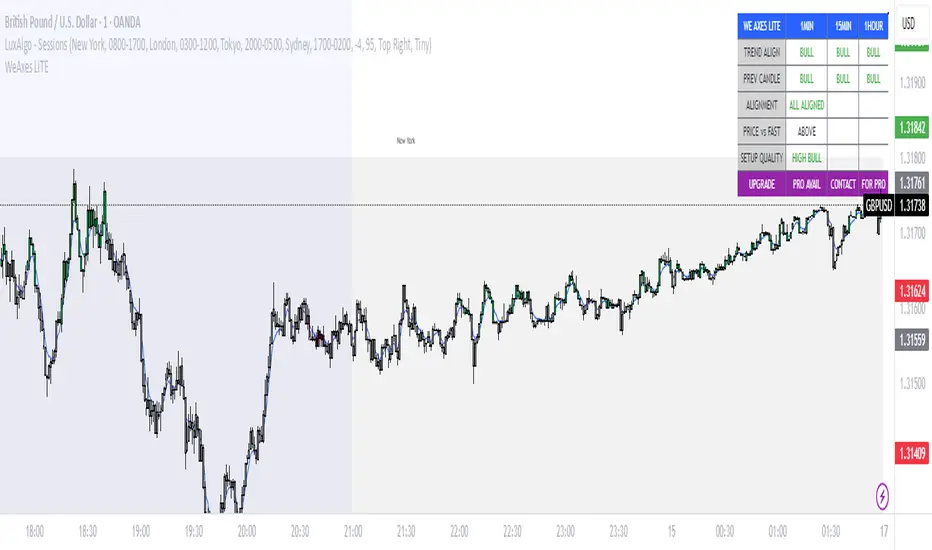
WeAxes MTF Scalper [LITE] WeAxes MTF Scalper
Professional Multi-Timeframe Alignment Tool - LITE Version
What This LITE Version Offers:
3-Timeframe Sync: Monitor 1min, 15min, and 1hr trends simultaneously
Visual Alignment System: Color-coded candles for perfect setups
Quick Setup Recognition: Instant HIGH/MEDIUM/LOW quality ratings
Clean Data Display: Essential alignment information at a glance
Perfect for Scalping:
Green Candles: Perfect bullish alignment across all timeframes
Red Candles: Perfect bearish alignment across all timeframes
Setup Quality: Know immediately if conditions are favorable
Multi-Timeframe Context: Never trade blind again
How to Use:
1. HIGH Quality Setups (Green/Red candles): Highest probability trades
2. MEDIUM Quality: All trends aligned, good for trend following
3. LOW Quality: Mixed signals, better to wait for alignment
PRO Version Includes:
- Advanced volume profiling across all timeframes
- Momentum strength calculations
- Detailed market structure analysis
- Smart Money Concepts integration
- Complete volume analysis
- And much more...
This LITE version gives you a taste of professional multi-timeframe analysis. Contact for PRO version access with full features.
Disclaimer: Use proper risk management. This tool assists analysis but doesn't guarantee profits.
掘金社趋势线
**趋势线**
1. **画法**:连接两个以上连续升高低点(上升线)或连续降低高点(下降线)。
2. **用法**:识别趋势方向、动态支撑/阻力位。价格回测趋势线时是潜在交易机会;有效突破/跌破可能预示趋势反转。
3. **原则**:触点越多越有效;避免强行拟合价格。
**斜率线**
1. **画法**:与趋势线画法相同,但更关注倾斜角度。
2. **用法**:衡量趋势强度。斜率陡峭表强势但可能不稳定;斜率平缓趋势更稳健;斜率放缓(动能背离)是潜在反转信号。
---
### English Version
**Key Uses of Trend Lines & Slope Lines**
**Trend Line**
1. **Drawing**: Connect two or more consecutive higher lows (uptrend) or lower highs (downtrend).
2. **Usage**: Identify trend direction and dynamic support/resistance. A price retest of the line offers a potential trading opportunity; a decisive break signals a potential trend reversal.
3. **Principle**: The more times the price touches the line, the more valid it is; avoid overfitting the price action.
**Slope Line**
1. **Drawing**: Same as a trend line, but with a focus on the angle of inclination.
2. **Usage**: Gauge trend strength. A steep slope indicates strong momentum but may be unsustainable; a gentle slope suggests a more stable trend; a slowing slope (momentum divergence) signals a potential reversal.

掘金社通道线Of course. Here is the English translation of the provided text about Linear Regression Channels.
***
**1. Basic Components of the Linear Regression Channel**
The Linear Regression Channel consists of five parts: the regression line, the upper and lower channel lines, the regression confirmation zone, and the regression forecast zone.
* The **regression line** forms the central axis, created through the linear regression analysis of stock prices.
* The **upper and lower channel lines** indicate the support and resistance levels of the stock price.
* The **confirmation zone** and **forecast zone** are used to determine the start/end distance for analysis and to estimate the future price range, respectively.
**2. How to Draw the Linear Regression Channel**
* Determine two anchor points to define the scope of the time period.
* Within this range, draw a line segment—the regression line—that minimizes the sum of the squared lengths of the perpendicular distances from all price points to the line.
* Draw two lines parallel to the regression line, one passing through the highest price and the other through the lowest price within the selected period, forming the linear regression channel.
* Extend these three parallel lines to the right, typically as dashed lines, to form the complete Linear Regression Channel.
**3. Application Principles of the Linear Regression Channel**
* The length of the regression channel, once determined by the two anchor points, should not be changed arbitrarily. However, when the trend line changes significantly, the channel needs to be redrawn.
* In an **uptrend**:
* When the price breaks above the upper channel line, it is expected to surge and then pull back.
* When the price falls back to the regression line, it is expected to find support and bounce.
* When the price breaks below the regression line, it is a sell signal.
* When the price breaks below the lower channel line, it is a stop-loss signal.
* In a **downtrend**, the application principles are the opposite of those in an uptrend.

Consolidation Tracker🧭 Consolidation Tracker — Visualize Market Reversals in Real Time
The Consolidation Tracker is a minimalist yet powerful tool designed to map the anatomy of market reversals and trend transitions. It highlights the structural evolution of price through four key phases, helping traders anticipate shifts with clarity and confidence.
🔄 The Four Stages of a Market Reversal:
Failure to Displace — Price fails to break beyond recent highs or lows, signaling potential exhaustion of the current trend.
Consolidation (CAMP) — A range-bound phase where price compresses between a dynamic high and low. These zones are shaded gray, representing indecision and balance.
Engulfing (ENGULF) — A decisive candle closes beyond the CAMP high or low, suggesting a directional shift. These are highlighted in orange.
Fair Value Gap (FVG) — A three-candle pattern forms a price imbalance. If this FVG also engulfs the CAMP range, it confirms the reversal and resets the CAMP. Bullish FVGs are shaded green, bearish FVGs in red.
🔁 From Reversal to Trend:
Once a reversal is confirmed via an FVG, the market often transitions into a trend cycle characterized by:
Displacement — Strong directional movement away from the prior range.
Fair Value Gaps — Continuation imbalances that offer high-probability entries on retracements.
🧠 How It Works:
The indicator dynamically tracks CAMP highs and lows, updating only when a candle engulfs the range or a valid FVG forms.
FVGs are detected when a three-candle sequence creates a gap between candle 2 and 0, and the middle candle (candle 1) breaks the CAMP boundary.
CAMP levels are plotted as horizontal lines, while background colors narrate the evolving structure in real time.
This tool is ideal for traders who value market structure, price efficiency, and narrative clarity. Whether you're anticipating reversals or riding trends, the Consolidation Tracker offers a clean, actionable lens into price behavior.

8-12 wk Consolidation → Upside Breakout [sijoittaja.fi]This Screener looks for stocks that are about to break out after 8-12 weeks of consolidation. The code was developed using GROK, and there are no guarantees that the code will work.

TNT TRADER MARKET ClOSEVertical Line of red showing the New York market close. Color and time can be changed

TNT TRADER EMA FANEMA fan of 8 20 50 200, very simple and straight forward with color change options.

Fractional Candlestick Long Only Experimental V10Fractional Candlestick Long-Only Strategy – Technical Description
This document provides a professional English description of the "Fractional Candlestick Long Only Experimental V6" strategy using pure CF/AB fractional kernels and wavelet-based filtering.
1. Fractional Candlesticks (CF / AB)
The strategy computes two fractional representations of price using Caputo–Fabrizio (CF) and Atangana–Baleanu (AB) kernels. These provide long-memory filtering without EMA approximations. Both CF and AB versions are applied to O/H/L/C, producing fractional candlesticks and fractional Heikin-Ashi variants.
2. Trend Stack Logic
Trend confirmation is based on a 4-component stack:
- CF close > AB close
- HA_CF close > HA_AB close
- HA_CF bullish
- HA_AB bullish
The user selects how many components must align (4, 3, or any 2).
3. Wavelet Filtering
A wavelet transform (Haar, Daubechies-4, Mexican Hat) is applied to a chosen source (e.g., HA_CF close). The wavelet response is used as:
- entry filter (4 modes)
- exit filter (4 modes)
Wavelet modes: off, confirm, wavelet-only, block adverse signals.
4. Trailing System
Trailing stop uses fractional AB low × buffer, providing long-memory dynamic trailing behavior. A fractional trend channel (CF/AB lows vs HA highs) is also plotted.
5. Exit Framework
Exit options include: stack flip, CF

Turtle Long & Short (Donchian + N-Stop). Overview and Core Functionality
The indicator implements the classic Turtle Trading System rules. It uses two sets of Donchian Channels for generating entry and exit signals, and the Average True Range (ATR), referred to as N, to calculate a dynamic, volatility-adjusted initial stop-loss.
The script simulates a position's life cycle (entry, holding the fixed initial stop, and exiting) and only conditionally displays the calculated initial stop-loss price on the chart when a trade signal is active.
2. Key Input Parameters (Adjustable Settings)
The script provides detailed input groups for customization:
A. Signal Settings:
len_entry (Default: 20): Period for the Entry Donchian Channel (20-day high/low breakout).
len_exit (Default: 10): Period for the Exit Donchian Channel (10-day low/high trailing stop).
B. Risk Settings (N):
len_atr (Default: 20): Period used to calculate the Average True Range (N), which determines volatility.
stop_loss_multiplier (Default: 2.0): The factor applied to N to calculate the initial stop-loss (e.g., 2.0×N=2N).
C. Label Display: Controls the appearance of the entry labels.
label_background_color_long / label_background_color_short: Background color for Long/Short entry labels.
label_text_color: Text color for the labels.
label_size_input: Size control for the label (tiny, small, normal, large, huge).
3. Trading Logic and State Management
A. Entry and Exit Conditions
Trade Type Entry Condition Trailing Exit Condition Stop-Loss (SL)
Long Close > 20-period High Close < 10-period Low Fixed Entry Price−(Multiplier×N)
Short Close < 20-period Low Close > 10-period High Fixed Entry Price+(Multiplier×N)
In Google Sheets exportieren
B. Position State Management
The script uses persistent var float variables (fixed_long_stop_price and fixed_short_stop_price) to maintain the state:
Upon an Entry signal, the calculated stop-loss price is fixed and assigned to the respective var variable.
The variable holds this fixed price on subsequent bars.
The price is reset to na (Not Applicable) only when an Exit condition (10-period trailing exit, fixed stop-loss hit, or reverse entry signal) is met.
This logic ensures the initial stop-loss line is plotted only when a simulated trade is active.
4. Visual Elements and Alerts
Donchian Channels: Plotted as two lines (Entry High/Exit Low) with a fill for visualization.
N-Stop-Loss Lines: Two lines (fixed_long_stop_price in Fuchsia and fixed_short_stop_price in Orange) are plotted using plot.style_linebr, ensuring they appear only after a trade signal fires and disappear on exit.
Signal Shapes (plotshape):
Long Entry: Green triangle below the bar.
Short Entry: Red triangle above the bar.
Long/Short Exits: Diamond shapes indicating the trailing stop exit.
Entry Labels (label.new): Custom-colored labels appear at the point of entry, displaying the current N value and the exact calculated N-Stop price.
Alerts (alertcondition): Alerts are set up for both Long Entry and Short Entry conditions.

Absorption — Bullish or BearishAbsorption — Bullish or Bearish Only is a lightweight and minimalistic tool designed to identify pure absorption events in the market.
It highlights only two conditions:
Bullish Absorption
• Volume spike
• Small candle body
• Positive delta behavior (close > open)
→ Indicates potential buy-side absorption at lows
Bearish Absorption
• Volume spike
• Small candle body
• Negative delta behavior (close < open)
→ Indicates potential sell-side absorption at highs
This script intentionally keeps the chart clean by marking only “Bullish” or “Bearish” labels, without any additional visuals, colors, or extra signals.
Ideal for traders who want a simple, non-disruptive absorption confirmation tool.

Absorption DetectorAbsorption Detector is a clean and effective tool designed to identify institutional absorption at key turning points of the market.
It highlights candles where volume surges but the real body remains small, indicating potential absorption of liquidity before a reversal move.
Key Features
Volume Spike Detection – identifies abnormal increases in traded volume
Small Body Recognition – pinpoints candles with low real-body percentage
Delta Simulation (Fake Delta) – uses close–open behavior to approximate bullish/bearish delta
Bullish Absorption – highlights potential low-side absorption (green dots + green candles)
Bearish Absorption – highlights potential high-side absorption (red dots + red candles)
Background Highlighting – visual emphasis on absorption zones
Clean, lightweight and non-repainter
How It Helps
Absorption often occurs before strong moves:
Large players fill opposite orders
Stops are triggered and absorbed
Liquidity on one side dries up
Reversal or continuation moves follow
This indicator makes it easy to spot these moments in real time.

Volume Spike HighlighterVolume Spike Highlighter is a simple and effective volume-based tool designed to highlight abnormal trading activity.
It detects when the current volume exceeds the average volume by a customizable multiplier and visually emphasizes those bars with bright colors, making unusual buying or selling pressure easy to spot.
Features:
Highlights volume spikes with enhanced green/orange color
Normal volume remains standard red/green
Adjustable lookback period and spike multiplier
Includes a smooth volume moving average for context
Clean and lightweight, ideal for intraday or swing traders
This indicator helps traders quickly identify strong participation, breakouts, absorption zones, trap candles, and areas where institutions may be active.

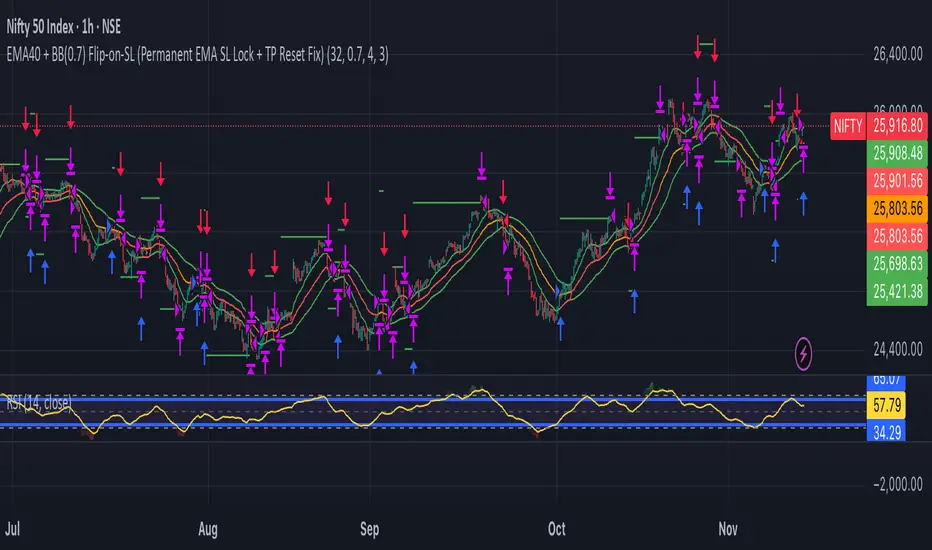
Custom Reversal Scalper – Adib NooraniCustom Reversal Scalper – Adib Noorani (Modified Edition)
An improved, non-repainting visual reversal indicator inspired by Adib Noorani's "Reversal Scalper" and updated to address key shortcomings with compliance to Adib's rules and recommendations.
Reversal Logic & Entry Filtering: Combines Adib's reversal oscillator and trend ribbon logic with added 30-minute exclusion, optimizing signals for volatile Indian indices like $NSE:NIFTY.
Shortcomings Addressed:
Eliminates repainting—entries and exits only display after the required market action.
Implements strict intraday time filtering per Adib's guidance.
Uses automatic, dynamic trailing stop (red line) post-take-profit for advanced risk management.
Maintains risk:reward visualization and minimizes chart clutter.
Directly Based on: Adib Noorani's YouTube training: www.youtube.com
How to Use:
Trade only outside first 30 minutes, per Adib's rules.
Go Long on black candle after confirmation and price crosses blue line.
Go Short on white candle after confirmation and price crosses blue line.
Stop into trailing is handled automatically after take profit.
Follow all further execution and visual risk management recommendations as per Adib's video.
This script incorporates the key corrections and execution principles demonstrated by Adib Noorani for safe scalping on Indian indices and F&O instruments.
Credits: Original logic and teaching by Adib Noorani . Modifications, anti-repainting logic, and full RR/visual improvements by script author.
For educational purposes. Please backtest and follow personal risk management.


ATR Stoploss zones — ProfessarrThis ATR STOPLOSS indicator has been made by Professarr to to help you place stop loss orders by visualizing with a line below the candles (for the long stoploss) or above the candles (for the the short stoploss)
