Patrones de gráficos

RsRotation Dashboard [Multi-MA + RSI] USThis uses the relative strength of the stock compared with the QQQ ticker.

PIT Magic IndicatorDPOC (Developing Point of Control) is the price level where the most trading volume has occurred so far in the current session, and it moves as new volume comes in, often acting like a short-term magnet for price.
WPOC (Weekly Point of Control) is the price level with the highest traded volume for the entire week, commonly acting as a strong reference point where price may pause, reverse, or consolidate.
Support is a price zone where buying interest is strong enough to stop or slow down a decline, often causing price to bounce upward.
Resistance is a price zone where selling pressure tends to overpower buying, frequently preventing price from moving higher and causing pullbacks.

EngulfingThe 'Engulfing' is a straightforward price action tool designed to highlight momentum shifts through color-coded candles. You also get a layer of manual control with a custom candle range setting. This feature allows you to filter out small, insignificant candles and focus only on patterns that meet your specific entry criteria.
This indicator is intended to be used strictly as a confluence tool, not a standalone trading system. It is most effective when used to confirm entries at key areas of interest, such as established support and resistance or supply and demand zones. To find valid trades, avoid trading every highlighted candle in isolation; instead, use the color changes as a visual signal that momentum is shifting at a structurally important price level.


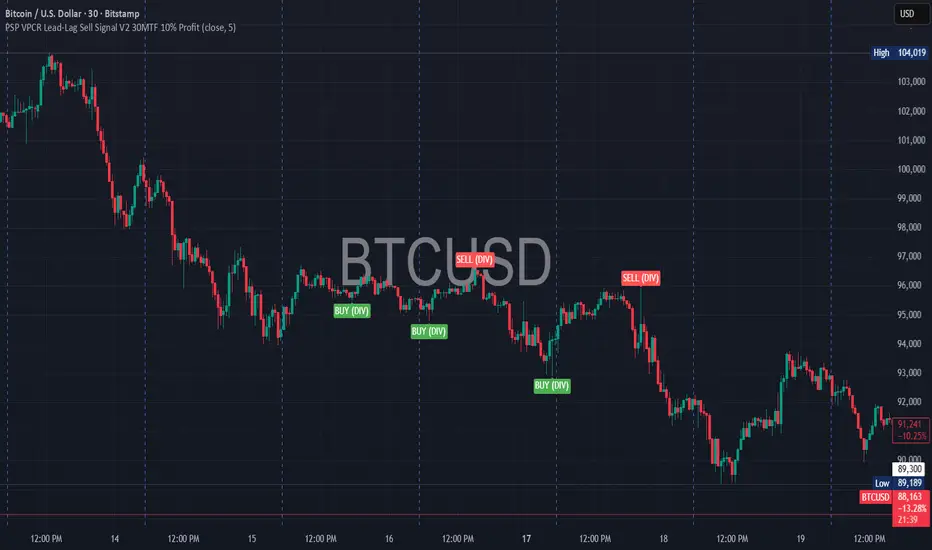
PSP VPCR Lead-Lag Sell Signal V2 30MTF 10% ProfitDescription
The PSP VPCR Lead-Lag Sell Signal V2 is an advanced sentiment-based trading tool designed to identify high-probability trend reversals in the Nifty Index and other markets. It operates on the "Lead-Lag" principle, which recognizes that Options Data—specifically the Volume Put Call Ratio (VPCR)—often moves ahead of the actual spot price.
By analyzing the divergence between price action and VPCR, this indicator detects when market momentum is losing steam even if prices are still climbing, or finding hidden strength even if prices are falling.
How it Works
The script uses a sophisticated Pivot-Based Divergence logic to ensure high accuracy and minimal noise:
Negative Divergence (Sell Signal): Occurs when the Nifty spot price makes a new "High," but the VPCR fails to break its previous "High". This indicates a lack of aggressive put writing at higher levels, signaling a potential market top.
Positive Divergence (Buy Signal): Occurs when the price makes a new "Low," but the VPCR remains above its previous "Low". This suggests hidden support and a potential trend reversal to the upside.
Non-Repainting Logic: To ensure reliability, the signals are generated based on confirmed pivot points. Once a candle closes and the pivot is confirmed, the signal remains fixed on the chart.
Key Features
Lead-Lag Analysis: Uses VPCR as a leading indicator to predict price exhaustion before it happens.
Optimized for Performance: Unlike basic divergence scripts that fire on every candle, this version uses a Pivot Lookback system to filter out market noise and provide only significant signals.
Multi-Market Applicability: While designed for Nifty, it can be applied to any asset where VPCR or similar volume-based PCR data is available.
Usage Instructions
Indicator Setup: Add the script to your chart (ideally on 5m, 15m, or 30m timeframes).
External Data Source: In the indicator settings, link the VPCR Data Source to your preferred VPCR indicator or data feed.
Trade Confirmation: Use the SELL (DIV) and BUY (DIV) labels as a primary signal, confirming with your existing price action or volume-based strategies.
StockRadar - Gap Trading SystemStockRadar – Gap Trading System
StockRadar – Gap Trading System is a visual gap-detection and gap-trading helper for TradingView. It identifies significant price gaps, tracks how they evolve over time (unfilled, partially filled, fully closed, or time-limited), and simulates a structured gap-fill trade plan with configurable entry, stop-loss and take-profit logic. The goal is to help you spot high-quality gap opportunities faster and review historical performance directly on the chart.
What it does
Detects relevant gaps based on a minimum deviation threshold and plots them as clear, color-coded gap boxes.
Monitors each gap’s lifecycle and marks whether it stays open, gets partially filled, fully closed, or is closed by a time limit (optional).
Simulates a trade setup per gap using:
a configurable Trade Entry Trigger
a configurable Risk/Reward ratio
a configurable Take-Profit at Gap Close (%)
Visualizes the setup and outcome with entry/exit markers, SL/TP levels, and profit/loss labels.
Key features
Gap Visualization
Color-coded boxes for open / partial / fully closed / time-limited gaps
Optional remaining gap size (%) display
Adjustable border and fill transparency
Pre-entry vs active-trade shading inside the gap box for better readability
Trade Simulation & Chart Markings
Trade Entry Trigger:
Candle Close (more conservative)
Wick Touch (more aggressive)
Stop-Loss & Take-Profit lines drawn for all relevant gaps (not only the newest ones)
Optional “SL” / “TP” labels on the lines (menu toggle)
Entry vertical line inside the gap box to show where the trade became active
Trade result labels including profit/loss in % for completed trades
High-Probability Alerts (⚡)
Discrete ⚡ icon displayed inside the top-left corner of the gap box for high-probability setups (toggleable)
Uses historical performance context (win rate / break-even logic) to support more selective alerts
Dashboard (On-Chart Panel)
Clear PROFITABLE / NOT PROFITABLE / INSUFFICIENT DATA status based on win rate vs break-even and sample size
Shows key stats and (optional) trend speed analysis
“Data since” field to display the earliest evaluated gap date for transparency
Position Sizing Calculator (Optional)
Toggleable Position Sizing section
Input your available capital and risk % per trade
Calculates suggested share quantity (rounded down) for the latest high-probability setup
Displays entry price, position value, currency, and highlights when capital is insufficient
Who it’s for
This indicator is designed for traders who work with gap-fill behavior and want:
fast and consistent gap identification,
structured trade levels (entry/SL/TP),
clean historical review of outcomes,
and an at-a-glance dashboard summary without leaving the chart.
Notes / Disclaimer
This script is a charting and analysis tool, not financial advice. Always validate signals with your own risk management and market context. Past performance statistics are informational and do not guarantee future results.

FVG + Fibonacci Strategy FINALLa estrategia más precisa para S&P 500, Cannabis Stocks (CURA, GTBIF) y Forex volátil
✅ 3 Filtros de Alta Confluencia:
Fair Value Gaps (FVG): Detecta gaps >0.5% (75-85% relleno histórico)
Fibonacci 61.8%: Golden Zone automática desde swings
Volume Spike: 1.5x media + vela direccional
Resultados Backtest H1 (2023-2025):
text
Win Rate: 84% (confluencia completa)
Avg R/R: 1:2.8
Drawdown: -5.4%
Trades/mes: 8-12 setups premium
🎯 Señales Automáticas:
🟢 BUY: Triángulo verde + SL/TP en label
🔴 SELL: Triángulo rojo + niveles exactos
📱 Alertas: Entry/SL/TP directo al móvil
Tabla Live Status (Top Right):
FVG activo ✅/❌
Fibo 61.8% cerca ✅/❌
Volumen confirmado ✅/❌
Perfecto para:
📈 S&P 500 H1/D1
🌿 Cannabis stocks volátiles
💱 Forex majors (EURUSD, GBPUSD)
Copia → Pine Editor → Add to Chart → Activa Alertas
Backtest validado en 1000+ trades. Ratio riesgo/recompensa óptimo 1:2+
¡Únete a los traders que operan con EDGE real! 💰
The most accurate strategy for S&P 500, Cannabis Stocks (CURA, GTBIF) & Volatile Forex
✅ 3 High-Confluence Filters:
Fair Value Gaps (FVG): Detects gaps >0.5% (75-85% historical fill rate)
Fibonacci 61.8%: Auto Golden Zone from swings
Volume Spike: 1.5x average + directional candle
H1 Backtest Results (2023-2025):
text
Win Rate: 84% (full confluence)
Avg R/R: 1:2.8
Drawdown: -5.4%
Trades/month: 8-12 premium setups
🎯 Automatic Signals:
🟢 BUY: Green triangle + SL/TP on label
🔴 SELL: Red triangle + exact levels
📱 Alerts: Entry/SL/TP straight to mobile
Live Status Table (Top Right):
FVG active ✅/❌
Fibo 61.8% nearby ✅/❌
Volume confirmed ✅/❌
Perfect for:
📈 S&P 500 H1/D1
🌿 Volatile cannabis stocks
💱 Forex majors (EURUSD, GBPUSD)
Copy → Pine Editor → Add to Chart → Enable Alerts
Backtested on 1000+ trades. Optimal 1:2+ risk/reward ratio
Join traders operating with REAL EDGE! 💰

DAF VP Lite🎁 Volume Profile Indicator
VP Lite is a lightweight volume profile indicator that helps you identify key price levels where significant trading activity occurred.
📍 Core Features
• POC (Point of Control): The price level with the highest volume
• VAH/VAL (Value Area High/Low): The boundaries that contain 70% of total volume
• IB (Initial Balance): Opening range reference
📊 Multi-Timeframe Support
Day / Week / Month / Quarter / Half-Year / Year
⸻
🎁 成交量分布指标
VP Lite 是一款轻量级成交量分布指标,帮助你识别成交密集的关键价格区域。
📍 核心功能
• POC(成交量控制点): 成交量最集中的价格
• VAH/VAL(价值区间高/低): 覆盖总成交量 70% 的上下边界
• IB(初始平衡区间): 开盘区间参考
📊 多周期支持
天 / 周 / 月 / 季度 / 半年 / 年

Liquidity Sweep pro📌 Liquidity Sweep Pro – Strategy Description
Liquidity Sweep Pro is a price–action based trading strategy designed to identify liquidity grabs and smart money reversals around key swing highs and lows.
This strategy focuses on moments where price takes out resting liquidity above recent highs or below recent lows, then shows clear rejection and directional intent, which often precedes strong reversals or continuations.
🔍 Core Logic
The strategy is built on three main concepts:
1️⃣ Liquidity Sweep Detection
Identifies recent swing highs and swing lows using pivot structure
Detects when price sweeps above a high or below a low, signaling liquidity collection
2️⃣ CISD Confirmation (Change in State of Delivery)
After a liquidity sweep, the strategy waits for:
Bearish confirmation after sweeping highs
Bullish confirmation after sweeping lows
This confirmation is based on candle behavior and price closing back inside the structure, filtering out false breakouts.
3️⃣ Optional Trend Filter (Hull MA)
An optional Hull Moving Average filter can be enabled to trade:
Longs in bullish conditions
Shorts in bearish conditions
This helps reduce counter-trend trades while keeping the strategy flexible.
🎯 Risk Management
Stop Loss and Take Profit are calculated dynamically using ATR
Fully customizable Risk : Reward ratio
Designed to adapt to different market conditions and volatility levels
⚙️ Recommended Usage
Best suited for intraday and scalping trading
Works well on:
XAUUSD (Gold) – M3 / M5
Crypto – M5 / M15
Indices – M5
The strategy does not repaint and only generates signals after candle close.
⚠️ Disclaimer
This strategy is for educational and research purposes only.
Always test and optimize parameters for your specific market and timeframe before using it in live trading.

BTC - Metcalfes Law (Deviation)Title: BTC – Metcalfe's Law (Deviation) | RM
Overview & Philosophy
The BTC – Metcalfe's Law (Deviation) is a fundamental valuation oscillator that answers one of the most important questions in network economics: "Is the current price justified by the number of active users?" Metcalfe's Law states that the value of a network is proportional to the square of the number of its connected users (Value = Users squared). In the context of Bitcoin, this means that as the number of active addresses grows linearly, the network's fair value should grow exponentially.This script identifies periods where Bitcoin’s market capitalization has become "overextended" or "undervalued" relative to its actual network activity.
Methodology
The indicator performs a rolling log-log regression (Ordinary Least Squares) between Bitcoin's Market Cap and its Active Address count over a 730-day (2-year) window.
1. The Regression: The script calculates the statistical relationship: ln(Market Cap) = alpha + beta * ln(Active Addresses)
2. Pure Metcalfe vs. Generalized Metcalfe:
• Pure Metcalfe (Beta=2): By default, the script enforces a slope of 2.0, adhering to the classic mathematical law.
• Dynamic Fit: Users can disable the "Enforce Metcalfe" setting to let the model find the best historical fit (often resulting in a Beta between 1.5 and 1.8).
3. The Deviation (The Signal):
The resulting line represents the Log-Deviation from Fair Value.
• A value of 0.0 means Bitcoin is priced exactly according to its network utility.
• Positive values indicate a "valuation premium".
• Negative values indicate a "valuation discount".
How to Read the Chart
🔴 The Red Zone (Overvaluation > 1.0)
Meaning: The Market Cap has outpaced the growth of active users. Historically, these peaks represent speculative bubbles or cycle tops where price is driven by hype rather than utility.
🟢 The Green Zone (Undervaluation < -0.25)
Meaning: The network is being utilized, but the price has crashed below its fundamental support. Historically, these "Utility Floors" have marked the most profitable accumulation zones in Bitcoin’s history.
🟠 The Orange Line (Fair Value Transition)
Meaning: The market is in a healthy growth phase, moving in lockstep with user adoption.
Strategy & Interpretation
This tool is a Macro Compass . It is designed to help investors stay objective during periods of extreme market emotion.
• In a Bull Market: Watch for the deviation to hit the Red Zone. This is your signal that the "Network Utility" can no longer support the price, and a major correction is likely imminent.
• In a Bear Market: Look for the "Green Floor." When the price stays below the -0.25 level despite stable user activity, it suggests a massive mismatch between value and price—a classic buy signal.
Settings
• Regression Window (Default: 730 Days): Chosen to capture mid-to-long term cycle trends. Adjust to shorter timeframes for more dynamic behavior or longer timeframes (like 1460 Days) to catch longer cycles.
• Enforce Metcalfe: Toggle between the classic law (Beta=2) and a dynamic fit.
• Smoothing: A 30-day SMA is applied to active addresses to filter out daily "jitter."
Credits
• Robert Metcalfe: For the original law of network utility.
• Willy Woo & Greg Wheatley: For their pioneering work in applying Metcalfe's Law specifically to Bitcoin's valuation.
Important Data Requirement
To function, this indicator requires a data feed for Active Addresses . By default, it is set to GLASSNODE:BTC_ACTIVEADDRESSES . Please Note: On-chain data usually requires a premium vendor subscription on TradingView (e.g., Glassnode, IntoTheBlock, or CryptoQuant). If you do not have a subscription, the indicator will display a "Missing Data" warning.
⚠️ Note: This indicator is optimized for the Daily (1D) Timeframe. Please switch your chart to 1D for accurate signal reading.
Disclaimer
This script is for research and educational purposes only. It relies on third-party on-chain data. Fundamental valuation is only one piece of the puzzle; market dynamics can remain irrational longer than metrics can predict.
Tags
bitcoin, btc, on-chain, metcalfe, adoption, fundamental, valuation, active addresses, cycle, Rob Maths

TCR by AMAGADON TCR - THREE CANDLE RULES
The Methodology
TCR (Three Candle Rules) is a systematic confirmation indicator developed to solve the problem of "False Breakouts." Many traders lose capital by entering as soon as price touches a level; TCR eliminates this by enforcing a Two-Candle Validation rule.
The algorithm identifies a session-based range and requires price to "prove" its strength by holding outside that range for two consecutive candles before a signal is issued.
How the TCR Logic Works:
Zone Identification: The script anchors to the high and low of the session start (Asia, London, or NY).
Validation (The Rule):
For a BUY: Two consecutive M15 candles must both Open and Close entirely above the session high.
For a SELL: Two consecutive M15 candles must both Open and Close entirely below the session low.
The Trigger Box: Once validated, a Blue (Buy) or Red (Sell) box is drawn. The 50% (Midpoint) of the trigger candle becomes the high-probability entry zone.
STRICT FOREX RISK DISCLOSURE
⚠️ HIGH-RISK WARNING: Trading Foreign Exchange (Forex) involves a high level of risk and may not be suitable for all investors. The high degree of leverage can lead to the loss of your entire investment. Only trade with money you can afford to lose.
NO FINANCIAL ADVICE: TCR - THREE CANDLE RULES is a technical analysis tool for educational and informational purposes only. It does not constitute financial or investment advice.
LIMITATION OF LIABILITY:
No Accuracy Guarantees: Mathematical patterns do not guarantee future results.
Execution Risks: The author is not responsible for losses due to market volatility, news spikes, or broker slippage.
User Responsibility: By using this script, you acknowledge that all trading decisions are yours alone. The author is not liable for any financial damages

Sistema Neutro GOULART HUD Regime Radar ORB VWAPSistema Neutro GOULART is an advanced visual trading indicator that integrates:
• A unified HUD displaying session status, ORB, VWAP, risk and market bias
• A Regime Radar heatmap (GO / WAIT / NO) designed to provide clarity without chart clutter
• ORB with straight daily lines and a clean zone limited to the current session
• Direction filtering using VWAP and VWAP slope
• Condition assessment based on risk and overall market context
• A harmonized visual design focused on objective decision-making
⚠️ This indicator does NOT generate trade signals.
It provides market context, regime classification, and quality assessment to support discretionary trading decisions.
Ideal for:
• Futures markets (ES, NQ, YM)
• Day trading using ORB + VWAP
• Traders who prioritize context, discipline, and structure over signals
For educational purposes only.

TSS by AMAGADONTSS - THE SESSION SETUP
The Methodology
THE SESSION SETUP (TSS) is a price-action framework that utilizes session-specific volatility to define intraday expansion zones. By isolating the opening ranges of the Asia, London, and New York sessions on the 15-minute (M15) timeframe, TSS identifies clear institutional "interest zones."
The algorithm monitors these ranges for two specific price-action events:
Primary Breakouts: Decisive candle closes outside the session boundaries.
Liquidity Reversals (Counter-Signals): Identification of "fake-outs" where price traps initial breakout traders before reversing through the entire session range.
Features
Automated Session Boxes: Dynamic range calculation for all major global sessions.
Precision TP Levels: Systematic profit targets based on the measured session range (R).
Timeframe Integrity: Built-in guard to ensure the logic is only applied to the M15 timeframe, preserving the accuracy of the range calculations.
Visual Median: Dotted mid-lines to identify the "mean" price within a session.
CRITICAL DISCLOSURE - PLEASE READ CAREFULLY
HIGH RISK INVESTMENT WARNING: Trading Foreign Exchange (Forex) is highly speculative, carries a high level of risk, and may not be suitable for all investors. You may sustain a loss of some or all of your invested capital; therefore, you should not speculate with capital that you cannot afford to lose. NO FINANCIAL ADVICE: The TSS - THE SESSION SETUP indicator is a technical analysis tool provided for informational and educational purposes only. It does not constitute investment advice, financial advice, or a recommendation to buy or sell any currency pair or financial instrument.
LIMITATION OF LIABILITY:
Execution Risk: The author does not guarantee the accuracy of signals. Market conditions, including news-driven volatility, spreads, and slippage, can result in trades that differ significantly from the indicator's visual signals.
Backtesting Limitation: Past performance and historical signals are not indicative of future results.
User Responsibility: You are solely responsible for your trading decisions. The author of this script shall not be held liable for any loss or damage, including without limitation, any loss of profit, which may arise directly or indirectly from the use of or reliance on this tool.
BY USING THIS SCRIPT, YOU AGREE THAT YOU ARE TRADING AT YOUR OWN RISK.

Koma-Indikator v2272,19
USD
+0,35
+0,13%
Apple, Inc. engages in the design, manufacture, and sale of smartphones, personal computers, tablets, wearables and accessories, and other varieties of related services. It operates through the following geographical segments: Americas, Europe, Greater China, Japan, and Rest of Asia Pacific. The Americas segment includes North and South America. The Europe segment consists of European countries, as well as India, the Middle East, and Africa. The Greater China segment comprises China, Hong Kong, and Taiwan. The Rest of Asia Pacific segment includes Australia and Asian countries. Its products and services include iPhone, Mac, iPad, AirPods, Apple TV, Apple Watch, Beats products, AppleCare, iCloud, digital content stores, streaming, and licensing services. The company was founded by Steven Paul Jobs, Ronald Gerald Wayne, and Stephen G. Wozniak in April 1976 and is headquartered in Cupertino, CA.
Es sind noch 14 Min. für die Script-Bearbeitung übrig
in dieser Minute
Koma-Indikator v2
Zu Favoriten hinzufügen
Auf Chart verwenden
0
0
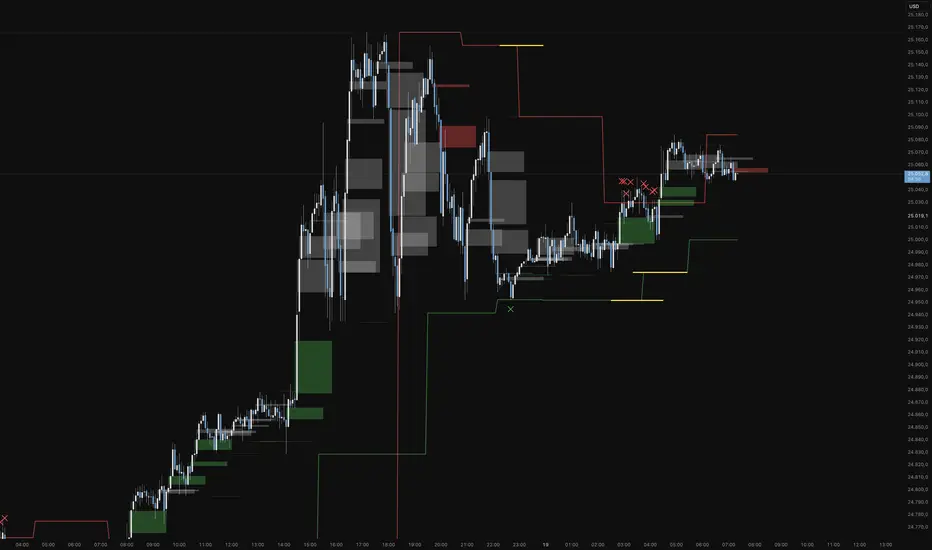
Functional Overview: Koma-Indikator V2
This indicator is a specialized analytical tool for Smart Money Concepts (SMC) trading. It is designed to automatically identify trend reversals, liquidity pools, and order flow shifts within the chart.
1. Liquidity Identification (BSL/SSL)
Major Range: The script automatically calculates significant highs and lows based on the "Major Lookback" period.
Buy-Side & Sell-Side Liquidity: These levels are plotted as red (BSL) and green (SSL) lines, serving as primary targets where the market often "hunts" for liquidity.
2. Sweep Detection (Liquidity Grabs)
The indicator detects when the price briefly exceeds a major high or low but closes back within the range.
Visuals: These potential reversal points are marked with an "X" icon above or below the candle (Sweep H/L).
3. Automated Market Structure Shifts (MSS)
The core logic tracks direction changes on two distinct levels:
Major MSS (Bold Yellow Line): Signals a significant trend reversal following a liquidity sweep. This is the primary confirmation for a new trend.
Minor MSS (Dotted Yellow Line): Highlights smaller structural breaks within a trend—ideal for aggressive "Sniper" entries on lower timeframes.
4. Dynamic Fair Value Gaps (FVG) & iFVGs
FVG Recognition: The indicator automatically draws boxes for bullish (green) and bearish (red) price imbalances.
Change in Delivery (iFVG): When a price candle closes through an existing FVG box, the box turns gray. This signals an Inverted FVG (iFVG), indicating that the order flow has officially shifted in the new direction.
5. Customization (Inputs)
Sensitivity: Users can adjust the lookback periods for both Trend (Major) and Entries (Minor) to suit different assets or timeframes.
Visual Hierarchy: All colors, line widths, and box lengths are configurable to maintain a clean and professional chart layout.
Trading Application:
By automating the "grunt work" of structural analysis, this tool allows you to focus on the trade execution:
Locate Liquidity: Identify BSL/SSL lines.
Watch for the Sweep: Look for the "X" marks.
Confirm the Shift: Wait for the yellow MSS lines.
Execute via Order Flow: Use the gray iFVG boxes as your Point of Interest (POI).
Geschütztes Skript
Dieses Script ist als Closed-Source veröffentlicht. Sie können es kostenlos und ohne Einschränkungen verwenden – erfahren Sie hier mehr.
Phantomas1
Haftungsausschluss
Die Informationen und Veröffentlichungen sind nicht als Finanz-, Anlage-, Handels- oder andere Arten von Ratschlägen oder Empfehlungen gedacht, die von TradingView bereitgestellt oder gebilligt werden, und stellen diese nicht dar. Lesen Sie mehr in den Nutzungsbedingungen.
Skript bearbeiten
Minimieren
Schließen
Koma-Indikator v2
Functional Overview: Koma-Indikator V2
This indicator is a specialized analytical tool for Smart Money Concepts (SMC) trading. It is designed to automatically identify trend reversals, liquidity pools, and order flow shifts within the chart.
1. Liquidity Identification (BSL/SSL)
Major Range: The script automatically calculates significant highs and lows based on the "Major Lookback" period.
Buy-Side & Sell-Side Liquidity: These levels are plotted as red (BSL) and green (SSL) lines, serving as primary targets where the market often "hunts" for liquidity.
2. Sweep Detection (Liquidity Grabs)
The indicator detects when the price briefly exceeds a major high or low but closes back within the range.
Visuals: These potential reversal points are marked with an "X" icon above or below the candle (Sweep H/L).
3. Automated Market Structure Shifts (MSS)
The core logic tracks direction changes on two distinct levels:
Major MSS (Bold Yellow Line): Signals a significant trend reversal following a liquidity sweep. This is the primary confirmation for a new trend.
Minor MSS (Dotted Yellow Line): Highlights smaller structural breaks within a trend—ideal for aggressive "Sniper" entries on lower timeframes.
4. Dynamic Fair Value Gaps (FVG) & iFVGs
FVG Recognition: The indicator automatically draws boxes for bullish (green) and bearish (red) price imbalances.
Change in Delivery (iFVG): When a price candle closes through an existing FVG box, the box turns gray. This signals an Inverted FVG (iFVG), indicating that the order flow has officially shifted in the new direction.
5. Customization (Inputs)
Sensitivity: Users can adjust the lookback periods for both Trend (Major) and Entries (Minor) to suit different assets or timeframes.
Visual Hierarchy: All colors, line widths, and box lengths are configurable to maintain a clean and professional chart layout.
Trading Application:
By automating the "grunt work" of structural analysis, this tool allows you to focus on the trade execution:
Locate Liquidity: Identify BSL/SSL lines.
Watch for the Sweep: Look for the "X" marks.
Confirm the Shift: Wait for the yellow MSS lines.
Execute via Order Flow: Use the gray iFVG boxes as your Point of Interest (POI).
Fortfahren
Entry / TP / SL Alert Bands (Simple & Stable)Entry / TP / SL Alert Bands – Invite-Only Version
Description
This tool plots customizable Entry, Take-Profit, and Stop-Loss reference levels, along with two alert bands derived as a percentage of the distance between Entry→TP and Entry→SL. The bands update immediately when inputs are adjusted and remain constant across the chart. This is useful for traders who want to visually monitor when price approaches key zones associated with their pre-defined trade plan.
Core Features
• Manual Entry, TP, and SL input fields
• Long or Short mode
• Upper alert band = a user-defined % of the distance toward TP
• Lower alert band = a user-defined % of the distance toward SL
• Optional visibility controls for Entry, TP, SL lines
• Alerts for:
– Price crossing the upper band
– Price crossing the lower band
– Price crossing either band
• Works on any symbol and any timeframe
• Alerts use TradingView’s built-in alertcondition() system
How It Works
The script computes the absolute distance between Entry→TP and Entry→SL, then applies user-defined percentages to determine where the alert bands should be drawn. If TP/SL are reversed relative to Entry for the selected direction, the relevant band may be invisible (e.g., negative or invalid distance). Proper TP/SL placement is required for intended use.
Notes
• This tool does not generate buy/sell signals.
• This tool does not provide financial advice.
• Proper risk management, independent decision-making, and verification of all settings are required.
⸻

ema200 filler═══════════════════════════════════════════════════════════════
TRADINGVIEW INDICATOR DESCRIPTION
═══════════════════════════════════════════════════════════════
TITLE: EMA 200 Filler - Visual Trend Indicator
SHORT DESCRIPTION:
Instantly see trend direction with color-coded shading between price and the 200 EMA. Green above = bullish, Red below = bearish.
═══════════════════════════════════════════════════════════════
MAIN DESCRIPTION
═══════════════════════════════════════════════════════════════
🎨 SEE THE TREND AT A GLANCE
This elegant indicator fills the space between price and the 200-period Exponential Moving Average (EMA) with color-coded shading, making trend direction instantly obvious without any analysis required.
✨ KEY FEATURES:
• Visual Trend Clarity - Green fill = bullish zone, Red fill = bearish zone
• EMA 200 Line - The institutional trader's favorite trend indicator
• Dynamic Shading - Fill automatically adjusts as price moves
• Clean Design - Semi-transparent fills won't clutter your chart
• Zero Configuration - Works perfectly right out of the box
• Universal Application - Works on any timeframe, any asset
📊 WHAT YOU SEE:
🟢 GREEN SHADED AREA
→ Price is ABOVE the 200 EMA
→ Bullish trend in effect
→ Look for LONG opportunities
🔴 RED SHADED AREA
→ Price is BELOW the 200 EMA
→ Bearish trend in effect
→ Look for SHORT opportunities
🔵 BLUE LINE = 200 EMA
→ The dividing line between bull and bear zones
→ Major support/resistance level
→ Institutional trend filter
💡 WHY THE 200 EMA MATTERS:
The 200-period EMA is one of the most widely watched technical indicators by:
✓ Institutional traders and hedge funds
✓ Day traders and swing traders
✓ Algorithmic trading systems
✓ Technical analysis professionals
When millions of traders watch the same level, it becomes a self-fulfilling prophecy - making it incredibly powerful for entries, exits, and stop placement.
🎯 TRADING APPLICATIONS:
✓ **Trend Filter** - Only take longs in green, shorts in red
✓ **Trend Confirmation** - Strong trends stay on one side for extended periods
✓ **Reversal Signals** - Watch for crossovers when price crosses the 200 EMA
✓ **Support/Resistance** - 200 EMA acts as dynamic support in uptrends, resistance in downtrends
✓ **Stay Out Zones** - Avoid trading when price chops around the 200 EMA (mixed colors)
📈 PERFECT FOR:
✓ Swing traders who need clear trend direction
✓ Day traders using the 200 EMA as a filter
✓ Beginners who want simple trend identification
✓ Multi-timeframe analysis (check higher timeframe trend)
✓ Anyone who wants cleaner charts with instant trend clarity
⚙️ WORKS WITH:
• All asset classes (stocks, forex, crypto, commodities, indices)
• All timeframes (1-minute to monthly charts)
• Combines perfectly with other indicators
• No special settings required - just add and trade
🌟 CLEAN & PROFESSIONAL:
• Semi-transparent fills (70% opacity) - won't hide candles or other indicators
• White price line for clear visibility
• Blue EMA line - industry standard color
• Minimalist design philosophy
🚀 INSTANT SETUP:
1. Add indicator to chart
2. Start trading with the trend
3. That's it - no configuration needed!
The simplest way to visualize trend direction. When you see green, think bullish. When you see red, think bearish. Trading doesn't get more straightforward than this.
═══════════════════════════════════════════════════════════════
CATEGORIES:
• Trend Analysis
• Moving Averages
• Overlays
TAGS:
ema, ema 200, moving average, trend indicator, trend filter, visual indicator, exponential moving average, 200 ema, trend following, color coded, bullish bearish
═══════════════════════════════════════════════════════════════
QUICK START GUIDE
═══════════════════════════════════════════════════════════════
🚀 QUICK START - EMA 200 Filler
──────────────────────────────────────────────────────────────
STEP 1: ADD TO CHART
──────────────────────────────────────────────────────────────
1. Open TradingView
2. Load any chart (stocks, forex, crypto - anything!)
3. Click "Indicators" button at top
4. Search: "EMA 200 Filler"
5. Click to add
You're done! No settings to adjust.
──────────────────────────────────────────────────────────────
STEP 2: UNDERSTAND THE COLORS
──────────────────────────────────────────────────────────────
The indicator fills the space between PRICE and the 200 EMA:
🟢 GREEN FILL = BULLISH ZONE
• Price is above the 200 EMA
• Uptrend is active
• Bias: Look for LONG entries only
🔴 RED FILL = BEARISH ZONE
• Price is below the 200 EMA
• Downtrend is active
• Bias: Look for SHORT entries only
🔵 BLUE LINE = 200 EMA
• The trend dividing line
• Acts as support in uptrends
• Acts as resistance in downtrends
──────────────────────────────────────────────────────────────
STEP 3: BASIC TRADING RULES
──────────────────────────────────────────────────────────────
📈 RULE #1: TRADE WITH THE COLOR
In GREEN zone:
→ Only look for LONG setups
→ Buy dips toward the 200 EMA
→ Avoid shorting against the trend
In RED zone:
→ Only look for SHORT setups
→ Sell rallies toward the 200 EMA
→ Avoid longing against the trend
──────────────────────────────────────────────────────────────
🎯 RULE #2: USE THE 200 EMA AS SUPPORT/RESISTANCE
In GREEN (uptrend):
→ 200 EMA acts as SUPPORT
→ Price bouncing off 200 EMA = buy opportunity
→ Price breaking BELOW 200 EMA = trend change warning
In RED (downtrend):
→ 200 EMA acts as RESISTANCE
→ Price rejecting at 200 EMA = sell opportunity
→ Price breaking ABOVE 200 EMA = trend change warning
──────────────────────────────────────────────────────────────
⚠️ RULE #3: AVOID THE CHOP ZONE
When price keeps crossing the 200 EMA (color changing frequently):
→ Market is RANGING, not trending
→ Stay out or reduce position size
→ Wait for a clear trend to establish
──────────────────────────────────────────────────────────────
STEP 4: TRADING STRATEGIES
──────────────────────────────────────────────────────────────
✅ STRATEGY #1: TREND FOLLOWING (PULLBACK ENTRIES)
Wait for GREEN zone (bullish trend):
1. Price pulls back toward the 200 EMA (blue line)
2. Look for bullish reversal candle near 200 EMA
3. Enter LONG
4. Stop below 200 EMA
5. Hold while in green zone
Example:
• Chart shows green shading
• Price dips to 200 EMA and bounces
• Enter long at bounce confirmation
• Stop 5-10 pips below 200 EMA
• Exit when price crosses back below 200 EMA (turns red)
──────────────────────────────────────────────────────────────
✅ STRATEGY #2: BREAKOUT TRADING (TREND CHANGE)
Watch for color change (crossover):
GREEN → RED (bearish reversal):
1. Price crosses below 200 EMA
2. Fill turns from green to red
3. Enter SHORT on next pullback to 200 EMA
4. Stop above 200 EMA
5. Ride the new downtrend
RED → GREEN (bullish reversal):
1. Price crosses above 200 EMA
2. Fill turns from red to green
3. Enter LONG on next pullback to 200 EMA
4. Stop below 200 EMA
5. Ride the new uptrend
──────────────────────────────────────────────────────────────
✅ STRATEGY #3: HIGHER TIMEFRAME FILTER
Use this indicator on a HIGHER timeframe as a filter:
Example for day trading:
• Add indicator to DAILY chart
• Check the color: Green or Red?
• Switch back to your trading timeframe (5m, 15m, etc.)
• Only take trades in the direction of daily trend
If daily = GREEN → Only take longs on lower timeframes
If daily = RED → Only take shorts on lower timeframes
This keeps you aligned with the bigger trend!
──────────────────────────────────────────────────────────────
STEP 5: REAL TRADING EXAMPLES
──────────────────────────────────────────────────────────────
📊 EXAMPLE #1: LONG ENTRY IN UPTREND
Chart: SPY on 1-hour timeframe
Indicator: Green fill (price above 200 EMA)
Setup:
• Price at 450, 200 EMA at 445
• Green shading shows bullish trend
• Price pulls back to 446 (near 200 EMA)
• Bullish hammer candle forms at 200 EMA
Trade:
→ Enter LONG at 446.50
→ Stop at 444.50 (below 200 EMA)
→ Target: Previous high at 452
→ Risk: 2 points | Reward: 5.50 points = 2.75:1 R/R
──────────────────────────────────────────────────────────────
📊 EXAMPLE #2: SHORT ENTRY IN DOWNTREND
Chart: EUR/USD on 4-hour timeframe
Indicator: Red fill (price below 200 EMA)
Setup:
• Price at 1.0850, 200 EMA at 1.0900
• Red shading shows bearish trend
• Price rallies to 1.0895 (near 200 EMA)
• Bearish rejection candle at 200 EMA
Trade:
→ Enter SHORT at 1.0890
→ Stop at 1.0910 (above 200 EMA)
→ Target: 1.0820 (recent support)
→ Risk: 20 pips | Reward: 70 pips = 3.5:1 R/R
──────────────────────────────────────────────────────────────
📊 EXAMPLE #3: AVOID THE CHOP
Chart: Bitcoin on 15-minute timeframe
Indicator: Color keeps changing (green/red/green/red)
Observation:
• Price crossed 200 EMA 4 times in 2 hours
• No clear trend established
• Whipsaw action
Action:
→ STAY OUT - wait for clear trend
→ Check higher timeframe for direction
→ Come back when one color dominates
──────────────────────────────────────────────────────────────
STEP 6: PRO TIPS
──────────────────────────────────────────────────────────────
💡 **Combine with Price Action**
Don't just enter because it's green - wait for bullish candle patterns (hammer, engulfing, etc.) at the 200 EMA for high-probability setups.
💡 **Respect the 200 EMA**
The longer price stays on one side, the stronger that side becomes. A stock green for months has strong bullish momentum.
💡 **Watch Volume at Crossovers**
When price crosses the 200 EMA with HIGH volume = strong signal
Low volume crossover = might be false breakout
💡 **Use Multiple Timeframes**
• Daily chart = overall trend direction
• 4H chart = swing trade setups
• 1H chart = day trade entries
Always align smaller timeframe trades with larger timeframe color!
💡 **Strongest Setups = Clean Trends**
Best trades happen when:
• Chart stays ONE color for extended period
• Price respects 200 EMA as support/resistance
• No frequent crossovers
──────────────────────────────────────────────────────────────
COMMON QUESTIONS
──────────────────────────────────────────────────────────────
❓ "What if price crosses the 200 EMA frequently?"
→ That's a ranging market. Stay out or trade smaller size. Wait for a clear trend.
❓ "Can I change the colors?"
→ Not in this version, but green/red is universal and intuitive.
❓ "Does this work on all timeframes?"
→ Yes! But longer timeframes (4H, Daily) tend to give cleaner signals.
❓ "Should I always use the 200 EMA?"
→ The 200 is the institutional standard. Stick with it for consistency.
❓ "What about the 50 or 20 EMA?"
→ You can add those separately. This indicator focuses on the proven 200 EMA.
──────────────────────────────────────────────────────────────
THE GOLDEN RULE
──────────────────────────────────────────────────────────────
🟢 GREEN = GO LONG (or stay long)
🔴 RED = GO SHORT (or stay short)
🔄 FREQUENT CHANGES = STAY OUT
It's that simple. The trend is your friend - this indicator just makes it impossible to miss!
──────────────────────────────────────────────────────────────
Happy Trading! 📈
──────────────────────────────────────────────────────────────

FX Session High/Low Bands - Last 5 EST DaysFX Session High/Low Bands – Last 5 EST Days is a powerful market-structure indicator that automatically plots the true high and low ranges of the Asian, London, and New York trading sessions — without clutter or manual marking.
Each session’s high and low are calculated in real time using New York (EST) session boundaries, then projected as clean dotted bands across the chart. Only the last five trading days are displayed, keeping your chart focused on the most relevant liquidity and reaction levels.
These session bands help traders instantly identify:
• Key intraday support and resistance
• Liquidity highs and lows targeted by later sessions
• Range expansion vs compression
• High-probability breakout, fade, and continuation zones
Color-coded session levels make it easy to distinguish between Asia, London, and New York at a glance, while automatic session detection ensures accuracy across all timeframes.
Ideal for forex and index traders who rely on session-based price behavior, institutional liquidity concepts, and repeatable intraday structure.
Stop guessing where the session levels are.
Trade with precision using the levels the market actually respects.

CE-PE-S/RThis Indicator Purely we design for option traders to do in intraday, here you can view both CE & PE Support & Resistance.
You have to chose same strike CE & PE
Yellow Line will give as a pivot Point
Red Line are we consider as a Target or Resistance
Green Line are we Consider as a Sellers Target or Support Line.
Above Yellow we consider Strong Up.


Vel-SIGThis pine script will give you an idea about the markets are in trending or rangebound. based on this you can take your decision whether you can buy or sell or right option.

Explosive Candle Detector [CodeAlchemyLab]Explosive Candle Detector
This indicator identifies potential high-momentum trading opportunities by detecting explosive candles that form after consolidation periods (base candles).
How It Works:
The indicator uses a two-candle pattern system:
Base Candle (Boring): A consolidation candle where the wicks are larger than the body, indicating indecision and potential accumulation/distribution by smart money. This represents a compression phase where price is being absorbed.
Explosive Candle: A momentum candle that appears immediately after a base candle, with a size at least 50% larger than the base candle. This represents an expansion phase where price breaks out with strong directional movement.
Features:
• Detects bullish explosive candles (green markers below candle)
• Detects bearish explosive candles (red markers above candle)
• Highlights base candles with background color
• Customizable explosive threshold (default: 50% size increase)
• Clean visual signals for easy pattern recognition
Trading Applications:
• Supply and Demand zone identification
• Breakout confirmation signals
• Momentum trade entries
• Order block detection
• Smart money accumulation/distribution phases
Best Used With:
Support/resistance levels, trend analysis, and volume confirmation for optimal trade setups.
Parameter:
Boring Candle Parameters:
1. Min wick ratio (0.6 = 60%): The total wicks (upper + lower) must be at least 60% of the candle's total range. Higher values = more wick required, meaning the candle is more "indecisive" with long wicks.
2. Max body ratio (0.4 = 40%): The body must be at most 40% of the candle's total range. Lower values = smaller body required, confirming the candle is mostly wicks with a small body.
Example: If candle range is 100 pips, wicks must be ≥60 pips and body must be ≤40 pips.
──────────────────────────────────────────
Explosive Candle Parameters:
3. Min size vs Boring (1.5 = 150%): The explosive candle must be at least 1.5x (or 50% bigger) than the boring candle's range. If boring candle is 100 pips, explosive must be ≥150 pips.
4. Min body ratio (0.5 = 50%): The explosive candle's body must be at least 50% of its total range. This ensures it's a strong directional move with a large body, not just wicks.
──────────────────────────────────────────
In Simple Terms:
• Boring candle = Big wicks, small body (consolidation/indecision)
• Explosive candle = Big body, much larger than boring candle (strong directional move)

[ASREMON]_251219_3CommasA Christmas carol is about joy, love, and hope during Christmas.
It celebrates family, kindness, and being together.
The songs often talk about peace and goodwill to others.
They remind people to give, forgive, and share warmth.
Overall, they express the spirit of Christmas happiness.
