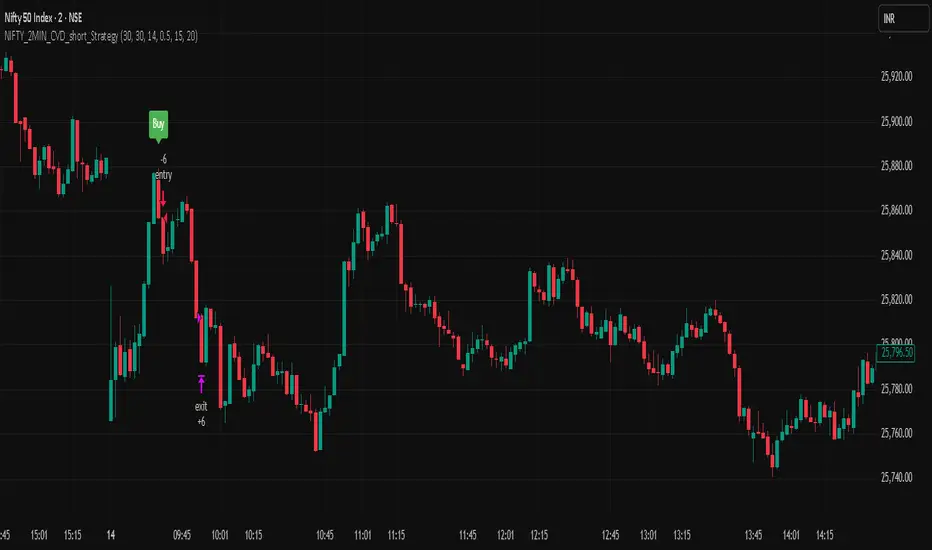
NIFTY_2MIN_CVD_short_StrategySummary
This strategy is an intraday system designed for the Nifty index on a 2-minute timeframe, focusing exclusively on identifying high-probability short (sell) entries. It utilizes a combination of rapid price action and Cumulative Volume Delta (CVD) to detect "Buying Absorption" at local peaks.
Concept & Core Logic
The strategy is engineered to identify "Inverted V-shaped" reversals where aggressive buying pressure is exhausted and absorbed by large-scale limit orders from sellers.
Price Action Trigger: The strategy looks for a specific two-part sequence:
Sudden Bullish Movement: A rapid upward move that often traps late buyers or triggers short-covering.
Sudden Reversal: Immediately followed by a strong, high-momentum bearish (red) candle, signaling a swift rejection of the higher prices.
CVD Absorption Filter: To confirm the validity of the reversal, the strategy analyzes the Cumulative Volume Delta (CVD). It identifies instances where the relative movement of the CVD is significantly higher than the corresponding price movement. This specific divergence highlights "Buying Absorption"—a market condition where aggressive market buy orders are being filled by passive limit sell orders, preventing further price appreciation and creating a heavy ceiling for the reversal.
Risk Management
To maintain a disciplined approach, the strategy employs fixed exit parameters based on the underlying Nifty price:
Take Profit: 25 points.
Stop Loss: 30 points.
Intended Use
This tool is intended for traders who study mechanical, rule-based systems and order flow dynamics. It provides a structured framework for observing how volume delta divergence (CVD) and rapid price rejections interact at potential market turning points.
Disclaimer: This script is for educational and informational purposes only. It is not financial advice. All trading involves risk, and past performance is not indicative of future results. Please conduct your own research and backtesting before making any trading decisions.
Patrones de gráficos
ORB FX REPLAY - FINAL SAFEHere is the description in English, written to sound professional and meet all the requirements for publishing on TradingView:
Script Description:
Title: ORB Strategy Backtest Pro - Ultra Compatibility
Description: This is an Opening Range Breakout (ORB) strategy specifically designed for professional backtesting. It is optimized to run smoothly on external platforms like FX Replay and TradingView's replay mode.
Key Features:
Custom Session: Automatically calculates the High and Low of a specific time window (default: 10:00 - 10:15 Bucharest/GMT+2).
Impulse Confirmation: Features a "Min Impulse" filter to ensure entries happen on strong momentum, avoiding "fake-outs" near the range boundaries.
Hard Target Management: Designed for "Set & Forget" backtesting. Once a trade is triggered, the script tracks it until it hits either the Stop Loss (SL) or the final Take Profit 3 (TP3).
Visual Projections: Draws clear, real-time lines for Entry, SL, and TP3 on the chart for easy visual tracking.
Automated Statistics: Includes a dynamic label system that tracks Total Trades, Win Count, and Loss Count based on the TP3/SL logic.
Optimized Code: Built using Pine Script v5 with a focus on stability and compatibility, avoiding complex tables that often cause errors on external engines.

NIFTY_2MIN_CVD_Absorption_long_StrategySummary
This strategy is an intraday system designed for the Nifty index on a 2-minute timeframe, focusing on high-probability reversal entries. It utilizes price action patterns and Cumulative Volume Delta (CVD) to identify market turning points.
Long Strategy: Concept & Core Logic
The long strategy is engineered to identify "V-shaped" recoveries where selling pressure is exhausted and absorbed by aggressive buyers.
Price Action Trigger: The strategy looks for a specific two-part sequence:
Sudden Bearish Movement: A rapid downward move representing a final flush of sellers.
Sudden Reversal: Immediately followed by a strong, high-momentum bullish (green) candle, indicating a swift change in market sentiment.
CVD Absorption Filter: To confirm the validity of the reversal, the strategy analyzes the Cumulative Volume Delta (CVD). It specifically looks for instances where the relative movement of CVD is significantly higher than the corresponding price movement. This divergence suggests "selling absorption"—where large buy orders are soaking up sell-side liquidity, creating a floor for the reversal.
Risk Management (Long)
The strategy utilizes fixed exit parameters based on the underlying Nifty price points:
Take Profit: 25 points.
Stop Loss: 30 points.
Intended Use
This tool is intended for traders who study mechanical, rule-based systems. It demonstrates how price action, volume delta divergence (CVD), and trend filters can be combined to time entries in both trending and reversal market conditions.
Disclaimer: This script is for educational and informational purposes only. It is not financial advice. All trading involves risk, and past performance is not indicative of future results. Please conduct your own research and backtesting before making any trading decisions.

Nifty_2MIN_Rangereversal_Short_StrategySummary
This strategy is an intraday trend-following system designed for the Nifty index on a 2-minute timeframe, focusing exclusively on short (sell) entries. It is engineered to identify failed bounces within established bearish trends.
Concept & Core Logic
The strategy uses a multi-layered approach to confirm downward momentum before triggering an entry:
Trend Confirmation: The script analyzes the slope and positioning of the 20-period and 200-period Exponential Moving Averages (EMA). Short signals are only valid when the EMA configuration confirms a prevailing bearish trend.
Retracement Zone Filtering: To optimize entry pricing, the strategy monitors the daily price range. It looks for the market to be within the 35% to 75% range of the day's movement, specifically identifying a temporary upward "relief rally" or bounce after a significant fall.
Candlestick Trigger: The execution occurs when a specific bearish reversal pattern appears during the relief rally:
Two consecutive bullish candles (representing the temporary bounce).
Followed by a strong, high-momentum bearish candle (signaling the resumption of the primary downtrend).
Risk Management
The strategy utilizes fixed exit parameters based on the underlying Nifty price points:
Take Profit: 28 points.
Stop Loss: 30 points.
Intended Use
This tool is intended for traders who study mechanical, rule-based systems. It demonstrates how moving average trends can be combined with range analysis and price action sequences to time entries during market retracements.
Disclaimer: This script is for educational and informational purposes only. It is not financial advice. All trading involves risk, and past performance is not indicative of future results. Please conduct your own research and backtesting before making any trading decisions.

Nifty_2MIN_ Rangereversal_Long _StrategySummary
This strategy is an intraday trend-following system designed for the Nifty index on a 2-minute timeframe. It focuses exclusively on long entries, seeking to identify high-probability recovery points within an established uptrend.
Concept & Core Logic
The strategy identifies entries based on a confluence of trend direction, price recovery levels, and specific candlestick patterns:
Trend Confirmation: The script utilizes the slope and positioning of the 20-period and 200-period Exponential Moving Averages (EMA). A long signal is only considered when the trend is determined to be positive, ensuring trades align with the broader market momentum.
Recovery Zone Filtering: To avoid buying at local peaks, the strategy filters for entries that occur when the market has retraced but is showing signs of recovery. Specifically, it looks for price to be within the 35% to 75% recovery range relative to the day's high.
Candlestick Trigger: The actual entry trigger is a "Bullish Reversal" sequence:
Two consecutive bearish candles (representing a minor pullback).
Followed immediately by a strong bullish candle (representing the resumption of strength).
Risk Management
The strategy uses fixed point-based exits to maintain a disciplined approach:
Take Profit: 30 points (underlying Nifty price).
Stop Loss: 35 points (underlying Nifty price).
Intended Use
This script is designed for traders interested in mechanical trend-following systems. It provides a structured way to observe how moving average slopes and specific price action sequences interact during intraday recoveries.
Disclaimer: This script is for educational and informational purposes only. It is not financial advice. All trading involves risk, and past performance is not indicative of future results. Please conduct your own research and backtesting before making any trading decisions.

NIFTY_2min_FVG_sell_StrategyThis strategy is designed for scalping Nifty on a 2-minute chart, focusing exclusively on short entries. The script's purpose is to identify and act on specific bearish patterns based on volume analysis and price action.
Concept & Core Logic
The strategy operates on a two-stage confirmation process:
Volume Absorption: The initial condition seeks to identify potential bearish movements by detecting signs of buying pressure being absorbed by sellers. This suggests that a upward move may be losing momentum.
Fair Value Gap (FVG) Confirmation: After a volume absorption signal, the strategy waits for a Bearish Fair Value Gap (FVG) to appear. A short entry signal is generated only after a candle closes below the FVG zone, serving as confirmation of bearish intent.
Risk Management
The strategy employs a fixed take profit and stop loss for each trade, based on the Nifty underlying price:
Take Profit: The exit signal is triggered when a trade reaches a 30-point profit.
Stop Loss: The exit signal is triggered when a trade reaches a 35-point loss.
Intended Use
This tool is intended for traders who:
Utilize mechanical, rule-based systems for intraday trading and scalping.
Are interested in studying a structured approach that combines volume analysis with price action inefficiencies like Fair Value Gaps.

ZNOX Spot Trading Signalsthis is build for znox to give the user batter view not correct 100% and following it under your risk

HMA Pivot Buy/Sell (only) + AlertsThis Pine Script is a lightweight indicator that plots only HMA-based pivot Buy/Sell signals and provides alert conditions for them.
What it does
Calculates a Hull Moving Average (HMA) using either:
a dynamic length based on the chart timeframe, or
a custom user-defined length.
Detects HMA pivot points (local turning points):
Buy signal when the HMA forms a local minimum (trend turns up).
Sell signal when the HMA forms a local maximum (trend turns down).
Optionally plots the HMA line and prints only the Buy/Sell markers on the chart (no extra arrows/emoji/labels from other systems).
Adds TradingView alerts for Buy, Sell, and combined Buy/Sell events.
Signal logic
Buy (HMA Pivot Low) triggers when:
HMA > HMA and HMA < HMA
Meaning: the HMA was falling, formed a bottom, and has started rising.
Sell (HMA Pivot High) triggers when:
HMA < HMA and HMA > HMA
Meaning: the HMA was rising, formed a top, and has started falling.
Inputs
Source: price source used to compute HMA (default: close).
Use Custom HMA Length: enables manual override.
Custom HMA Length: manual HMA period (default: 55).
Alerts: only on bar close:
If enabled, alerts fire only after the bar closes (confirmed signals).
If disabled, alerts can fire intrabar (faster but less stable).
Draw signal on pivot bar (offset -1):
If enabled, markers are drawn on the pivot bar (one bar back) using offset = -1.
If disabled, markers are drawn on the confirmation bar (no offset).
Show HMA line: toggles display of the HMA line.
Alerts available
BUY (HMA Pivot) — triggers on Buy signal.
SELL (HMA Pivot) — triggers on Sell signal.
BUY/SELL (HMA Pivot) — triggers on either Buy or Sell.
Each alert message includes ticker, timeframe, and close price via placeholders:
{{ticker}}, {{interval}}, {{close}}.


Multi-Ticker Overlay V6 [SPY/QQQ/ES]Key Improvements in this Version:Triple Ticker Support: You now have three distinct sections in the settings (SPY, QQQ, and ES1!). You can toggle them on or off individually.Flexible Symbols: While I defaulted them to SPY, QQQ, and ES, you can use the Ticker Symbol input to change them to anything (e.g., change ES to "DIA" to see Dow Jones levels).Decimal Increments: I changed the increment to a float. You can now set SPY to 1.0 and QQQ to 0.5 or 5.0 depending on how much "clutter" you want.Individual Aesthetics:Colors: Each ticker has its own color picker.Labels: Labels are prefixed with the symbol name (e.g., "QQQ 450") so you don't get confused about which line belongs to which ticker.Smart Ratio Engine: All three tickers respect the "Freeze at 16:00" rule if you turn it on, ensuring the levels stay mathematically accurate based on the market close.Note on Performance: Because this script draws many lines (up to 3 tickers $\times$ 21 lines each), I set the extend to none. The lines will appear as short segments to the right of the current price to keep your chart clean.

ABC Risk Management SystemOverview
This script is a comprehensive execution engine designed for high-frequency momentum trading (optimized for MES/ES Futures). It solves the problem of "grade inflation" in trading by strictly categorizing setups based on Multi-Timeframe (MTF) alignment and volatility.
How it Works
The script utilizes a 5-Minute Bias Engine to filter a 1-Minute Execution Chart. It relies on the relationship between the CCI (Commodity Channel Index) and its 20-period SMA using Typical Price (HLC3).
The Grading Hierarchy
Grade A+ (The Trend Follower): Triggered when the 5m Trend is strong (ADX > 25) and 1m momentum is perfectly aligned.
Grade B (The Momentum Burst): Triggered in "Lazy Markets" (5m ADX < 25). The script automatically raises the entry requirement to a 140 CCI burst to filter out noise.
Grade C (The Mean Reversion): Triggered when 1m internals (ADX/DI/CCI) are powerful enough to trade against the 5m Bias.
Key Indicators Included
T3 Pulse Lead: A specialized, color-coded trailing line used for dynamic stop-loss management.
Price-Locked Labels: Signals are pinned to the High/Low of the specific candle to provide exact price levels for entry.
🚀 Release Notes: Version 3.0 (The "ABC" Update)
New Features & Logic Fixes:
Strict Binary Bias: Removed all level-based filters for the HTF trend. The bias is now determined solely by the crossover of the 5m CCI and its SMA.
Bullish: 5m CCI > 5m SMA (regardless of positive/negative value).
Bearish: 5m CCI < 5m SMA.
Adaptive ADX Scaling: If 5m ADX falls below 25, the 1m CCI trigger is automatically moved from 100 to 140 to compensate for the lack of trend strength.
Visual Overhaul: Replaced generic shapes with Price-Locked Text Labels.
Longs: Labels appear below the candle (Green/Lime/Purple).
Shorts: Labels appear above the candle (Red/Maroon/Orange).
T3 Pulse Integration: Added the T3 Pulse Lead (8-period) directly into the overlay to facilitate the "T3 Trailing Stop" methodology.
Typical Price Standard: Standardized all calculations to HLC3 to align with professional S&P 500 momentum standards.
How to Setup the Chart:
Apply script to a 1-Minute Chart.
Ensure your 5-minute CCI settings in your separate indicator match (20 SMA, HLC3 Source).
Follow the A/B/C Risk Management Protocol (0.5% / 0.25% / 0.10% risk)

V3 Valentini Pro Scalper [Dashboard]Gemini 3.0 pro's take on Fabio Valentini's world #1 strategy scalp 12/19/2025

ML Adaptive SuperTrend Strategy [trade_crush]# ML Adaptive SuperTrend Strategy - User Guide
## Introduction
The **ML Adaptive SuperTrend Strategy** is a sophisticated trading tool that combines traditional trend-following logic with **Machine Learning (K-Means Clustering)** to dynamically adapt to market volatility. Unlike standard SuperTrend indicators that use a fixed ATR, this strategy analyzes historical volatility to categorize the current market into distinct clusters, providing more precise entries and exits.
>
> **Special Thanks:** This strategy is based on the innovative work of **AlgoAlpha**. You can explore their extensive library of high-quality indicators and strategies on TradingView: (www.tradingview.com).
---
## Machine Learning Engine (K-Means)
The core of this strategy is its ability to "learn" from recent market behavior.
- **K-Means Clustering**: The script takes the last $N$ bars of ATR data and runs an iterative clustering algorithm to find three "centroids" representing **High**, **Medium**, and **Low** volatility.
- **Adaptive ATR**: Based on the current volatility, the strategy selects the nearest centroid to use as the ATR value for the SuperTrend calculation. This ensures the trailing stop tightens during low volatility and widens during high volatility to avoid "noise".
---
## Key Features
### 1. Non-Repainting Signals
- **Confirm Signals**: When enabled, signals are only triggered after a bar closes. This ensures that the arrows and entries you see on the chart are permanent and reliable for backtesting.
### 2. Intelligent Risk Management
- **Multiple SL/TP Types**: Choose between **Percentage** based stops or **ATR** based stops for both Stop Loss and Take Profit.
- **Trailing Stop Loss (TSL)**:
- Supports both Percentage and ATR modes.
- **Activation Offset**: Only activates the trailing mechanism after the price has moved a certain percentage in your favor, protecting early-stage trades.
### 3. Risk-Based Position Sizing
- **Dynamic Quantity**: If enabled, the strategy automatically calculates the trade size based on your **Risk % Per Trade** and the distance to your **Stop Loss**. This ensures you never lose more than your defined risk on a single trade.
---
## User Input Guide
### SuperTrend & ML Settings
- **ATR Length**: The window used to calculate market volatility.
- **SuperTrend Factor**: The multiplier that determines the distance of the trailing stop from the price.
- **Use ML Adaptive ATR**: Toggle between the ML-enhanced logic and standard ATR.
- **Training Data Length**: How many historical bars the ML engine analyzes to find clusters.
### Risk Management
- **Stop Loss Type**: Set to Percentage, ATR, or None.
- **TS Activation Offset**: The profit buffer required before the trailing stop starts following the price.
- **Use Risk-Based Sizing**: Toggle this to let the script manage your position size automatically.
---
## How to Trade with This Strategy
1. **Monitor the Dashboard**: Check the top-right table to see which volatility cluster the market is currently in.
2. **Observe the Fills**: The adaptive fills (green/red) visualize the "breathing room" the strategy is giving the price.
3. **Execution**: The strategy enters on "ML Bullish" (Triangle Up) and "ML Bearish" (Triangle Down) signals.
4. **Exits**: The script will automatically exit based on your SL, TP, or Trailing Stop settings.
---
## Credits
Original Concept: **AlgoAlpha**
Strategy Conversion & Enhancements: **Antigravity AI**


GardFx - Fusion Pro FREE TrialFusion Pro - by GardFx
This script is a specialized session-trading system designed to capitalize on the Opening Range Breakout (ORB) by utilizing Fair Value Gaps (FVG) as entry confirmation zones. Unlike standard breakout indicators that signal immediately upon a range break, this system waits for a price retest (mitigation) of specific imbalances created during the breakout move.
Core Concept
The strategy operates on a three-step logic sequence:
Define the Range: It establishes the High and Low of the opening session (London or New York).
Identify Imbalance: Upon a breakout of this range, the script scans for the creation of a Fair Value Gap (FVG) on the 1-minute timeframe.
Confirm Entry: It waits for price to retrace into the FVG (mitigation) and looks for specific candle confirmation patterns before generating a signal.
Detailed Methodology
1. The Opening Range (ORB)
The script monitors the first 15 minutes of the session (configurable).
High Line: The highest price reached during the first 15m.
Low Line: The lowest price reached during the first 15m.
Breakout: A breakout is validated when a candle closes outside of this defined range.
2. Fair Value Gap (FVG) Detection
Shutterstock
Not all breakouts are valid. This script filters for momentum by requiring an FVG to form immediately following the breakout.
Bullish FVG: Defined when the Low of Candle 1 is higher than the High of Candle 3.
Bearish FVG: Defined when the High of Candle 1 is lower than the Low of Candle 3.
Note: If an FVG is not formed shortly after the breakout, the setup is considered low-probability and ignored.
3. Entry Confirmation Models Once an FVG is identified and price returns to mitigate it, the script offers three confirmation modes:
Instant (First Touch): Aggressive entry immediately when price touches the FVG box.
Reversal Close: Waits for a candle to close in the direction of the trend after touching the FVG (e.g., a green candle close after dipping into a bullish FVG).
Engulfing Candle: The most conservative filter. Requires a full engulfing candle pattern occurring within or bouncing off the FVG.
4. Advanced Filters To reduce false signals during choppy markets, two optional filters are included:
Volume Filter: Requires the breakout candle's volume to be higher than its Moving Average (multiplied by a user-defined factor).
Higher Timeframe (HTF) Trend: Checks the trend on a higher timeframe (e.g., 1H or 4H).
Logic: If the HTF Close is > HTF EMA 50, only Buy signals are permitted. If HTF Close < HTF EMA 50, only Sell signals are permitted.
5. Risk Management The script includes an automated Risk/Reward calculator.
Stop Loss (SL): Placed at the invalidation point of the FVG structure, plus an optional ATR buffer to account for volatility.
Take Profit (TP): Calculated based on a user-defined Risk:Reward ratio (e.g., 1:2) relative to the Stop Loss distance.
Dashboard A multi-timeframe dashboard is displayed to provide a "Glance View" of market bias across the Daily, 4H, 1H, and 15M timeframes, ensuring trades are aligned with macro momentum.
3 hours ago
Release Notes
🚀 GardFx - Fusion Pro V2: The Ultimate ORB & ICT Suite
Welcome to Version 2.0 of Fusion Pro. This update transforms the indicator from a simple breakout tool into a complete institutional trading system. We have integrated Multi-Timeframe (MTF) logic, Candlestick Pattern recognition, and Smart Exit management to filter out noise and catch high-probability moves.
🔥 NEW FEATURES IN V2:
1. 🧠 Smart MTF Bias & Voting System
No more guessing the trend. The script now checks Daily, 4H, 1H, and 15m timeframes.
Voting Logic: A trade is only signaled if the higher timeframes agree (e.g., 2 out of 3 votes).
Visuals: The dashboard displays the live bias for every timeframe.
2. 🎯 Advanced Entry Confirmations We have added specific trigger patterns to reduce fake-outs. You can now choose your entry style:
🦄 Unicorn Setup: ORB Level + FVG overlap.
🕯️ Candlestick Patterns: Pinbar, Engulfing, Tweezer Tops/Bottoms, and Inside Bar.
📉 FVG 50%: Wait for price to retrace to the 50% equilibrium of the gap before entering.
3. 🛡️ Entry Validation Modes Control exactly when the entry label fires:
Instant: Enters immediately upon touch.
Candle Close: Waits for the candle to close in your direction.
Break of High/Low: Places a pending order at the wick; only enters if momentum breaks that level.
Wait for MSS: Waits for a Market Structure Shift (local high/low break).
4. 💰 Dynamic Smart Exit (Secure TP)
A new Volume-Based Exit Manager detects sudden momentum shifts or volume spikes against your position.
It prints a "Secure TP" label to help you bank profits before a reversal occurs, even if the fixed TP hasn't been hit.
5. 📊 Enhanced Dashboard & Stats
Tracks Win/Loss rates separately for Asia, London, and New York sessions.
Weekly and Daily stats reset automatically.
Fully customizable size and position.
6. ⚡ Automated UK Sessions
Built-in timings for Asia, London, and New York based on UTC (London) time. No more timezone conversion headaches.

S_Sigma HTF Candles (UTC Draw / NY Labels)🕯️ S_Sigma HTF Candles (UTC Draw / NY Labels)
Multi-Timeframe Overlay with Session Labels & Imbalances
S_Sigma HTF Candles is a powerful, non-repainting overlay indicator that allows you to visualize up to 6 different Higher Timeframes (HTF) directly on your current chart.
Designed specifically for traders who need context without switching tabs, this tool draws accurate HTF candles using UTC time (standard for Crypto) while labeling them with New York Timezone data (standard for Stocks/Forex). It also detects Fair Value Gaps (FVG) and Volume Imbalances automatically.
🌟 Key Features
📊 6 Independent HTF Slots
Configure up to 6 different timeframes simultaneously (e.g., 15m, 1H, 4H, 1D, 1W). Each slot is customizable and can be toggled on/off independently.
🌍 UTC Drawing + NY Labels (The "Sigma" Edge)
Drawing: Candles are calculated strictly using UTC time to ensure wicks and bodies match exchange data (perfect for BTC/ETH).
Labels: Day of the Week (Mon/Tue/Wed) and Time labels are converted to America/New_York time. Never get confused by candle closes again.
#HTF Countdown Timer**
See exactly how much time is left until the Higher Timeframe candle closes. Essential for timing entries at the "Candle Close."
📈 Smart Imbalance Detection
FVG (Fair Value Gaps): Automatically highlights 3-candle reversal gaps.
VI (Volume Imbalance): Highlights wicks that pierce previous bodies.
🏗️ Custom Session Starts
Don't like the standard Daily candle? Force the Daily candle to open at 08:30 NY or 09:30 NY (Market Open) instead of Midnight UTC.
⚙️ Customization Options
Visuals: Full control over Bull/Bear colors, borders, wicks, and opacity.
Layout: Adjust padding, width, and spacing between timeframes to prevent overlap.
Trace Lines: Optional lines tracing the Open, High, Low, and Close of the forming HTF candle.
Labels: Toggle HTF names, Timers, and Day-of-Week labels on/off.
💡 How to Use
Add to Chart: The indicator draws candles to the right of the current price (offset) to keep your chart clean.
Check Alignment: Ensure the "Daily Name" matches your expected market session (NY Time).
Spot Entries: Look for price entering an FVG (Gray box) or hitting a HTF Support/Resistance level (Wick of the HTF candle).
Time Entries: Wait for the Timer to hit 00:00 for a confirmed candle close.
Perfect for: Smart Money Concepts (SMC), ICT, Wyckoff, and Multi-Timeframe Analysis.

SMA 20/50/100/200Simple Moving Averages indicator plotting the 20, 50, 100, and 200 SMAs based on the **active chart timeframe**. Designed to adapt dynamically as you change timeframes, it helps visualize short-, medium-, and long-term trend structure, momentum shifts, and dynamic support and resistance. Color-coded for clarity with consistent line thickness for clean, readable trend analysis.

QuantCrawler 5m ORB Pro - Opening Range with Confluence FiltersThis indicator captures the 5-minute Opening Range and generates entry signals using a breakout-then-retest methodology. It includes optional confluence filters to refine entries and reduce false signals.
HOW IT WORKS
1. Captures the 5-minute Opening Range (high, low, midpoint) at your selected session open
2. Waits for price to break beyond OR high or low by your defined distance
3. After breakout, monitors for price to retest the OR midpoint
4. Signals LONG after bullish breakout + midpoint retest
5. Signals SHORT after bearish breakout + midpoint retest
6. Marks invalidated signals with (X) if price breaks through the opposite side
PRE-CONFIGURED SESSIONS
- NYSE - 9:30-9:35 ET
- CME - 8:30-8:35 CT
- London - 3:00-3:05 ET
- Asia - 7:00-7:05 PM ET
- Custom - Define your own session times and timezone
BREAKOUT DISTANCE OPTIONS
Choose between fixed points or percentage-based breakout threshold. Percentage mode automatically scales to the instrument price.
CONFLUENCE FILTERS
Optional filters to add confirmation before signals fire:
- VWAP - Long requires price above VWAP, short requires below
- EMA Slope - Confirms trend direction using 20-period EMA
- Volume - Requires relative volume above 1.5x average
- FVG - Requires a Fair Value Gap supporting trade direction
- ATR - Filters Opening Ranges that are abnormally small or large relative to ATR
When filters block a valid setup, the indicator displays a BLOCKED label so you can see what you missed and why.
STATUS BOX
Real-time display showing:
- Current trade state (Building OR, Watching, Awaiting Retest, Long/Short Active)
- OR High, Low, and Midpoint levels
- Active filters and block reasons
ALERTS
Built-in alerts for Long Entry, Short Entry, or Any Entry.

EMA 9/21/50 BandEMA band indicator plotting the 9, 21, and 50 exponential moving averages based on the **active chart timeframe**. Designed to adapt dynamically as you change timeframes, helping visualize short-term momentum, trend alignment, and dynamic support and resistance. Useful for identifying trend strength, pullbacks, and momentum shifts without anchoring to a fixed higher timeframe.

QuantCrawler ORB Break & Retest 15m - Opening Range StrategyThis indicator automates the 15-minute Opening Range Breakout and Retest strategy. It captures the high, low, and midpoint of the first 15-minute candle, then monitors for confirmed breakouts followed by midpoint retests to generate entry signals.
HOW IT WORKS
1. Captures the high, low, and midpoint of the first 15-minute candle (default 8:00-8:15 premarket)
2. Waits for price to close beyond the OR high or low by your specified breakout distance
3. After breakout confirmation, monitors for price to pull back and touch the midpoint
4. Signals LONG after bullish breakout + midpoint retest
5. Signals SHORT after bearish breakout + midpoint retest
6. Resets after each signal allowing multiple setups per session
WHY 15-MINUTE ORB
The 15-minute Opening Range captures more price action than a 5-minute OR, often providing stronger support/resistance levels. The 8:00 AM default captures premarket activity before the 9:30 open, giving you levels established before the crowd arrives.
WHY BREAKOUT + RETEST
Entering on the initial breakout often results in chop and false signals. This indicator requires confirmation - price must first prove direction by closing beyond the breakout distance, then offer a pullback entry at the midpoint. This filters out many failed breakouts.
SETTINGS
- Breakout Distance - Points beyond OR zone required to confirm breakout
- Timezone - Select your market timezone
- Opening Range Time - Customizable (default 8:00-8:15)
- Session End Time - When to stop monitoring (default 4:00 PM)
VISUAL OUTPUT
- Green line - OR High
- Red line - OR Low
- Orange dotted line - OR Midpoint
- Status box displays current state (Watching, Active, Closed)
ALERTS
Built-in alerts for Long Entry, Short Entry, or Any Entry.
Works on any timeframe chart. The indicator pulls 15-minute data automatically using request.security().

Daily SMA 20/50/100/200Simple Moving Averages indicator displaying four commonly used trend lines on the price chart. Plots the 20, 50, 100, and 200 period SMAs to help identify short-, medium-, and long-term trend direction, dynamic support and resistance, and overall market structure. Color-coded for clarity: 20 SMA in green, 50 SMA in blue, 100 SMA in orange, and 200 SMA in red, with uniform line thickness for clean visual consistency.

Daily SMA 20/50/100/200Simple Moving Averages indicator displaying four commonly used trend lines on the price chart. Plots the 20, 50, 100, and 200 period SMAs to help identify short-, medium-, and long-term trend direction, dynamic support and resistance, and overall market structure. Color-coded for clarity: 20 SMA in green, 50 SMA in blue, 100 SMA in orange, and 200 SMA in red, with uniform line thickness for clean visual consistency.
