Technical Analysis and Outlook:
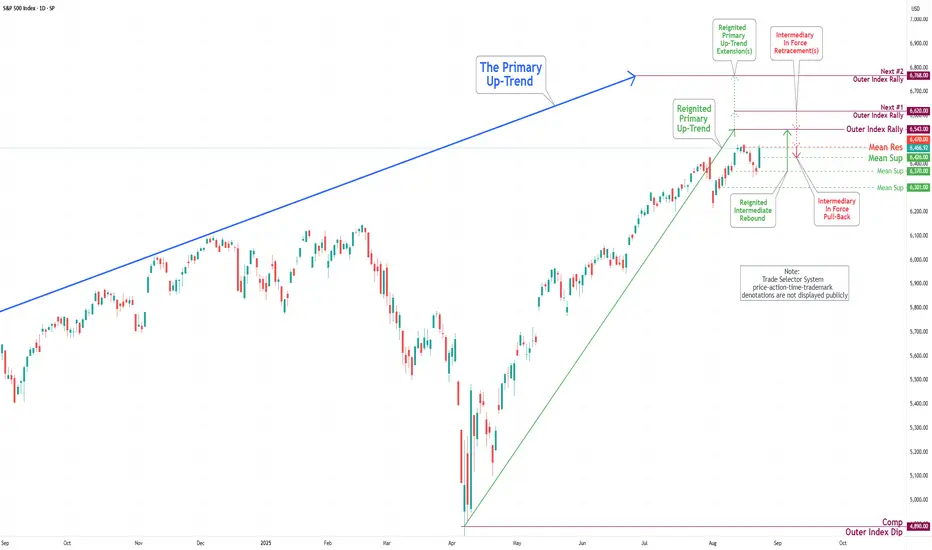
During the trading activity of the previous week, the S&P 500 Index experienced significant volatility before reestablishing its strong bullish trend. Initially, the Index faced a substantial decline, reaching our designated target of Mean Support at 6370. Subsequently, it rebounded vigorously, attaining our target of Mean Resistance at 6470, and is currently aiming for the Outer Index Rally target of 6543. It is essential to recognize, however, that there remains a possibility of a decline to Mean Support at 6426 before the upward trajectory resumes.
During the trading activity of the previous week, the S&P 500 Index experienced significant volatility before reestablishing its strong bullish trend. Initially, the Index faced a substantial decline, reaching our designated target of Mean Support at 6370. Subsequently, it rebounded vigorously, attaining our target of Mean Resistance at 6470, and is currently aiming for the Outer Index Rally target of 6543. It is essential to recognize, however, that there remains a possibility of a decline to Mean Support at 6426 before the upward trajectory resumes.
Publicaciones relacionadas
Exención de responsabilidad
La información y las publicaciones que ofrecemos, no implican ni constituyen un asesoramiento financiero, ni de inversión, trading o cualquier otro tipo de consejo o recomendación emitida o respaldada por TradingView. Puede obtener información adicional en las Condiciones de uso.