Support & Resistance Zones [SHK]Support & Resistance Zones clearly draws some useful S\R zones for you.
Important notes:
It's not bulletproof and unmistakable but it may be so useful to get some strong zones. You may get false or missed levels, So always check for other levels.
Always draw the continuation of previous levels by hand. It's a must! I didn't continue the zones to keep your charts clear.
The lagging is zero . Unlike many similar scripts.
Just compare the results to another support and resistance tools :)
Feel free to share your ideas about this script.
Support

Support/Resistance Algo-Tradeing StrategyThis strategy Automates Support and resistance trading and a tight trailing stop loss technique. The support and resistance levels are calculated from previous highs and lows; these levels are used to make two types of trades:
1. Break out trades, taking a trade if the market is able to push through a support or resistance level.
2. Liquidity pool rejection, also known as a stop loss hunt. When the market is brought past a key level (to take out stop losses) which traders (usually institutions) use to enter, which then reverses back through the support/resistance level where the strategy enters a trade.
An optional "volatility filter" may be used when on a suitable market. This means that trades are only entered when there is suitable volatility.
A tight stop loss is kept so most trades lose, but winning trades are left to run much further. So this is a very reliable profitable strategy on many markets.
For a limited time I will provide access to this strategy for free as it is not yet complete, there is still testing to do and I would appreciate any feedback.

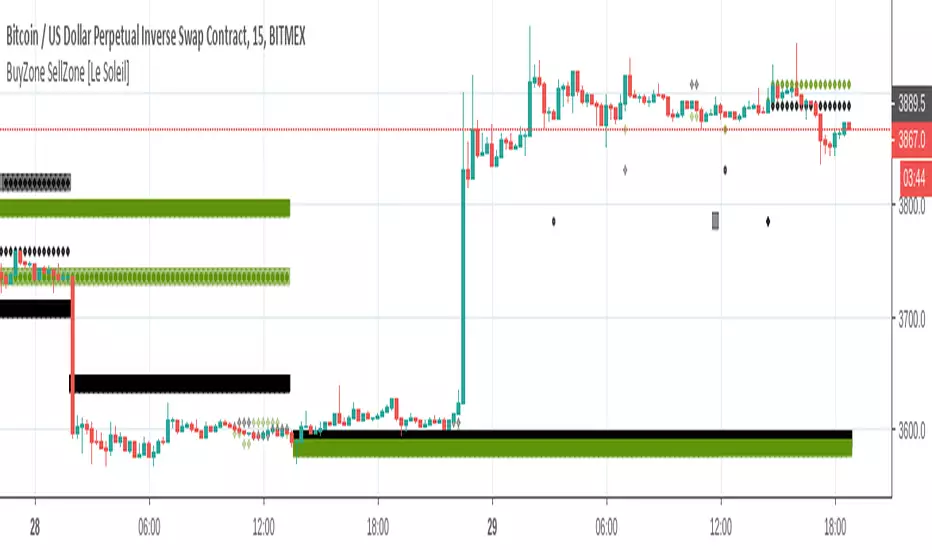
BuyZone SellZone [Le Soleil]Show buy zone, sell zone. You can use it for trade and margin. It is really useful and more effective than Support Resitance line. Like and follow me if you like it.
Support and Resistance Levels (Volume) Script to create resistance levels, to find pivot points and accurate entry. On the smallest timeframes, the script shows the most accurate results.
Settings:
"Support / Resistance length" - the more, the less results, but more accuracy
"The number of candles on the screen" - screen length in bars for comfortable work

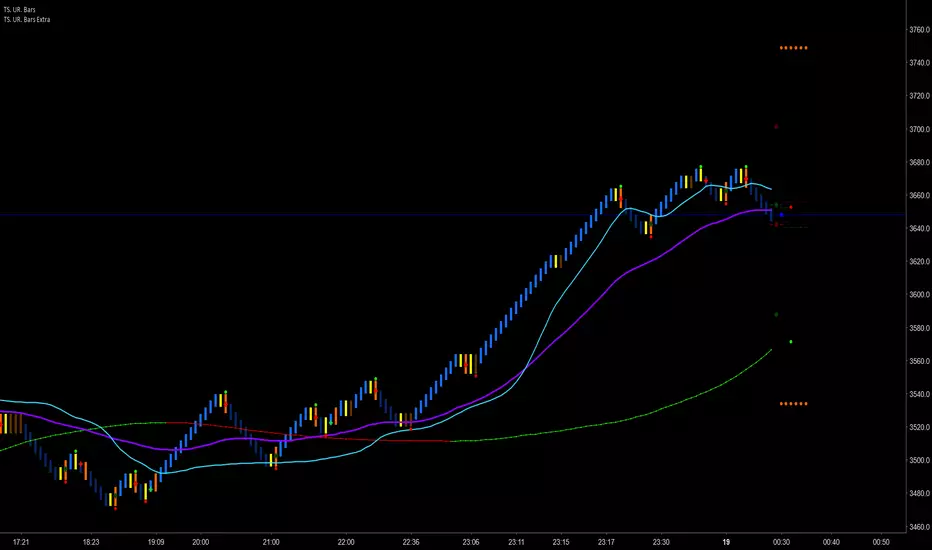
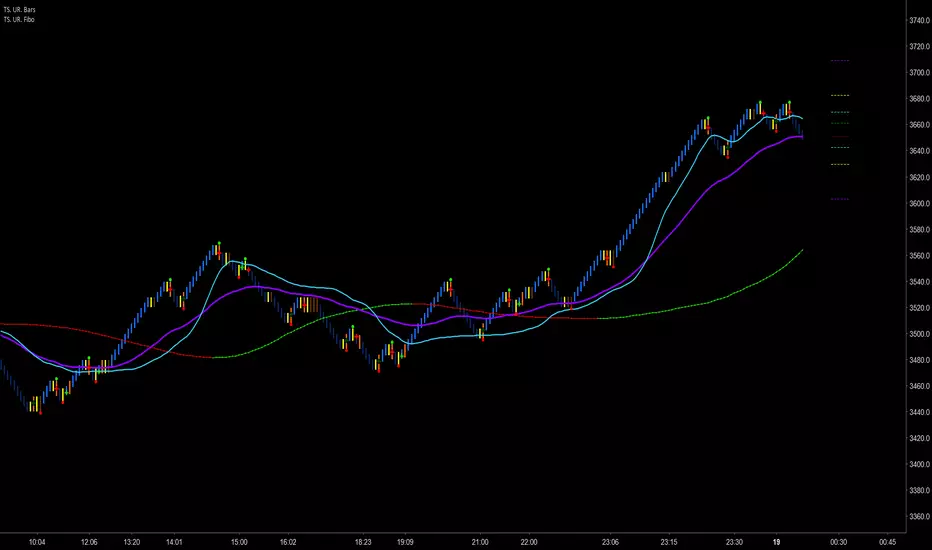
Trader Set - Uni Renko Bars ExtraThis is the separated script from original Uni Renko script. The main reason for this separation is that Trading View limits the user on plotting stuff to 64 plots, the Uni Renko script was so full that even a single more plot was impossible, so, separation came and now if i want to add any feature to this, it's possible.

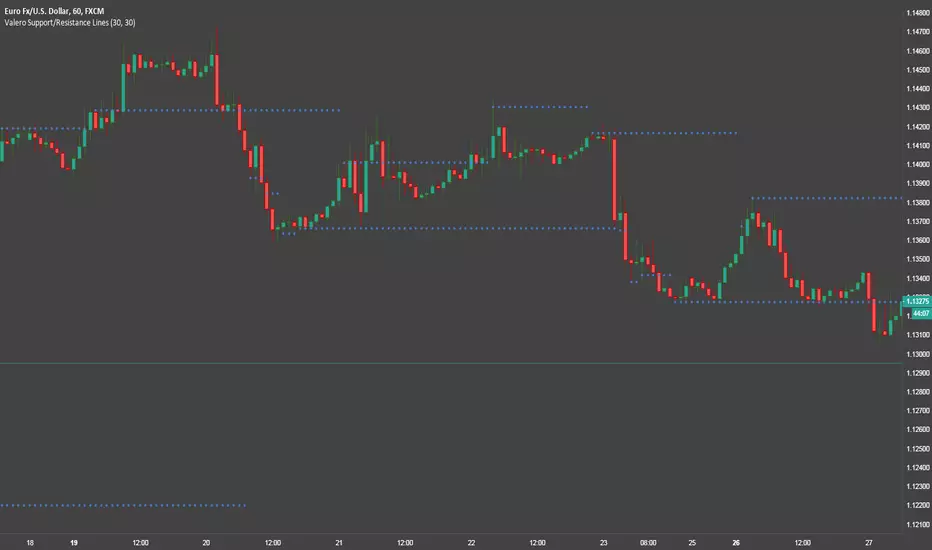
Valero Support/Resistance LinesThis is a pretty simple indicator that automatically draws Support and Resistance lines.
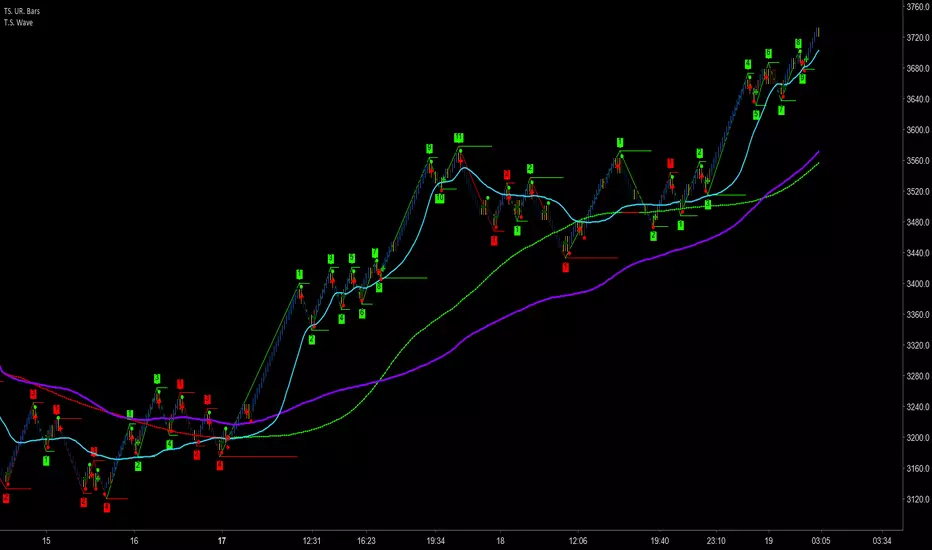
Trader Set - Wave CountThis is a wave counting tool for my methodology with little addition of drawing high low sections of wave reversal as local support / resistance.
Please don't contact me for getting access, these tools are only available for my students. The English version of website and learning materials are under development and soon they will be ready. I will announce it under every script related to my methodology so that you get informed and participate in the course if you want to.
DYNAMIC SUP/RES 3.0Dynamic Support/Resistance 3.0
Features:
4x EMA
2x SMA
Horizontal support/resistance plot
Moving average support/resistance plot
Long/short signals + alerts
Close signals + alerts
Take profit signals + alerts
PRO FrameworkINVITE ONLY SCRIPT:
FEATURES:
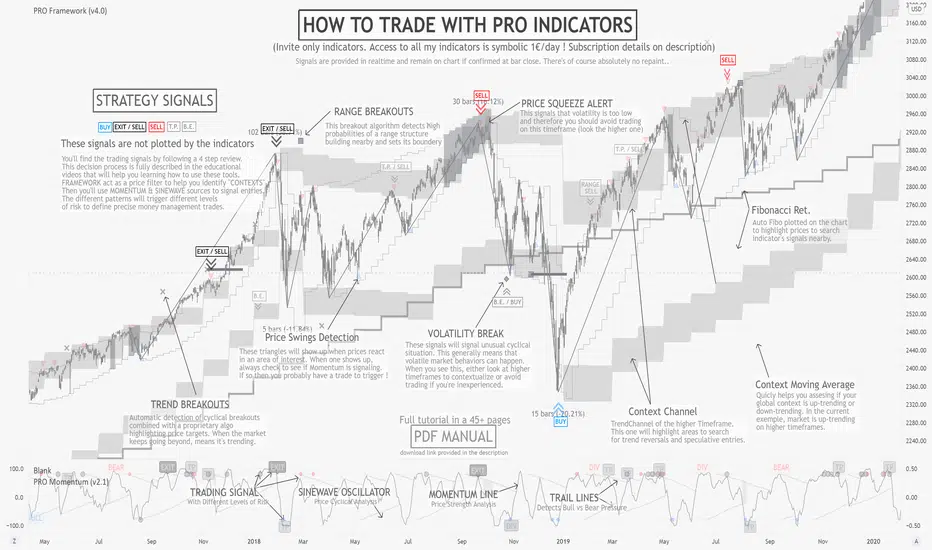
As its name suggests, Framework is here to offer a non-subjective frame of reference to traders. Effectively filtering 90% of prices offering poor risk management opportunities. More importantly this is a multi-timeframe tool that will scan across three time frames all at once, offering a final synthesized rendering. Our goal was to provide a professional grade dynamic price analysis without bloating the chart with numerous plots. Nevertheless they are complex tools requiring extensive learning. To support students in their journey, there is a wide open online community of users in our Discord channel, providing peer-to-peer assistance to progress with the strategy as well as tutored courses.
OUTPUTS:
To share a brief description of the indicators functioning, we will scroll through the major set of outputs that are presented to the user. Please note that the indicator is meant to assist from Junior to Senior expertise, to achieve this we have set different base templates right into the indicators. To keep this description simple, we will present the outputs you’ll see with the beginner setup:
Context Channel: composed of two “ribbons” one above the price and one below. It represents the dynamic zones of supply and demand, where prices are likely to find support and resistance for the given chart timeframe. They are representing complex algorithmic versions of channels evolving over time, while adapting to both ranges and trend conditions. Allowing to visualize the current price channel which the price is trading within, but also review the history of past dynamics. Ultimately, studying both the recent and past context behavior tells us everything we need about the price structure.
Average Price: Corresponding to a simple 20 period moving average synchronized with the context channel reference timeframe. Looking at the channel’s position relative to this average will help us define the “context” of the market, thereby filtering the patterns we will be able to apply to this chart (range, trend, volatility).
Breakout Targets: represented by small plots on the chart (cross, square, diamond) they inform the trader that the market is attempting to move in a particular direction. Given the predetermined context in which that pattern triggers, this will help us in managing the risk.
Price Confirmations: corresponding to the small triangle plots on the chart, they are automatically calculated to determine areas where other traders might have taken actions. These triangles aren’t a trading signal per say, they will be the trigger for our trades with the PRO Strategy, but only when patterns are active (meaning we are in the right context, and have enough risk limitation elements to justify entry).
Auto-Fibonacci: As most of our patterns include certain retracement rules, we decided to include a built-in fibonacci plotting tool. The outputs will automatically update with new prices, allowing users to use it as a trigger for the TradingView alerts system.
Automated Context Detection: the actual real Intellectual property and added value of PRO Indicators resides in our semi-automated system, based on the complex algorithmic detection of potentially favorable contexts to apply the strategy on. This also means that you can set alerts, and let the cloud monitor the market and be notified when the conditions are deemed viable. As you progress to more Senior contexts and adjust the indicators’ template setup, more complex alerts will be detected.
GENERAL STRATEGY:
Overall, the PRO Strategy combines two “core” indicators, Framework and Momentum. Framework is plotted on the main chart section as an overlay, it is definitely the most important as it guides the user through the hard process of filtering prices and timeframes that are suitable for technical analysis. On the other hand, PRO Momentum is on a separate oscillator tab under the chart section, it will study the momentum and cyclical structure, also offering automated pattern detection. Ultimately, our strategy is based on collecting and processing non-subjective rules, emanating from the indicators outputs. Essentially, this means that the indicator actually takes care of producing all the necessary binary outputs, leaving you with the remaining task of combining them correctly following the strategy’s patterns.
RISK LIMITATION:
Even if we provide semi-automated detection of viable contexts, there is no “one-click” or "easy-win” solution, the user still needs to carefully review the elements. When applicable pattern rules are confirmed, the user will gather risk-limitation information (breakout targets, price confirmations, momentum and cyclical coordination) and decide whether or not to trade according to its own risk profile. If so, the position sizing, stop-loss positioning, risk management and profit targets will all be defined according to the same indicator’s outputs. This effectively suppresses most behavioral and personal biases the trader could introduce, creating a stable and statistical risk management structure aiming for a durable profitability.
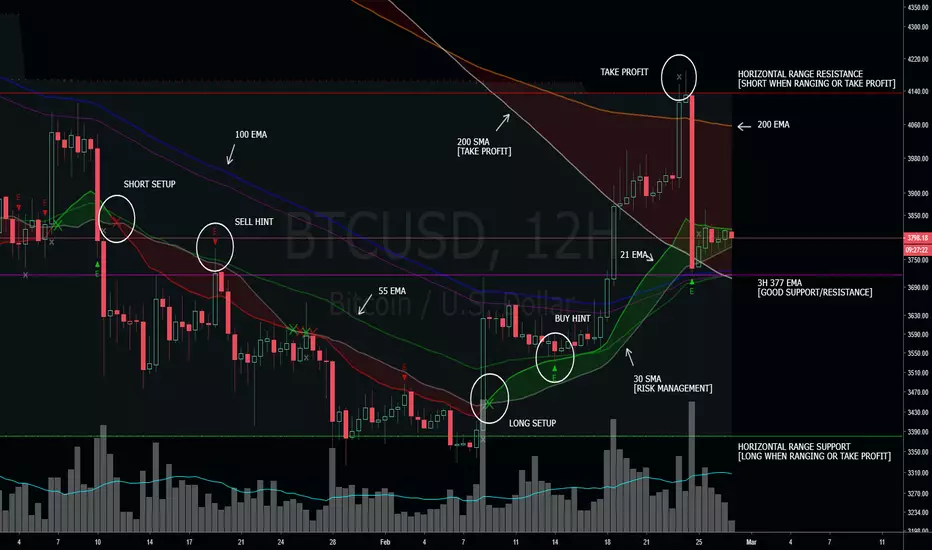
CryptoMedics Algorithmic Trading BandsCryptoMedics are happy to announce the release of our new Algorithmic trading bands!
The Bands can be used as dynamic support and resistance levels. Anything from scalping on the 1m chart to swing trading on the daily. The opportunities are endless.
Developed using tried and tested methods that hedge funds from wallstreet to smart individual traders have used for years now. Now all available to you.
Here is an example of scalping with it on the 3m chart on BCHZ18. If you would've used 10x leverage you would've made a total of 760%!
Examples:
Another example on XBTUSD using the bands to catch a swing trade
These results are undeniably good and I bet you can't find similar ones with any other indicator!

Tensor Toolbox Overlay BetaThis purpose of this script is to test new features we might want to implement in Tensor Cloud (See: . Also, to work towards a full, all-in-one indicator solution (Tensor Toolbox). In this first version of Tensor Toolbox Overlay, we propose two new features for Tensor Cloud:
The Veil.
Ichimoku Weight/Smoothing.
The Veil is an RSI filter. The Ichimoku smoothing takes Ichimoku and averages it with Tensor Cloud. The Ichimoku feature will probably not make it into Tensor Cloud but Veil might. Tensor Cloud should remain as pure as possible. It's all up to your feedback. Initial features of Tensor Toolbox Overlay:
Tensor Cloud.
Support & Resistance.
MACD background.
Long & Short potentials.
Tensor Toolbox Overlay needs a lot more features yet to remain elegant. A second edition called Tensor Toolbox Oscillator is coming as well (Can only fit so much on the chart). The goal with both is to have a suite that takes the best of all indicators and provides easy decision making, for those who like to keep control. For Overlay, I also intend to duplicate the functionality of MTPredictor at a fraction of the cost. Feedback appreciated.
Enjoy :)

MA ZonesThis simple indicator paints the zone between up to 3 different Moving Averages and Exponential Moving Averages.
For example:
The green zone is the price between the 50 EMA and the 50 MA .
The orange zone is the price between the 100 EMA and the 100 MA .
The red zone is the price between the 200 EMA and the 200 MA .

CryptofxpointsThis script uses combinations of fibonaci retreat levels + pivot points is used to automatically detect support zones and resistance works in all periods of time and all markets

DYNAMIC SUP/RES 2.0Dynamic support/resistance generator.
It is volume based script which generates real time support and resistance levels.
Features:
- range finder
- high resistance zone finder
- fibonacci based support resistance levels
- stoploss
- 4x EMA
- 2x SMA
Enjoy and trade safe.

[IE] Multiple price indicators + SCALPERDetect divergences in price and RSI + pivot points (with alert option). Credits to @Libertus for this, I only reproduced it and after that he pointed me to his work.
Has ChartVamp and EricChoe MAs with prediction.
Displays Support and Resistance areas
Detects momentum changes.
Custom scalper with alert option.

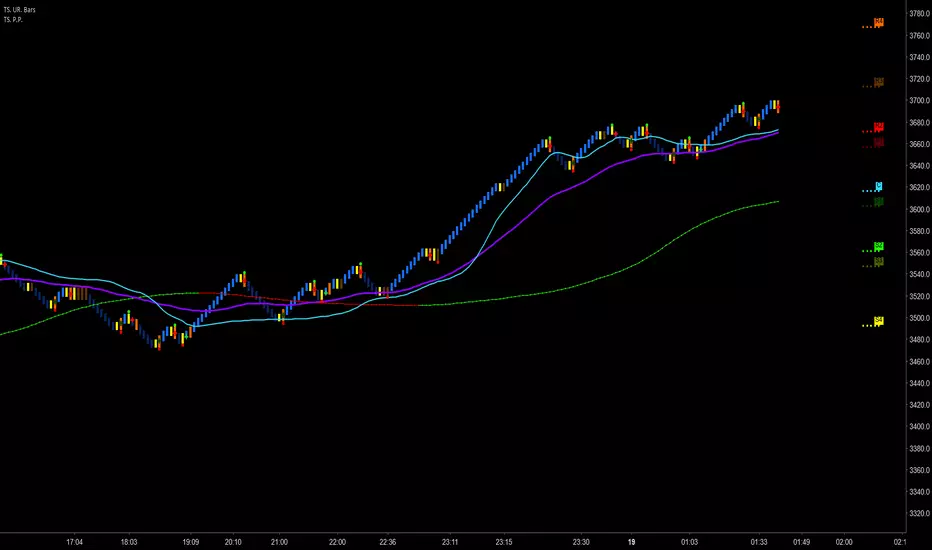
Trader Set - Pivot PointsThis is a Pivot Point indicator that has the ability to sit on top of Uni Renko Charts to show the center pivot (others don't work because of specifications of uni renko chart unless i figure something in future) but on price charts and range charts they work like charm.
Unlike the built in indicator, you can choose separately to draw each support or resistance level. Other than Standard draw from the built in indicator, all other types are included in this indicator.
Please, don't ask for access, only my students from my classes will have access to this indicator, at least for time being. If at any time in future I wish to sell, you will find the price and how to buy in the comments bellow.
Trader Set - Uni Renko FiboThis is an addition for Uni Renko Chart. You can see it on the right hand side of the chart. It adds few extra levels calculated by fibo values. These levels have different usages.
To use this, you should set your chart on Renko, Traditional with box size of 3.
Please, don't ask for access, only my students from my classes will have access to this indicator, at least for time being. If at any time in future I wish to sell, you will find the price and how to buy in the comments bellow.
Trader Set - Uni Renko MCCIThis is what Woodie calls MCCI, a band of moving averages.
The name MCCI means Moving Commodity Channel Index, although it's one of the rare woodies original indicators (shame on you woodie lol) he suggests that the relation between the bars or price with the bands are something like the movement of the CCI indicator. I can't accept that. For me, these bands have other usages that I teach to my students.
To use this, you should set your chart on Renko, Traditional with box size of 3.
Please, don't ask for access, only my students from my classes will have access to this indicator, at least for time being. If at any time in future I wish to sell, you will find the price and how to buy in the comments bellow.

💪 Support / Resistenace 👊 Finder by 🇨🇷🇾🇵🇹🇴🇷🇹🇭🇾🇭🇲🇸💪 Support / Resistenace 👊 Finder (SRF) dynamically finds support and resistance (supply and demand) levels automatically and weights them accordingly. This is a great tool to use when determining entry/exit upon S/R areas.
💰This indicator is given FREE to all our premium indicator subscribers.
📡SRF calculates the levels working from the current price. So even if you are looking old at historical data it will still calculate the S/R levels from the most recent data. (i.e. it really only works for the last few months on most instruments)
📑The indicator works on any timeframe and any market (stocks, forex, crypto, gold, oil).
📊The option "Pre length" can be changed to fit your needs. It will determine how much historical data the indicator will evaluate for each S/R level.
📊You can also choose how many support/resistance lines to plot from the dropdown menu.
📉Lastly you can also show the current/previous week or months OLHC values. These can often act as S/R levels as well. I suggest only using one at a time or it can get confusing.
💬Come chat with us in telegram (link in signature) if you have any questions or would like a trial of a premium indicators (linked below).
Bull Bear Filter
Bottom Top Finder

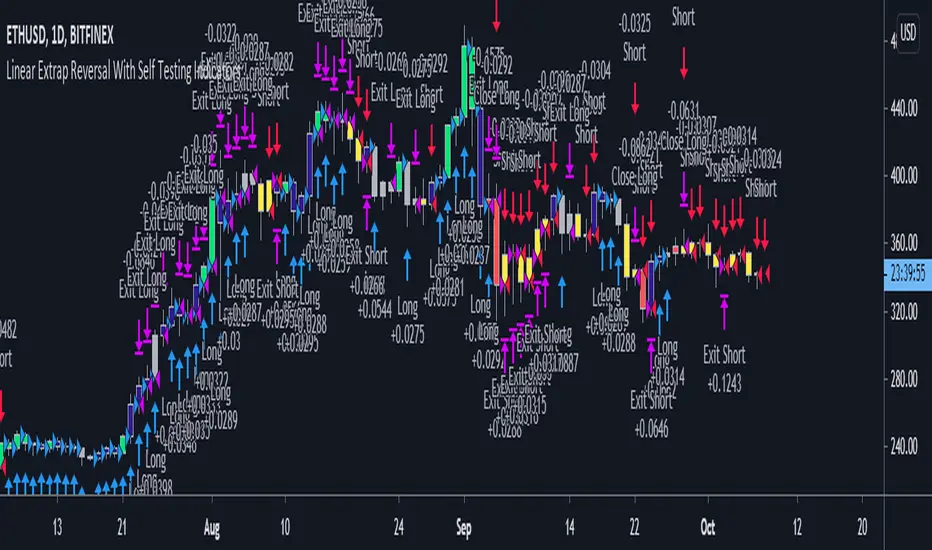
NinetailsVulpix, but now only closing positions when they meet a take profit/stop loss target, and instead the middle red bars are used to reopen positions when in confluence the MA.
Real Candles with Support & Resistance by Emiliano Mesa Public VReal time support & resistance levels with something I like to call real candles. This is a complex overlay indicator which uses several algo's to calculate a real support and resistance level.
(To be honest I wasn't even going to release it to the public, so please do leave positive feedback... This indicator has over 100 lines and took me several hours of hard work. So I do appreciate your support <3 )
Features:
- Real Candles (Evaluates price action and gives each candle a different color based on how bullish or bearish they are)
- Adaptive S/R levels (This are real time support & resistance levels found with algo's, they are most likely to be respected again)
- Confirmed S/R levels with Experimental EMA (Are more likely to be respected than adaptive S/R due to a confirmation by Experimental EMA & KC)
-Squeeze Bars (Fuchsia colored bars which indicate a squeeze in the market)
-Trend Lines (Work in progress, if you have functioning trend lines I do appreciate any feedback on how to work them out. Not in public version)
Key:
Real Candles:
1) Green : Bullish
2) Red : Bearish
3) Lime : Strong Bullish
4) Black : Strong Bearish
S/R:
1) Green: Support
2) Red: Resistance
3) Orange: Previous S/R levels
4) Blue: Confirmed level of S/R
Squeeze:
1) Fuchsia: Squeeze
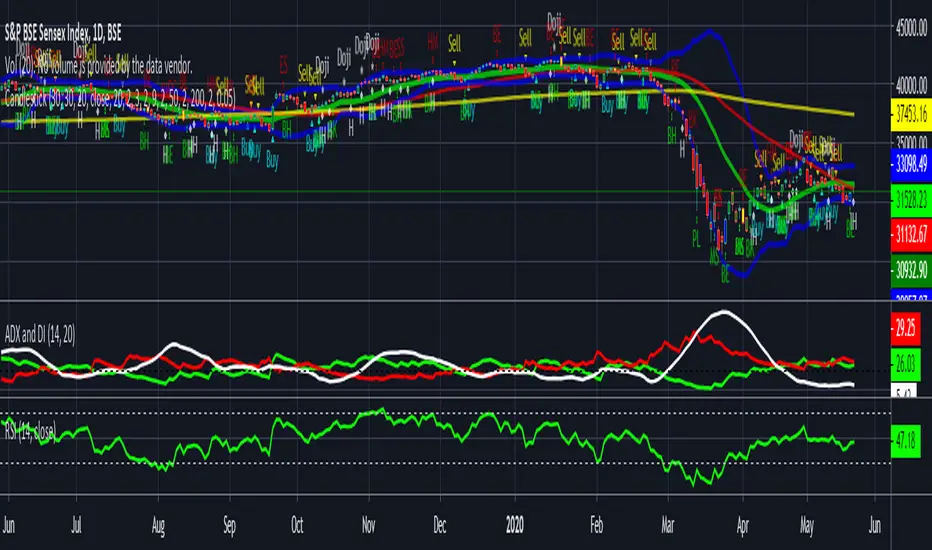
CandlestickThe default script have: Bollinger Bands , Support & Resistance, Buy & Sell Signals and Candlesticks pattern like Doji , Bearish Harami, Bullish Harami, Bearish Engulfing , Bullish Engulfing , Piercing Line, Bullish Belt, Bullish Kicker, and Bearish Kicker.
The Piercing Line, Bullish Belt, and the Kickers will usually show up better in the daily charts .
Details:
Support --> Yellow Color
Resistance --> Aqua Color