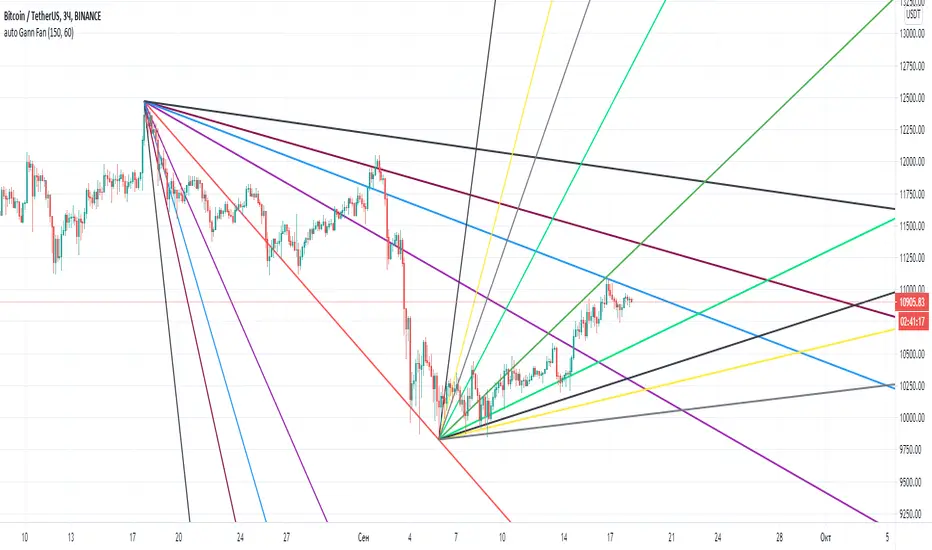
Gann Fan AutomaticAutomatic Gann fan indicator. Works on all charts and time frames.
The idea was to create this indicator so as not to rearrange the Gann fan.
It is good to navigate the lines as resistance and support.
The settings consist of two parameters.
1 this is for the calculation from the local high.
2 for the calculation from the local Low.
Support
Donchian Channels with Auto Fibonacci RetracementRichard Donchian created Donchian Channels, which is a type of moving average indicator and a look-alike of other support and resistance trading indicators like Bollinger Bands.
Donchian Channels has a simple plotting of highest high and lowest low of the last “n” periods.
The “n” periods is based on the trader’s choice, who can select the period according to their requirements ranging from a day, hour and minutes etc.
Traders use Donchian Channels to understand the support and resistance levels.
Donchian Channels is a popular indicator for determining volatility in market prices.
The channels are wider when there are heavy price fluctuations and narrow when prices are relatively flat.
Generally, investors use 20-periods with the Donchian Channels as the default trading setting, but this value can be tweaked based on your trading style.
Donchian channels are mainly used to identify the breakout of a stock or any traded entity enabling traders to take either long or short positions.
Traders can take a long position, if the stock is trading higher than the Donchian channels “n” period and book their profits/short the stock if it is trading below the DC channels “n” period.
The middle band is the average of the upper and lower bands.
The middle band in Donchian channels could also be used as a breakout indicator.
If the stock rises above the middle band of the Donchian channels, then you can open a long position.
On the contrary, if the stock is trading below the middle band of the Donchian channel, then a trader can open a short position.
Combining Donchian Channel trading strategies with other trading strategies might decrease the false entry/exit signals and give a clearer picture of trading opportunities.
If you start to trade a choppy market on an intraday basis, you will be overloaded with false signals.
So, what I noticed is that in order for things to become clearer, we just need to increase the time frame.
Where Donchian Channels Can Fail You
It’s likely not the indicator but more likely our misinterpretation of the signals.
Few areas where the Donchian channel may be tough to read.
Low float stocks are not bound by any indicator, especially Donchian channels.
The challenge with the Donchian channels is that it does not factor in the most recent market volatility.
The indicators provide an equal weighting to all data points.
Therefore when a low float stock picks up and goes on a run, the lower bounds not capture the price movements quickly enough, thus risking giving back more profits than necessary.

Pivot Point SupertrendHello All,
There are many types of SuperTrend around. Recently I thought about a Supertrend based on Pivot Points then I wrote "Pivot Point SuperTrend" script. It looks it has better performance on keeping you in the trend more.
The idea is behind this script is finding pivot point, calculating average of them and like in supertrend creating higher/lower bands by ATR. As you can see in the algorithm the script gives weigth to past pivot points, this is done for smoothing it a bit.
As I wrote above it may keep you in the trend more, lets see an example:
As an option the script can show main center line and I realized that when you are in a position, this line can be used as early exit points. (maybe half of the position size)
While using Pivot Points, I added support resistance lines by using Pivot Point, as an option the script can show S/R lines:
And also it can show Pivot Points:
When you changed Pivot Point Period you can see its reaction, in following example PP period is 4 (default value is 2). Smaller PP periods more sensitive trendlines.
Alerts added for Buy/Sell entries and Trend Reversals. (when you set alerts use the option " Once Per Bar Close ")
ENJOY!

Phicube EMASAR ( EMA Support and Resistance )Indicator based on the Concept created by Bo Williams. But unlike the original that uses MIMAs, EMAs are used here.
Exponential moving averages will be shown according to fractal alignment, in order to show the important support and resistance levels ( SAR ).
When the fractals are aligned to become support,
we will have the EMA in the graph with a bright color.
When the fractals are aligned to become resistance, we will have EMA in the graph with a matte color.
Available exponential moving averages: 17,34,72,144,305,610,1292 and 2584
____________________________________________________//_____________________________________________________________________
Indicador baseado no Conceito criado pelo Bo Williams. Mas diferente do original que utiliza MIMAs, aqui é utilizado EMAs.
As médias móveis exponenciais serão mostradas de acordo com o alinhamento dos fractais, com objetivo de mostrar os níveis importantes
de suporte e resistência( SAR ).
Quando estiver com os fractais alinhados virando suporte, teremos no gráfico a EMA com uma cor em tom brilhante.
Quando estiver com os fractais alinhados virando resistência, teremos no gráfico a EMA com uma cor em tom fosco.
Médias móveis exponenciais disponíveis: 17,34,72,144,305,610,1292 e 2584

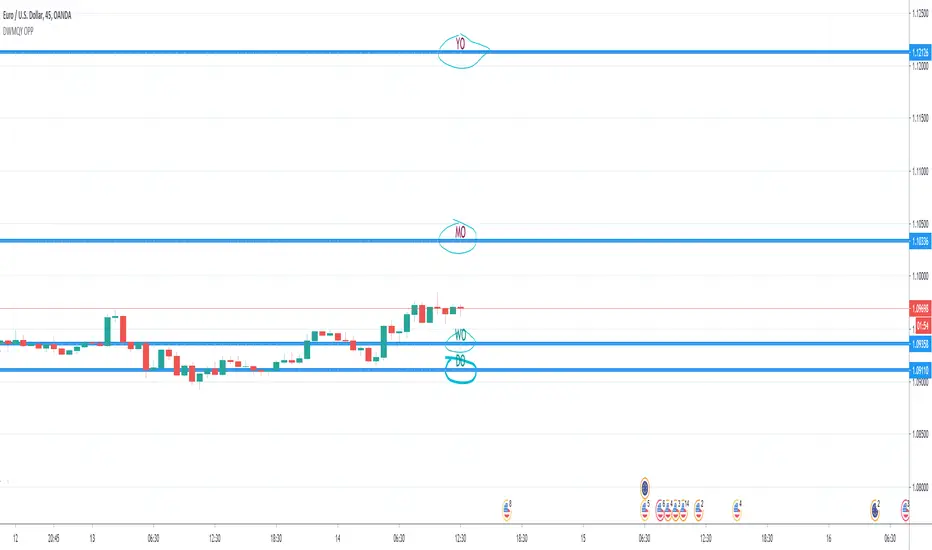
Day & Week & Month & Quarter & Year Open Price PointsPresent to your attention, basic “Day & Week & Month & Quarter & Year Open Price Points Indicator” !
You can determine support & resistance using Yearly, Quarterly, Monthly and Weekly open price points on a chart with any timeframe.
It is not a widely used technique, but according to different academic studies, levels are reliable. Google it! You can enhance your trading by adding that technique in your tool list.
At the current stage, Indicator shows Open Price Points.
Opening price points are extended into the future from the opening candle of each year, quarter, month and week and day.
By nature of that points, every level may be used as a support and as a resistance level at a similar time.
Initial setup:
1) Open the indicator Inputs settings, enable/disable additional Price Points.
2) Open the indicator Style settings, click on a style of each line and click on a “Price Line.”
How to use that?
With a lot of available strategies, there are two leading: Level convergence and Trend line convergence.
1) Level convergence involves locating two or more opening points that merge. This confluence can lead to greater accuracy and profitability.
2) Trend line convergence - The intersection of a trend line at a weekly, monthly, quarterly or even yearly opening level can produce fast and profitable reactions.
Try that!
As a stand-alone strategy, you can utilize that:
Price action under the WO (DO, MO, QO, YO) – Bearish
Price action above the WO (DO, MO, QO, YO) – Bullish
TIP: opening level not always good as a stand-alone tool!
Indicator Settings:
Show Daily Open (disabled by default)
Show Weekly Open (ON by default)
Show Monthly Open (ON by default)
Show Quarter Open (disabled by default)
Show Yearly Open (disabled by default)
Indicator Styling:
By default, each line is shown in the form of circles, line-width 1, silver colour.
Labels can be only in one of two states: Maroon (if open price less than ((open + high + low + close)/4) or Teal (if open price high than ((open + high + low + close)/4).
Alerts:
With the Indicator you can add a few different alerts:
DO Alert
WO Alert
MO Alert
QO Alert
YO Alert
Play with it:
Add a new alert with following condition: your SYMBOL crossing DWMQY OPP Weekly Open.
Options: Once per Bar.
Future of the Indicator:
The Indicator is a necessary part of more prominent Indicator which will include 8 modules in total:
2~ Arabian Wise Tunnels Module
3~ RH Waves Module (something like Vegas Waves)
4~ Trend Channels Module
5~ Opening Range Zoning Module
6~ Breakout Module
7~ BS Hemisphere Module
8~ Price Action Module
DISCLAIMER! RISK WARNING!
PAST PERFORMANCE IS NOT NECESSARILY INDICATIVE OF FUTURE RESULTS. TRADERS SHOULD NOT BASE THEIR DECISION ON INVESTING IN ANY TRADING PROGRAM SOLELY ON THE PAST PERFORMANCE PRESENTED, ADDITIONALLY, IN MAKING AN INVESTMENT DECISION, TRADERS MUST ALSO RELY ON THEIR OWN EXAMINATION OF THE PERSON OR ENTITY MAKING THE TRADING DECISIONS.
//Written by iambitboy request.
GC Supports & ResistancesThe indicator display the supports and resistances available. Breakout also are reported in case that not exists at least three resistances.
Does print lines and labels with each identified data (S, R and BO).
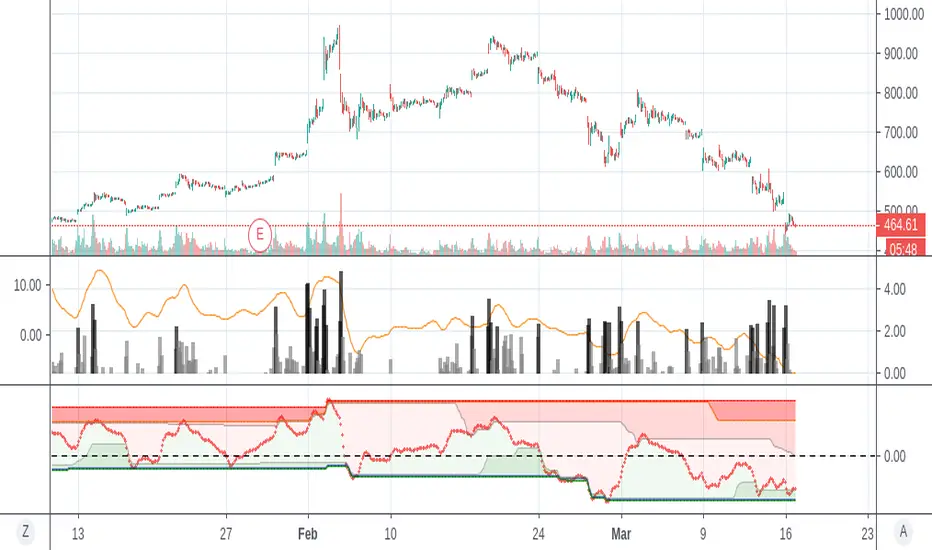
SMI Stochastic Momentum Index 2x set per Baiynd -Tom1traderStochastic Momemtum Index - a true strength indix tsi with a moving average signal.
This uses the built in with modifications per Anne-Marie Baiynds recommendations - she uses a SIMPLE MOVING AVERAGE
for the signal (signal length at 4x the short length seems to work best to reflect actual price action support or resistance)
Note: Default settings in this code have been updated to her most recent recommendations that I have seen.
video is entitled "The Most Reliable Technical Indicator I Have Ever Used"
Note: I have not discussed this with Ms . Baiynd this is my interpretation of the vids I have seen.
Anne-Marie Baiynd also in talks / videos refers to the use of short / long of 4/20 and 6/40 and have combined both of them here
This overlays both of them with their respective SMAs- a 4/20 lengths and a 6/40 lengths in darker colors and smallest linewidth.
this gives a perspective on slightly higher time frame action.
USAGE: Generally above and below the black dashed zero line is long or short
KEYS: -Plot position relative to zero black, red overbought, green oversold and the gray lines at .25 -.25
Indicator action often more significant out side of the more "neutral" +.25/-.25 area
and near or above/below the red/green dashed lines.
-Steepness of slopes
Slopes of smi plots relate directly to price action where steeper is more momentum.
- -SMI blue relation to its simple moving average orange and the SMI longer dark blue with moving average purple.
MAJOR FEATURE - The average acts as support or resistance to the SMI and the price unless breaking out.
Price is often pausing or reversing iin finding primary/secondary support or resistance as well at those times.
You Can See and anticipate Where Support or Resistance may be Encountered. (much unlike most indicators)
My standard caveat -use at your own risk. Like anyone else I do not know what the next bar/candle is going to do
and I place all of my trades with a management plan in place for the worst case scenario.
That said enjoy your charting and trading.
This was coded starting with the built-in indicator "SMI Ergontic Oscilator / Indicator". You do this by within the Pine Editor select "New" tab and
choose the indicator that you want the code for. This populates the editor with the code for the built in indicator and you can modify it to suit your
purposes and save it / publish it and etc. Thanks for following this and Keep Smiling!

Level KingShows key historical support & resistance (S/R) levels on multiple timeframes
Shows two nearest levels below and above current close price on 2 selected time frames
Option to select timeframes (daily, weekly, monthly, current)
Option to display moving average S/R levels as well (daily and weekly)
Option to display levels for current bar only, or to show all historic S/R levels as they occurred
Strategies include:
Enter or add to long positions on "support" (when price touches a green/blue line)
Enter or add to short positions on "resistance" (when price touches a red/purple line)
Take profit from a long position when a "resistance" level is touched for the first time
Take profit from a short position when a "support" level is touched for the first time

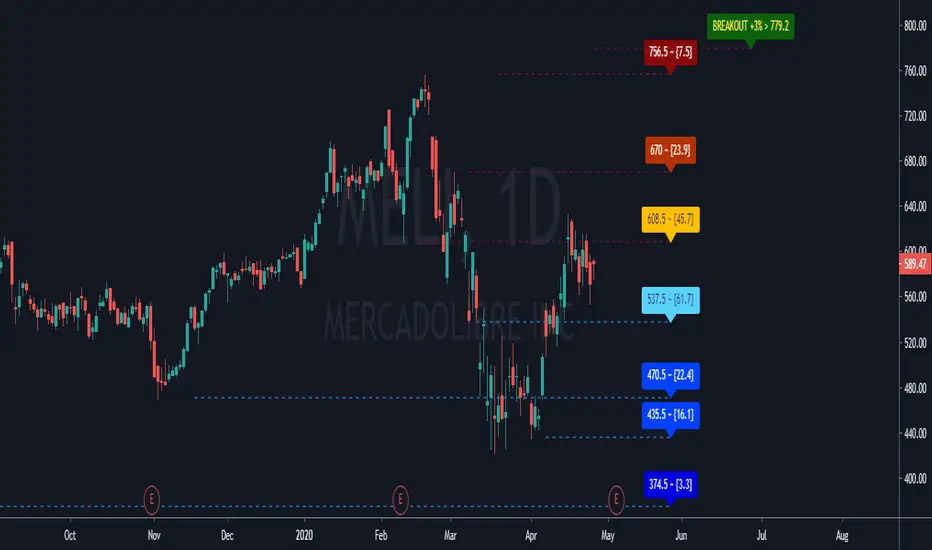
Areas of Support/Resistance & BreakoutA pretty little indicator showing pivotal breakouts - that is, locating critical pivot points within price action, connecting the dots and trading the breakouts from this area!
-----------
Useful for finding good entry levels, exit levels, areas of strong support/resistance and most importantly - the Breakout!
Includes "Bars to the Left" variable so you can shorten or lengthen the indicator as required.
Good Luck and Happy Trading!

Trend Lines for RSI, CCI, Momentum, OBVHello Traders!
After publishing Trend Lines for RSI yesterday, I realized that Trend Lines for more indicators needed by the traders. so I decided to make it for four different indicators: RSI, CCI, OBV, Momentum
In the indicator options you can choose the indicator from pull-down menu.
How it works?
- On each bar it finds last 10 higher and lower Pivot Points (PP) for the indicator.
- from first bar to 10. Pivot Point it searchs if a trend line is possible
- for each PP it starts searching from the last PP .
- it checks if drawing a trend line possible or not and also it's broken or not
- if it's broken then optionally it shows broken trend lines as dotted (or you can option not to see broken lines)
- if it finds a continues trend line then it stops searhing more and draw trend line, this is done by checking angles (I did this to make the script faster, otherwise you may get error because of it needs time more than .2sec)
- the script makes this process for each PP
- then shows the trend lines
P.S. it may need 3-10 seconds when you added the script to the chart at first (because of calculations)
Trend lines for CCI:
Trend Lines for OBV
Trend Lines for Momentum:
You may want to watch how Trend Lines script works (that was made for RSI)
s3.tradingview.com
If you still didn't see Trend Lines v2 then visit:
All Comments are welcome..
Enjoy!

Levels Compound v.2Daily, weekly, monthly support and resistance levels. Also paints 2 different daily WMAs and the daily weekly monthly avg.

Trend Lines v2Hello Everyone. After working on new and better trend lines script for couple of weeks, finally I am proud to publish Trend Lines v2.
How it works?
- On each bar it finds last 10 higher and lower Pivot Points (PP).
- from first bar to 10. PP it search if a trend line is possible
- for each it starts searching from the last PP.
- it check if drawing a trend line possible or not and also it's broken or not
- if it's broken then optionally it shows broken trend lines as dotted
- if it finds a continues trend line and stop searhing more and draw trend line (I did this to make the script faster, otherwise you may get error because of it needs time more than .2sec)
- the script makes this process for each PP
optionally trend lines may be Solid or Dashed
optionally you may get rid of broken trend lines if you think it's crowded
and sometimes you may not see any trend line on the chart. this means you need to adjust the period for Pivot Points accordingly
also I made a video. if you watch this video you can see how the script works.
Important! after you add this tool to the chart you may need zoom-in and zoom-out to see all lines!
I thought a lot to make it free or not then I decided make it free and open source. you should know there is a lot of effort for this script, so if you think this is usefull please consider a donation ;)
Enjoy!

MM-S/R
This indicator shows long term support and resistance levels that combine monthly time frame and selected time frame. For example, If you select 4h time frame, this indicator shows supports and resistances for 4h and also 1 month time frame.
Orange dashed line : Lowest low level for selected time frame in 377 bars.
Orange line : It shows pivot low levels based on price touches for selected time frame.
Maroon line : It shows pivot low levels based on price touches for monthly time frame.
Green line : It shows pivot high levels based on price touches for selected time frame.
Aqua line : It shows pivot high levels based on price touches for monthly time frame.
Green dashed line : Highest high level for selected time frame in 377 bars.
This is just an indicator. You can use it, but it’s at your own risk.
Bu indikatör seçilen zaman dilimi ve 1 aylık periyotlar için uzun dönemli destek ve direnç seviyelerini gösterir. Örneğin, 4 saatlik zaman dilimini seçerseniz, bu indikatör size 4 saatlik zaman dilimi için oluşan destek ve dirençlerin yanı sıra 1 aylık periyotta oluşan destek ve direnç noktalarınıda gösterir.
Turuncu kesikli çizgi : Seçilen zaman dilimine göre 377 barlık en düşük seviyeyi gösterir.
Turuncu çizgi : Seçilen zaman diliminde oluşan pivot düşük noktalarını ve bu noktalara fiyat dokunuşlarını baz alarak çizilir.
Mor çizgi : 1 aylık periyotta oluşan pivot düşük noktalarını ve bu noktalara fiyat dokunuşlarını baz alarak çizilir.
Yeşil çizgi : Seçilen zaman diliminde oluşan pivot yüksek noktalarını ve bu noktalara fiyat dokunuşlarını baz alarak çizilir.
Turkuaz çizgi : 1 aylık periyotta oluşan pivot yüksek noktalarını ve bu noktalara fiyat dokunuşlarını baz alarak çizilir.
Yeşil kesikli çizgi : Seçilen zaman dilimine göre 377 barlık en yüksek seviyeyi gösterir.
Bu sadece bir indikatördür, alım satım tavsiyesi içermez. Kendi riskinizi alarak kullanabilirsiniz. Yatırım tavsiyesi değildir.

NSDT Colored Support And Resistance ZonesScript that allows you to plot four (4) different support/resistance zones. The zones will change color whether the candle is over or under or within the zone area. All options can be modified. Tip: If you want eight (8) zones, just load the indicator twice.

Dynamical Support and Resistance [Fournier-Eaton]The Dynamical Support and Resistance Indicator finds support and resistance levels.
The plot is price relative: if the indicator nears one of its supports or resistances then the price is likewise nearing a support.
The levels are dynamical: once a support or resistance is broken, a new calculation is performed.
There are 3 supports and 3 resistances each with a longer time-frame. Breaking through the first shouldn't signal much, breaking through the third is programmed to only happen at a significant number of standard deviations.
Enjoy. Feedback appreciated
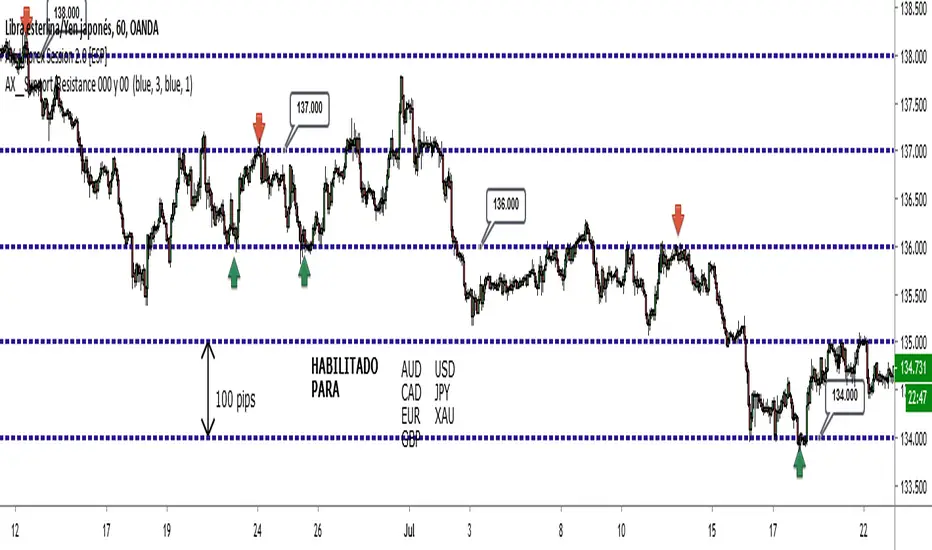
AX__Support/Resistance 000 y 00 There are many assets in the markets that are very sensitive to round levels, especially double or triple zero, so that these levels function as clear levels of support or resistance, sometimes very strong. And that we can take advantage of along with other things, to operate with a greater probability of success.
The script or indicator mainly for all currencies of the FOREX and XAUUSD gold market generates reference lines that at certain times of the market function of resistance or support by performing an automatic line without the need to draw them in tradingview although in tradinview they also generate the same lines only This script has a more prominent visual mode that makes it much better than the generic TV
generates lines every 100 pips FOREX including gold
generates extra lines of 10 pips without losing resolution (optional)
1 to 4 line thickness
4 colors black blue white and gray
I hope this tool helps you in your daily trading if you have any suggestion correction write me in comments or imbox by tradingview messages look for me by the name of AX010
====================================================================
Existen muchos activos en los mercados que son muy sensibles a los niveles redondos, sobre todo a los doble o triple cero, de forma que dichos niveles funcionan como claros niveles de soportes o resistencias, en ocasiones muy fuertes. Y eso lo podemos aprovechar junto con otras cosas, para poder operar con una mayor probabilidad de éxito.
el script o indicador principalmente para todas las divisas del mercado de FOREX y XAUUSD oro genera lineas de referencia que en determinado momento del mercado funciona de resistencia o soporte realizando un linea automatica sin necesidad de trazarlos en tradingview aunque en tradinview tambien generan las mismas lineas solo q este script tiene un modo visual mas resaltante que lo hace mucho mejor que lo generico de TV
genera lineas cada 100 pips FOREX incluido el oro
genera lineas extra de 10 pips sin perder resolucion (opcional)
grueso de linea de 1 a 4
4 colores negro azul blanco y gris
espero que es esta herramienta les ayude en su trading diario si tienen alguna sugerencia correccion escribanme en comentarios o imbox por mensajes de tradingview buscame por el nombre de AX010
saludos
Rounded Bluebox Zones - Bitcoin BeatsThis script is a combination of my Rounded Pitchforks script and an automatic support and resistance detector.
The goal of this script is to give the future supports and resistances in order to help guide your entries and exits in trades.
Both the curved and straight blueboxes indicate areas of confluence.
This means putting stoplosses and take profits in these areas can be a valid strategy.
This can be used on all timeframes.
ALL LINES AND BOXES CAN BE REMOVED IN THE SETTINGS.
So if you only want the curved pitchforks or only want to show a specific range, you can do as you wish.
For assets different from BTC, you will have to adjust the fully customisable settings.
TRADE AT YOUR OWN RISK

[e2] EDS Key & AvwapThis indicator shows a Key Level Support & Resistance level and VWAP that resets on your choice of the stock's Earnings , Dividends or Splits release date.
A maximum of 8 bands calculated using a factor of the anchored VWAP's standard deviation can be displayed.
Note
The script is designed for stock-trading only.
Credits
Inspired by timwest , LazyBear 's Earnings S/R Levels and MichelT 's Earnings, Splits, Dividends scripts.

Chanlun ChannelThe black line is the current real price, and it's middle of the channel. when close price is in the channel,it means that the market is in balance.
the market need a lot of energy to leave the channel,if the price can leave the channel,the channel will become support or pressure.
缠论中枢(简化版),没有行情时价格围绕黑色线上下波动,价格离开中枢需要较大的量能,一旦成功离开中枢,这个中枢将会变成支撑(压力).
同时他可以用作横盘位置识别

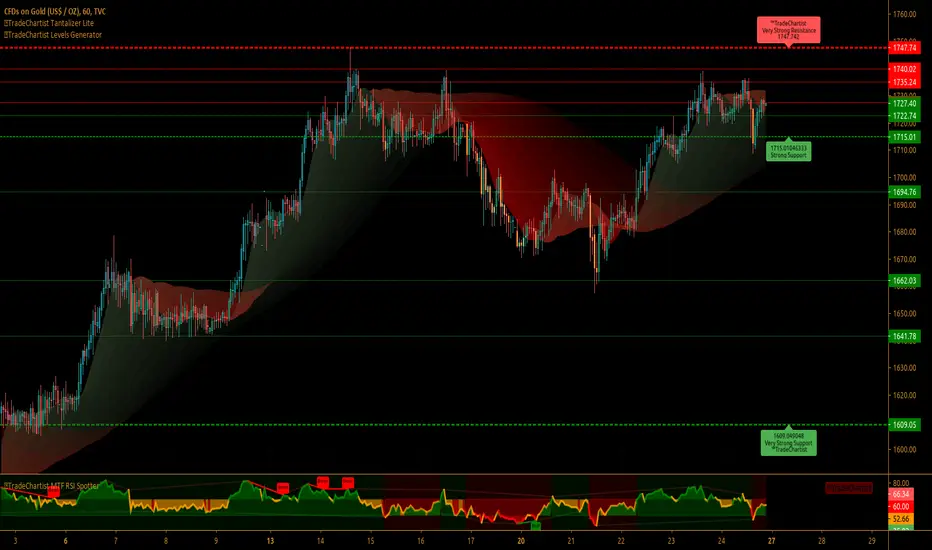
™TradeChartist Levels Generator V4"™TradeChartist Levels Generator" is an easy to use script that can be used by traders of all levels from beginners to advanced professionals.
What does the script do?
Plots the support and resistance levels automatically based on user preference of Local levels of Lower or Higher Timeframe from indicator settings.
Plots Fibonacci retracement levels between high and low based on 'Days' or 'Candles' lookback from indicator settings.
The script proves to be very effective when used with another indicator for trend confirmation like the ribbon (not included in this script) shown on chart.
What markets can this script be used on?
Forex
Stocks
Commodities
Cryptocurrencies
and almost any asset on Trading View
What is the difference between "Plot Levels" and "Plot Fibonacci Levels"?
"Plot Levels" plots support and resistance levels automatically without any input from the user other than preferred levels 'plot' from the indicator settings namely
Plot Local Levels for Higher TF - Plots all important Support/Resistance levels for mostly higher time frames (1hr or higher) - Short to Mid term outlook
Plot Local Levels for Lower TF - Plots all important Support/Resistance levels for mostly smaller time frames (can be used for up to 1hr in most cases) -
Recommended for Scalping/Swing Trading mostly dependent on volatility
"Plot Fibonacci Levels" plots all standard Fibonacci retracement levels - 0, 23.6%, 38.2%, 50%, 61.8%, 78.6% and 100% based on
"Days" Lookback - Fibonacci levels between High and Low based on number of days in the past, starting from the current day on any time frame chart
"Candles" Lookback - Fibonacci levels between High and Low based on number of candles in the past, starting from the current candle on any time frame chart
Can the Fibonacci levels be reversed?
Yes. The Fibonacci levels can be reversed by checking the "Reverse" checkbox from the indicator settings. This is very handy if the trend looks like there may be a support or resistance from one of the Fib levels and a possibility of a new high or a new low based on the price action.
What is the need for "Plot 1.272 Fibonacci Level" under "Plot Fibonacci Levels"?
1.272 is an important Fibonacci number as it is the square root of 1.618 and is the near support or resistance after 100% price retracement. Even though it keeps moving on the chart dependent on the new high or new low based on Days/Candles lookback, it serves as a 'nice to have' reference for any trader looking beyond 100% retracement for support/resistance .
Why do the 'local levels' lines' color changes between green and red?
The nearby levels lines change color based on price closing above or below them. This happens to only closest local levels for lower TF near price action and for top/bottom lines of the local levels for higher TF.
The line turns green when it becomes support as price closes above it.
The line turns red when it becomes resistance as price closes below it.
This is a free to use indicator. Give a thumbs up or leave a comment if you like the script.
BreakBreak
The idea of this indicator is to show the price trend, the pivot-based control points and possible Long and short trades.
The pivot points create levels of support and resistance, if the price breaks the resistance means that the price is bullish, if the price breaks the supports means that the price is bearish.
It shows the highs and lows based on pivot points, showing HH LH HL LL depending on the previous pivots.
A better confirmation for an uptrend is to expect higher high (HH) and then a Higher Low (HL), and for a downtrend expect Lower Low (LL) and then a Lower High (LH).
When the price breaks a previous high or low level, a signal will be triggered in that direction, it is also possible to filter these signals with a ribbon of moving averages, you can choose up to 14 different types of MA's.

Support Resistance - DynamicThis is Dynamic Support / Resistance script.
How it Works?
It finds Pivot Points and creates channels for each Pivot Point. Channel size is calculated by (Highest - Lowest) * %Channel_size in Loopback Period. After creating channels it calculates that how many Pivot Points in the channels. more Pivot Points in channel means stronger Support/Resistance. in the option menu there is S/R Strength, this is the minimum number of Pivot Points that each channel must contain to be S/R. calculation starts from last pivot point and go back for "loopback period" which is 300 by default. so last Pivot Points have more priority. Finally after calculating Support/Resistance it draws lines.
Number of Support/Resistance line is Dynamic and up to 20 lines, that means number of lines changes dynamically. you can see how the script puts Suppport/Resistance lines dynamically by "Replay" button. (if I have time I will try to put a video)
Currently the scripts checks up to 40 pivot points in loopback period. it shows up to 20 S/Rs only for visible area in the chart.
There is option to Show S/R lines as Solid, Dotted or Dashed.
Enjoy!

[VIP] Multi Timeframe Pivot Support Resistance (MTPSR)MTPSR provides 6 boards to watch pivots, supports, and resistances in cross timeframes. By default, timeframes are 15m, 30m, 1hr, 2hr, 4hr, and 1D with the current ticker, but they are changeable on indicator setting.
The Pivot, Support, and Resistances have 2 algorithms; Fibonacci or Classic. Default is Classic, but you can change on indicator setting.
MTPSR has 2 additional boards with BitMex Long and Short Liquidation algorithm, this logic can be used for any ticker especially if you want to have tight control with margin liquidation.
MTPSR provides KDJ charts in cross timeframes with the last 3 candles for every board. The default does not appear, but you can enable it on indicator setting. If Greenline crossover Redline, that is a good position to the long or indicating uptrend. But if Greenline crossunder Redline, that is good position to the short or indicating downtrend.
MTPSR has DI/ADX for every board, DI is a difference between DI+ and DI-, if the value is negative means downtrend, if the value is positive means uptrend.
HOW TO USE
Long Trading
The Support will be a good position to entry
The Resistance will be a good position to take profit
If in lower time frames, the candle keeps cross over the resistances, that means uptrend rally is happening.
Short Trading
The Support will be a good position to take profit
The Resistance will be a good position to entry
If in lower time frames, the candle keeps cross over the resistances, that means uptrend rally is happening, it is not good for short
Scalping Advice
If you scalp in day trading, it is recommended to watch Pivot/Support/Resistance on Timeframes 1D, 4D, and 1W
If the chart is sideways on the 1D pivot and the direction from support to pivot, that means the market wants to have a correction to closer support
If the chart is sideways on the 1D pivot and the direction from resistance to pivot, that means the market wants to have retest to closer resistance before another drop or breakout to continue the rally
Use can scalp on TF 15m or TF30m, the Pivot/Support/Resistance in lower timeframes can be so dynamic, so you have to pay more attention on trading strategy, you can use 2H and 4H Pivot/Support/Resistance as the target
You can also use Liquidation Long/Short boards for scalping trading strategy to take profit or cut lost
ALERTS
Every pivot board has alert which condition: if candle cross over or under support, resistance or pivot even KDJ cross over or under
Every liquidation board has alert which condition: if candle cross over or under every margin level
Example alert title for every board when candle cross over: Over Support TF 1, Over Resistance TF 1, Over Pivot TF 1, KDJ Up TF1
Example alert title for every board when candle cross under: Under Support TF 1, Under Resistance TF 1, Under Pivot TF 1, KDJ Down TF1
Feedback
Please drop a comment or send a direct message for any bugs or request new feature
I dont sell source codes, please not DM me about it
