Gunbot Machine Gun (trial version)Hello fellow Gunbotters, you have requested and I have delivered. Here is the trial version for Gunbot Machine Gun strategy.
Note:
1. This is the trial version so the customization settings are locked, subscribe to unlock features.
2. Green triangles = buy signals, Red triangles = sell signals.
3. Both buy and sell alerts are set-up so you can create alerts easily.
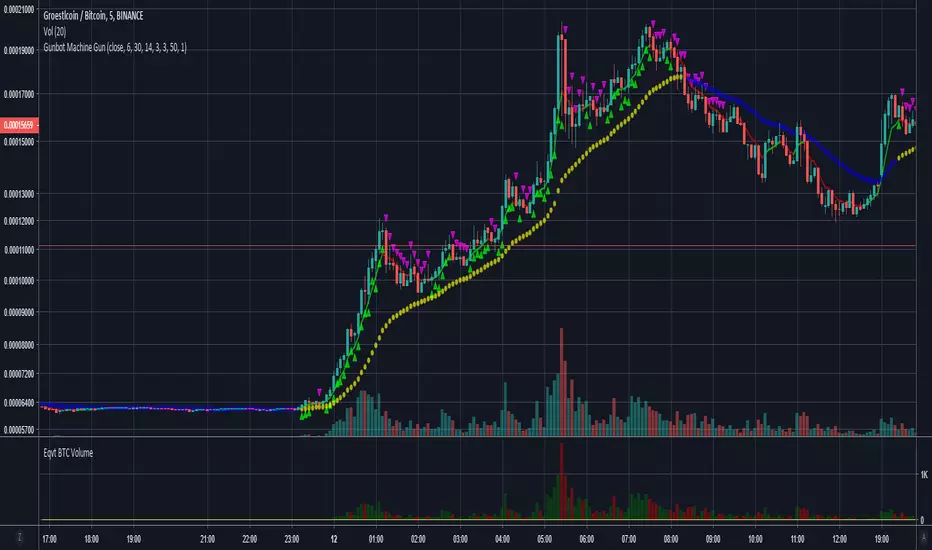
This is how the Gunbot Machine Gun works: I have 200 slots for alerts in Tradingview. I use all of those slots to set buy and sell alerts on BTC pairs. I have volatility filter in my script so the Machine Gun will only start firing out rounds (Buy alerts) when the volatility becomes high. Tradingview sends email to gmail. Gunbot waits for the email, once it reads it Gunbot will action the email (buy/sell depending on the message). Gunbot buys the coin based on email message received from Tradingview. It will be rapid fire, accumulating buys while coin is pumping up. Then when the dust settles and momentum starts dying, the script will throw a hand grenade (pink triangles), send a sell signal/email then Gunbot reads that email and executes the sell all trade.
Buys early during pumps. Finds coins that will pump soon. Sells at peak.
Legend:
Green triangles = buy signals
Pink triangles = sell signals
Note:
During period of low volatility there will rarely be any buy signals. The sell signals during this time is irrelevant (can only sell after you bought). But once high volatility is detected the script gets ready to activate. Then it starts sending buy signals close and during the pumps. Sells at peak.
Works on most coins and stocks.
Acciones

Gunbot Machine GunGunbot Machine Gun Strategy
This is how the Gunbot Machine Gun works: I have 200 slots for alerts in Tradingview. I use all of those slots to set buy and sell alerts on BTC pairs. I have volatility filter in my script so the Machine Gun will only start firing out rounds (Buy alerts) when the volatility becomes high. Tradingview sends email to gmail. Gunbot waits for the email, once it reads it Gunbot will action the email (buy/sell depending on the message). Gunbot buys the coin based on email message received from Tradingview. It will be rapid fire, accumulating buys while coin is pumping up. Then when the dust settles and momentum starts dying, the script will throw a hand grenade (pink triangles), send a sell signal/email then Gunbot reads that email and executes the sell all trade.
Buys early during pumps. Finds coins that will pump soon. Sells at peak.
Legend:
Green triangles = buy signals
Pink triangles = sell signals
Note:
During period of low volatility there will rarely be any buy signals. The sell signals during this time is irrelevant (can only sell after you bought). But once high volatility is detected the script gets ready to activate. Then it starts sending buy signals close and during the pumps. Sells at peak.
Works on most coins and stocks.
Honeybee59-stock 2.0Honeybee59-stock for TradingView gives you abilities to see the stories hiding in the graphs of stocks. It counts CC59 and creates respectable support and resistance levels as well as marks and reminds you about important parameters that are happening in the graph so that you will not forget to consider them before placing orders. This set of tools is a simplified version of Graph Reader Pro for TradingView customized for planning your investments in stocks.
Features:
*Automatic CC59 counting that compares the close of the right price bar to that of left price bar in a group of 5 consecutive bars (ignoring 3 bars in the middle). If the right bar closed higher, the count positive number would be printed above the bar. If the right bar closed lower, the count negative number would be printed below the bar. Nine consecutive series of up counts will define the lowest price as CC59 support line and nine consecutive series of down counts will define the highest price as CC59 resistance line. The counted numbers, support and resistance lines are automatically printed on the graph if enabled.
* Draw a reconfigurable simple moving average ( MySMA ) yellow line. The default setting is SMA3.
* Draw a popular SMA13 line (light blue).
* Draw a pullback level line (pink) near the beginning of a possible new trend.
* Print "C>MySMA" or "C70" and "RSI<70" for RSI(14) that crosses above 70 % and below 70 %.
* Print "RSI<30" and "RSI>30" for RSI(14) that crosses below 30 % and above 30 %.
* Print "Max" and "Min" for local maximum and local minimum bars.
* Print "Gap" when there is a gap between neighboring price bars. The opened gaps are often closed later on. Hence, they are milestones for the price to come back and close them up.
* Print "MACD>Sig" and "MACD Dark".
For free TradingView plan, you can add two more indicators to the chart. That means you may add RSI and MACD indicators with same parameters as those setup in Honeybee59-stock to your graph. DrGraph regularly publishes his educational ideas on using features provided in Honeybee59-stock for profitable investments. You can follow him for how to use the tools in trading stocks.

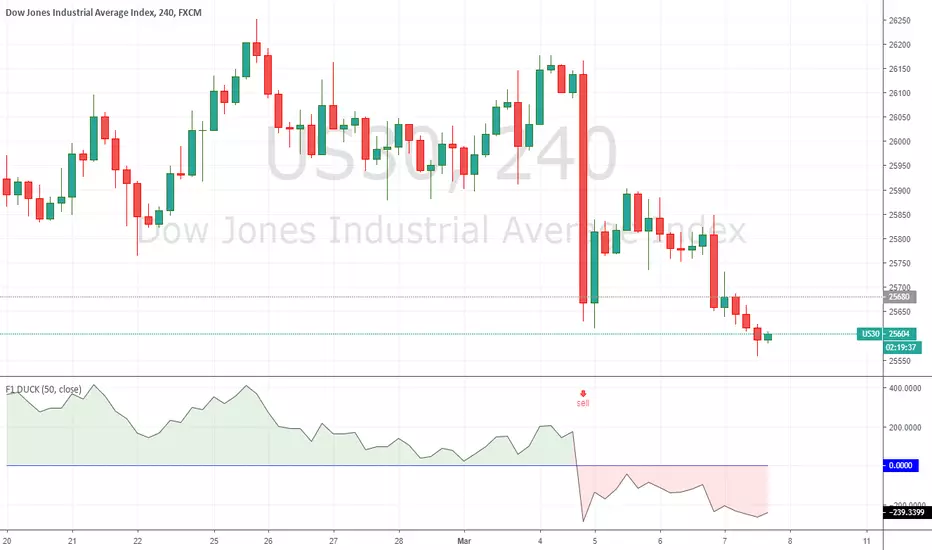
F1 DUCK - TAD SYSTEMTAD System
The acronym TAD stands for TURTLE, ATOM and DUCK.
With the TAD System, traders know when to BUY or SELL easily without any hassle.
The TAD System was founded by Mr Fred Tam, the principal lecturer in F1 Academy of Technical Analysis.
A revolution mechanical trading system designed to make trading easy for beginners and non-experienced traders.
The TAD System is basically a combination of 3 indicators which are included into the TAD System to make trading as simple as possible.
For more information and if you require access for the indicators please do not hesitate to contact us by dropping a message or visit us at:
f1traderacademy.com
Click on “Add to Favorite Scripts” to include the F1 DUCK indicator onto your charting platform.
How simple is the system?
With the three BUY arrows aligned accordingly with the TURTLE, ATOM and DUCK indicators, this triggers an affirmative BUY signal and vice versa.
With the three SELL arrows aligned accordingly with the TURTLE, ATOM and DUCK indicators, this triggers an affirmative SELL signal and vice versa.
The DUCK indicator is to be used alongside with the TURTLE and ATOM indicators.
As with all 3 indicators used alongside, it becomes the TAD System.
To complete your TAD System setup you still require:
To add the F1 TURTLE indicator as favorite script:
To add the F1 ATOM indicator as favorite script:
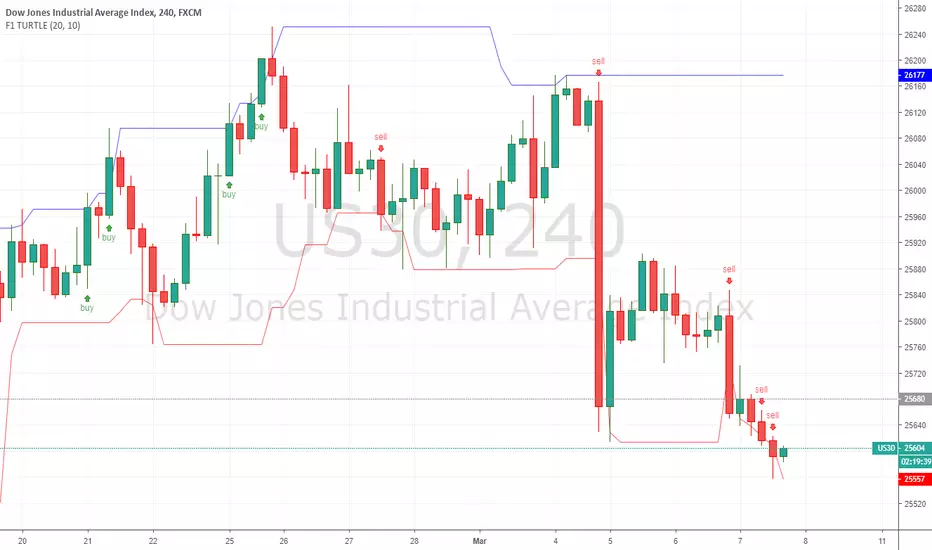
F1 TURTLE - TAD SYSTEMTAD System
The acronym TAD stands for TURTLE, ATOM and DUCK.
With the TAD System, traders know when to BUY or SELL easily without any hassle.
The TAD System was founded by Mr Fred Tam, the principal lecturer in F1 Academy of Technical Analysis.
A revolution mechanical trading system designed to make trading easy for beginners and non-experienced traders.
The TAD System is basically a combination of 3 indicators which are included into the TAD System to make trading as simple as possible.
For more information and if you require access for the indicators please do not hesitate to contact us by dropping a message or visit us at:
f1traderacademy.com
Click on “Add to Favorite Scripts” to include the F1 TURTLE indicator onto your charting platform.
How simple is the system?
With the three BUY arrows aligned accordingly with the TURTLE, ATOM and DUCK indicators, this triggers an affirmative BUY signal and vice versa.
With the three SELL arrows aligned accordingly with the TURTLE, ATOM and DUCK indicators, this triggers an affirmative SELL signal and vice versa.
The TURTLE indicator is to be used alongside with the ATOM and DUCK indicators.
As with all 3 indicators used alongside, it becomes the TAD System.
To complete your TAD System setup you still require:
To add the F1 ATOM indicator as favorite script:
To add the F1 DUCK indicator as favorite script:
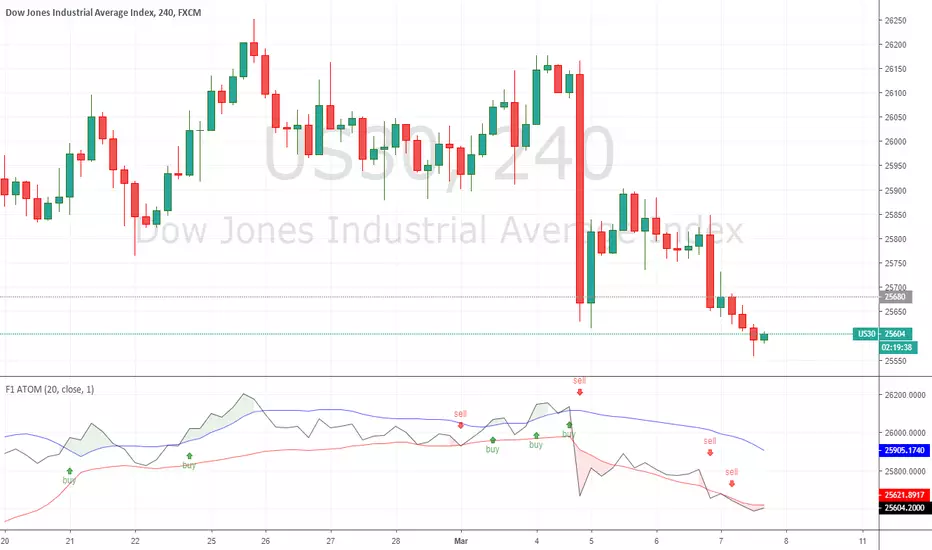
F1 ATOM - TAD SYSTEMTAD System
The acronym TAD stands for TURTLE, ATOM and DUCK.
With the TAD System, traders know when to BUY or SELL easily without any hassle.
The TAD System was founded by Mr Fred Tam, the principal lecturer in F1 Academy of Technical Analysis.
A revolution mechanical trading system designed to make trading easy for beginners and non-experienced traders.
The TAD System is basically a combination of 3 indicators which are included into the TAD System to make trading as simple as possible.
For more information and if you require access for the indicators please do not hesitate to contact us by dropping a message or visit us at:
f1traderacademy.com
Click on “Add to Favorite Scripts” to include the F1 ATOM indicator onto your charting platform.
How simple is the system?
With the three BUY arrows aligned accordingly with the TURTLE, ATOM and DUCK indicators, this triggers an affirmative BUY signal and vice versa.
With the three SELL arrows aligned accordingly with the TURTLE, ATOM and DUCK indicators, this triggers an affirmative SELL signal and vice versa.
The ATOM indicator is to be used alongside with the TURTLE and DUCK indicators.
As with all 3 indicators used alongside, it becomes the TAD System.
To complete your TAD System setup you still require:
To add the F1 TURTLE indicator as favorite script:
To add the F1 DUCK indicator as favorite script:
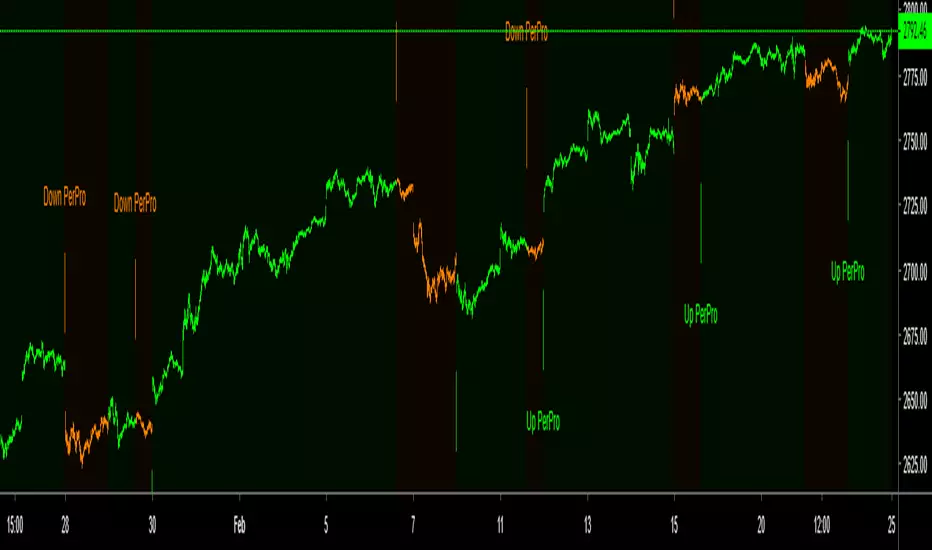
PerPro IndicatorThis is the version PerPro Strategy but in indicator, in this version you can configuration 1 minutes or 5 minutes time with 60 multi time frame set...
Try with your self what is the best configuration for you trading.

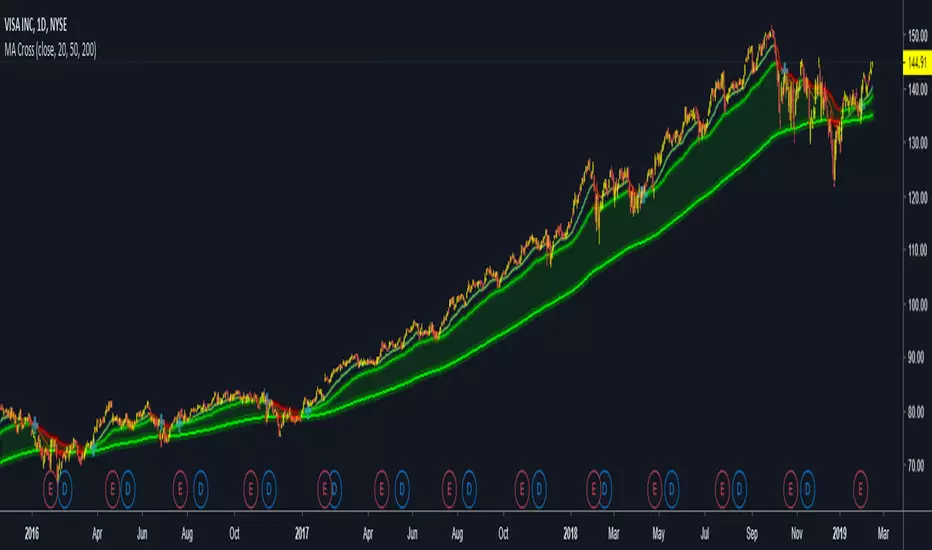
Volatile Stocks - Simple Strategy w/Profit and StopThis strategy is based off of a script I wrote for another highly volatile asset, cryptocurrencies. It prints BUY and SELL signals based off of inputs that you can specify. I used this script as a time saver. If there is no signal on the chart, I'm less interested in analyzing it.
BUY SIGNALS
Bullish EMA Cross
Positive MACD Cross
Single-candle gains
SELL SIGNALS
Profit %
Stop Loss %
Naturally, I don't trade based off of the BUY and SELL signals alone, but it does help me identify the most important charts to look at.

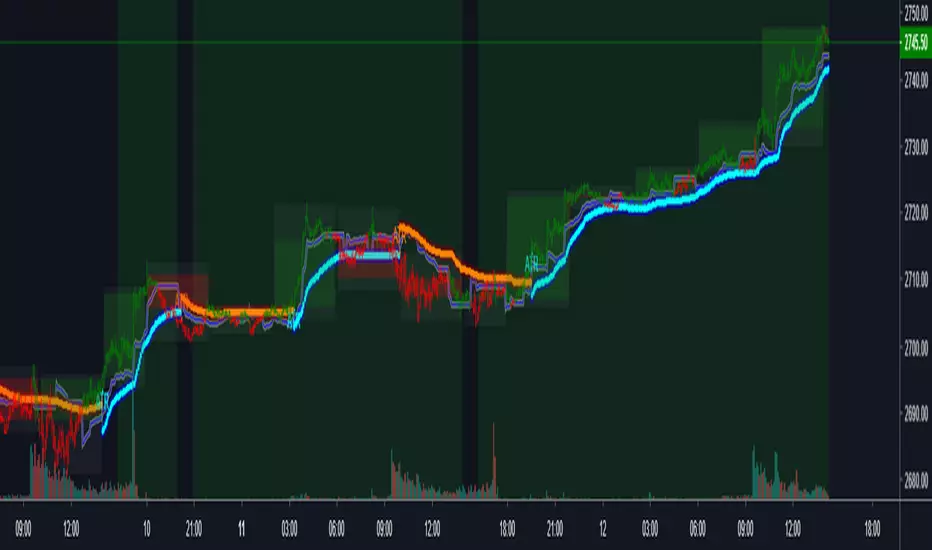
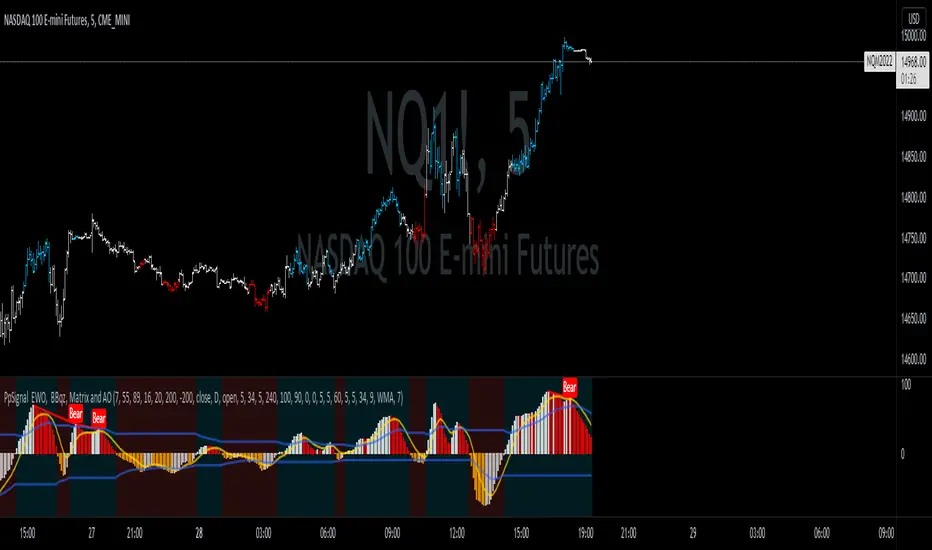
PpSignal Korean Strategysimple trading system for any time not exceeding 4 hours or D in stock.
configuration:
for futures, forex, bitcoin and assets that operate 24 hours, put the candle converter in D if you are in a chart less than 1H, for 4H charts and daily put candle coverter in W.
IF YOU ARE GOING TO OPERATE STOCK BONDS ETC. ONLY ONE-DAY ACTIVITIES DAY, USE THE CANDLE CONVERTER IN D ...
Operative
If the background is green, only take buy positions, the bars will be painted in lime color.
If the background is dark red, only take the beams of sell, the bars will be red
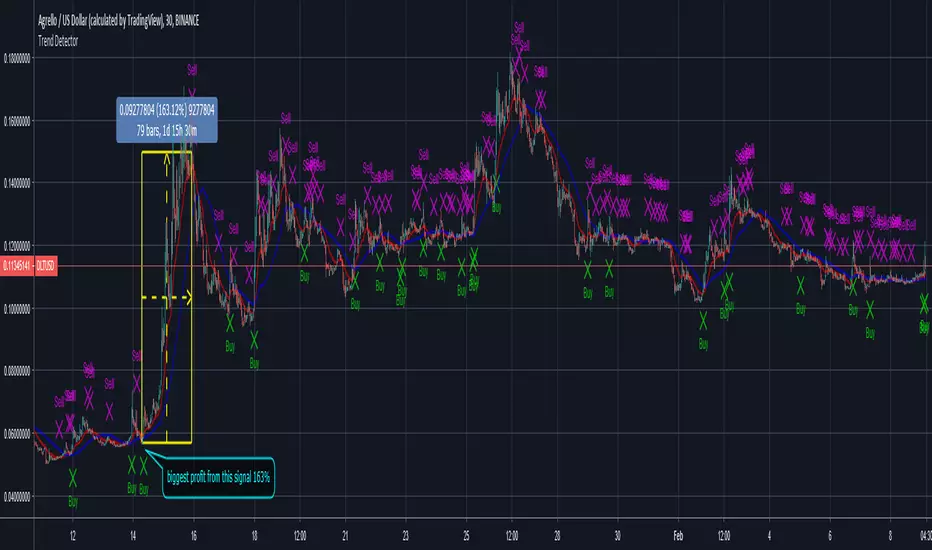
Trend Detector [Strategy]This is the Strategy for the Trend Detector to show the performance (real time, not delayed) on Agrello. Profit from backtesting is huge at 1,500% for daily charts. This was for 2 years of trading data on daily timeframe. It beats buy and hold no contest.
New indicator for today called Trend Detector, follows the trend. It shows buy signals when coin is going up, sell signals when it is going down. Indicator showed plenty of Buy and Sell signals at the right times for buying and selling DLT . This indicator works on real time so you get the email alerts on time so you can action it.
Message me if you are interested in using the Trend Detector Indicator and Strategy.

Trend Detector
New indicator for today called Trend Detector, follows the trend. It shows buy signals when coin is going up, sell signals when it is going down. Indicator showed plenty of Buy and Sell signals at the right times for buying and selling DLT . This indicator works on real time so you get the alerts on time so you can action it. Works on other cypto and stocks.
PPSignal Scalper Double Cross Signal and EWO Smooth V4.0Recomendation
-for grafic 4h and D use
PPS W Signal
EWO W Signal
-For signal 30 min to 3H
PPS D and W signal
EWO D Signal
For signal < 30 Min
PPS 1H and $h
EWO 1H

SampleInvitePublish - V1
This strategy is designed for trading stocks and crypto currencies on the long side.
It uses three different timeframes to determine the most profitable entry prices (Day, 4 hour and chart interval).
The strategy employs ten different setups to accommodate both range trading and trend following markets.
The system contains sophisticated algorithms that scale to varies chart intervals.
Tailored to perform best between 4 hours to as low as 10 minutes.
The entire system consists of three tools: HullbusterScope, HullbusterBacktest and HullbusterSignal.
Hullbuster scope is used to obtain configuration information about the market instrument which will be applied to the HullbusterBacktest.
Commit an iterative approach to the backtest tool until the simulated results match your entry and exit expectations .
Apply the HullbusterSignal to the chart and use the same backtest configuration to setup actual trading alerts.

Lazy Trend System 2019latest, more powerful and applicable on FX, indices, stocks and cryptocurrencies!

NAVI'S PERFECT TSIThe NAVI'S PERFECT TSI Indicator is the same as the True Strength Index (TSI) developed by
NAVI, except the SMI includes a signal line. The SMI uses double moving averages
of price minus previous price over 2 time frames. The signal line, which is an EMA of the
SMI, is plotted to help trigger trading signals. Adjustable guides are also given to fine
tune these signals. The user may change the input (close), method (EMA), period lengths
and guide values.
You can use in the xPrice any series: Open, High, Low, Close, HL2, HLC3, OHLC4 and ect...

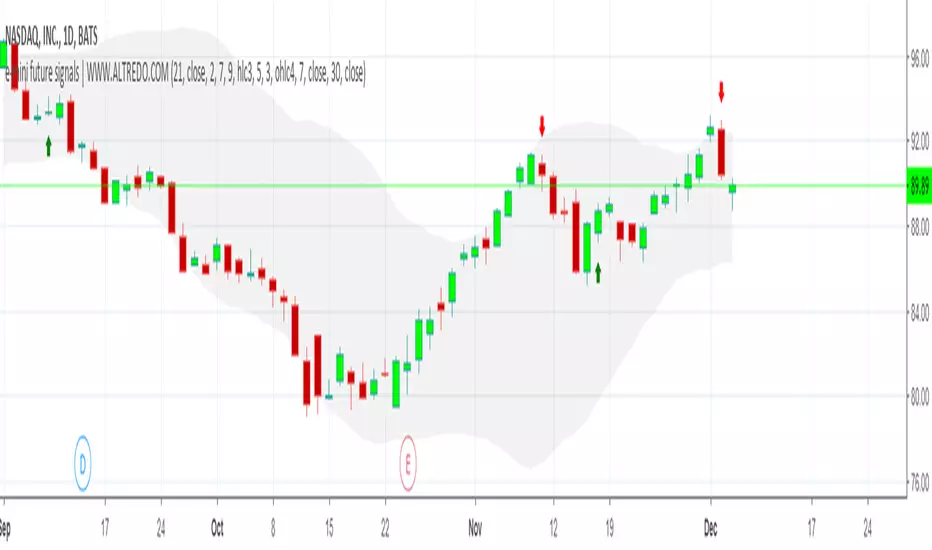
NASDAQ 1D TRADING SIGNALS | DAY TRADING SIGNALSNASDAQ 1D TRADING SIGNALS FOR SHORT-TERM AND MEDIUM-TERM TRADING!
✅ Based on trend analysis, includes Moving Average, Volatility indicators.
✅ This strategy can be used alone or alongside other strategies for better success.
✅ Real-time NASDAQ trading signals
The indicator provides an easy and fast way to determine the trend direction and possible reversals.
Green : Uptrend. Long trading
Red : Downtrend. Short trading
Stock Market Indices Correlations HeatmapHello friends,
I'm excited to share one of my insightful tools. This indicator visualizes how major global stock indices move relative to your selected instrument, helping you instantly spot market-wide strength, weakness, or divergence.
🛠 How It Works
The indicator calculates Pearson correlation coefficients between your selected symbol and 28 major stock indices , including S&P 500, NASDAQ, DAX, NIKKEI, and many more. Each color is selected according to the correlation value:
Green hues show positive correlations (instruments moving together).
Red hues show negative correlations (instruments moving in opposite directions).
Lighter or transparent colors indicate weak or no correlation.
You can customize the correlation lookback period (default 14 bars ), select your preferred data source (close, open, etc.), and choose from multiple professional color palettes to best match your charting style.
🔥 Key Features
Comprehensive Global Coverage — Correlations across 28 major indices from North America, Europe, and Asia.
Multiple Palettes — Choose from 8 professional color palettes (Blue/Red, Spectral, Viridis, etc.) for better visual clarity.
Adjustable Lookback — Set correlation calculation period from 1 to any number of bars.
Dynamic Data Requests — Real-time updates for all tracked indices using TradingView's request.security.
Smart Alerts — Receive alerts when all indices align positively or negatively — a sign of broad market sentiment extremes.
Performance Optimized — Efficient data handling ensures smooth operation even with multiple requests per bar.
Enhanced UI — Streamlined settings panel for fast palette and source adjustments.
Non-Repainting — Uses only historical data, ensuring stable readings.
If you'd like access or have any questions, feel free to reach out to me directly via DM.
👋 Good luck and happy trading!
Script de pago

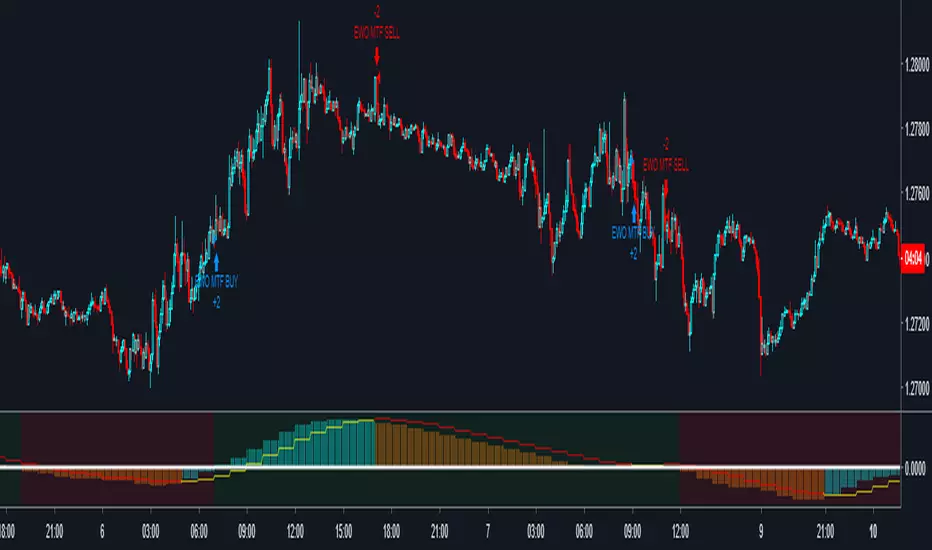
PpSignal EWO LBR MTFEwo mtf strategy.
(tf) superior time frame configuration in input window
Configuration
Forex and crypto :
For time 1 min use tf 30 min
for time 5 min use tf 60 min
for 15, 30 and 60 min use tf 240
Stock:
For time 1 min use tf 30 min
for time 5 min use tf 60 min
for 15 and 30 min tf 240.
For 60 tf D.
For D tf W
For W tf M
UVTrader StratejiIf you see "AL", you can buy.
If you see "SAT", you can sell.
You can use all charts, but 4H and 1D charts are very well.

U.S. Stocks & Options CVI to Bitcoin Correlation [NeoButane]Conceptual indicator based on trying to find an inverse correlation between bitcoin and traditional markets due to bitcoin's usefulness as a hedge against economic downturns.
How to use this script: you look at it and see if there is a correlation or not between bitcoin/Ethereum price and either U.S. stock CVi, buy volume, sell volume, calls, puts, or the call/put ratio.
