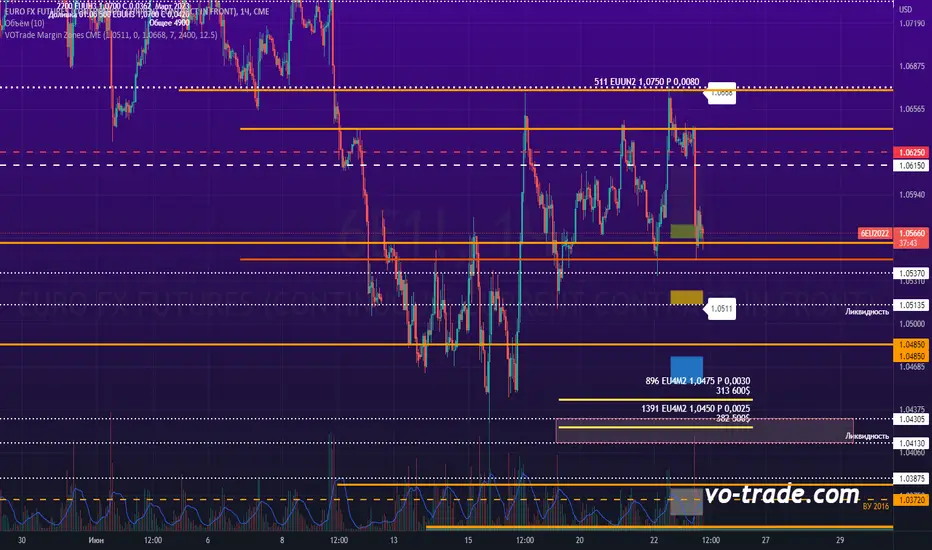
VOTrade Margin Zones CMEMargin zones are zones that are strong support and resistance levels and on the basis of which further movement of a trading instrument can be assumed. Margin zones are built based on the levels of margin requirements for futures of the Chicago Mercantile Exchange (CME), which corresponds to a specific trading instrument on the spot market. The margin requirement levels form a certain amount of the futures move (and therefore the corresponding currency pair), conditionally this can be called the volatility that the market maker sets for the trading instrument.
Margin zones in trading are the areas to which the price reacts, and the closing of the day (the American trading session) below or above a certain level signals to us about the potential of a further trend (this is one of the classic rules based on observation and statistics collection, but you can use the zones as a kind of volatility move in other ways).
Buscar en scripts para "zone"
MTF Stochastic Zones w/ Candle and Swing Hi/Lo IndicatorsMTF Stochastic Zones w/ Candle and Swing Hi/Lo Indicators by // © KaizenTraderB
This indicator will display the Stochastic RSI as color zones utilizing 3 Timeframes of your choice as well as key reversal candles:
Entry Timeframe StochRSI Crossovers and Long Wick Reversal Candles (Hammer and Hanging Man) and Engulfing Candles
That correlate with Swing Highs and Lows.
When the higher timeframe is bullish it will be green and when bullish, red.
When the middle timeframe is counter the higher, it will appear brownish.
The entry timeframe will print Candle Labels and Swing Highs and Lows at bullish and bearish Stochastic RSI crossovers when oversold and overbought, respectively,
In the direction of the higher timeframe directional bias when the middle timeframe is counter that direction to catch reversals in corrections.
(It also prints Bull/Bear StochRSI Crossovers that correlated with Swing Highs and Lows that are not Hammers, Hanging Men or Engulfing Candles.)
The options allow you to turn the zones, swing highs and lows, candle indicators and entry StochRSI Crossovers on and off, as well as which Timeframes you choose to view.
Entry - 1Hr, 15m, 5m or 1m Middle Timeframe - Daily, 4Hr, 1Hr or 15m Higher Timeframe - Monthly, Weekly, Daily, 4Hr or 1Hr
You can change the Swing High and Low Lookback periods, as well as
The Stochastic RSI Lookback for each of the three timeframes and the level of Overbought and Oversold:
When 8 is chosen for RSI Lookback, Stochastic Lookback = 5, SmoothK = 3, Smooth D = 3 For 13 - 8, 5, 5 For 21 - 13, 8, 8 For 34 - 21, 13, 13
Its good practice to adjust settings so Higher Timeframe zones (green/red) correlate with longer trend movements,
Medium Timeframe with corrections and reversal areas (brown) and Entry Timeframe with key reversal candles.
For example, to adjust the Daily Higher Timeframe, turn the Higher Timeframe to Daily, turn off the others and bring up the Daily Chart.
Look at chart for last 200 bars or so and go through the different settings until you find the one that best correlates with recent past price action.
Do the same procedure for the Middle and Entry Timeframe. Once all the settings are how you prefer, view the Indicator on the Entry Timeframe to find trades.
Coding included to prevent repainting
Can be used in conjunction with the MTF Stochastic RSI w/ Zones which is displayed in the lower panel.
Need the same settings in both indicators for them to correlate or use different settings for different views,
Message me with feedback to improve upon this indicator or requested additions.
I will soon be releasing a Strategy based on this indicator!

Fibonacci Pivot ZonesFibonacci Pivot Zones make use of the average price between the high, low & close of the previous session, while adding deviations based on Fibonacci numbers to form support and resistance zones, which can be used as targets for intraday and swing trading.
You can select the timeframe for the zones, for example 12 hour pivots to trade in 15m timeframe, or even monthly pivots to trade on the daily timeframe.
You can choose the different fibonacci levels on the menu, by default these are:
0.382
0.618
0.782
1
Enjoy!
Initial Balance Markets Time ZonesThe below script is based on Initial Balance.
Initial Balance is based on the highest and lowest points of Price Action (PA) within the first 60 minutes of trading. There is so much information available online, reference Initial Balance, that I have not provided a reference.
Most indicators I have seen have been solely based on UTC 0000 Initial Balance. My aim with this indicator was to be able to visualize how other time zones market openings Initial Balance affect PA.
The three market openings I chose to code in are:
London 0800 to 0900
New York 1430 to 1530
Asia 0000 to 0100
Within the script I have given the user the option to select to see with a green or red background when PA is above all zones Initial Balance high (green) or PA is below all zones Initial Balance low (red).
Alerts are also coded in, to prompt the user that PA has gone above or below as per above.
The Initial Balance high and lows also offer another form of areas of confluence.
Below are some examples of IB in action:
LTC
NULS
UNFI
DEXE

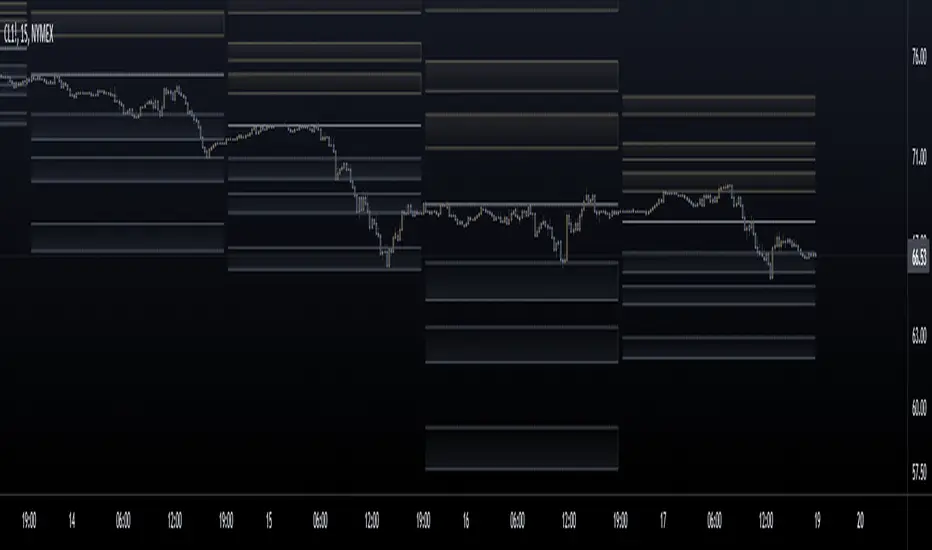
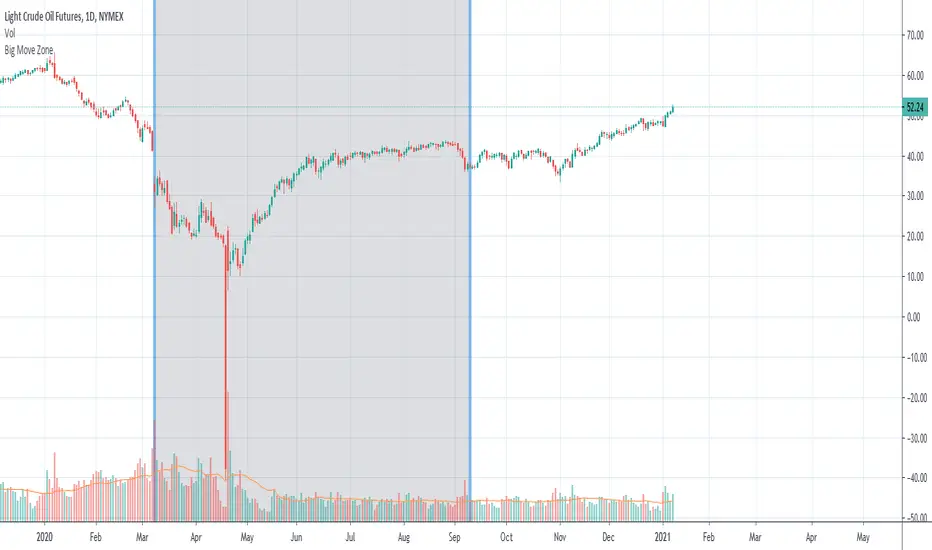
Big Move Finder Outlier ZoneA way to find if price made a big move in a user input given amount of time ago. If it made a move more than the given percent amount, a colored zone will be placed until a given amount of length finishes taking place, and then it will stop coloring the zone. This helps filter out or find stocks that are making or have made too big a price move or were too volatile in the past.
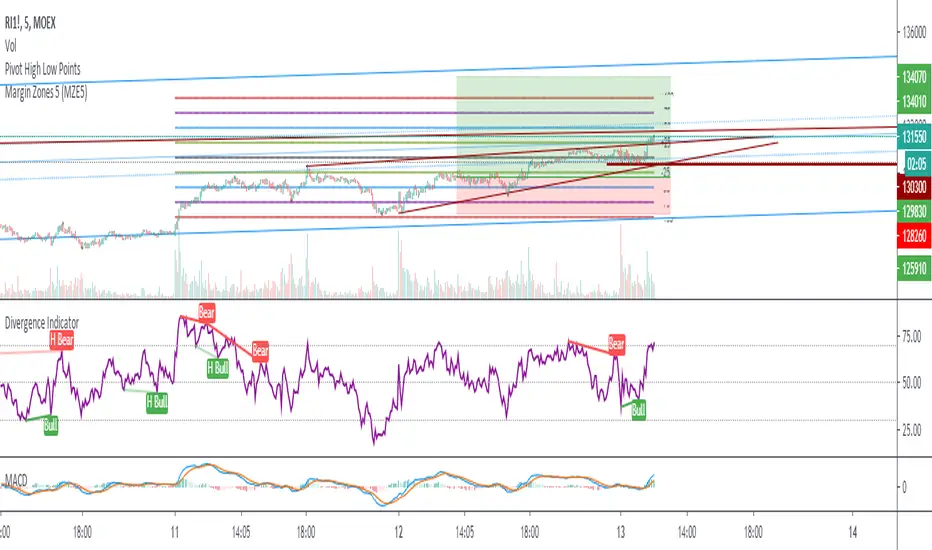
Margin Zones 5 (MZE5)Extended version of MZE script.
This indicator can be set up for 5 different tickers, so you can fill up your favourite tikers as fixed and switch between them without changing settings options of Tick Count, Margin and POC
Using option "Show default Zones if not Matched" - you can set up default options,
switching off "Show default Zones if not Matched" - will hide indicator for not matched tikers
By default option is Off
RUS:
Расширенная версия индикатора MZE, которая позволяет сделать настройки одновременно для 5 разных тикеров, соответственно переключаясь между отслеживаемыми тикерами не нужно каждый раз менять настройки. Достаточно один раз настроить базовые настройки к любимым тикерам и только корректировать значение Маржи и Обеспечения.
Используя Опцию "Show default Zones if not Matched" ("Показывать, когда нет совпадения") - индикатор будет отображаться для всех тикеров с настройками по умолчанию.
И наоборот (по умолчанию): при снятой галочке - индикатор будет отображаться только на тех тикерах, к которым привязан, и не будет мешать на остальных
Target Zones & RibbonsTrend based on moving averages, indicated by ribbon, and profit zones based on re-tracement zones of Fibonacci.
Target Zones
- 38% is TP1 - first line break
- 62% is TP2 - second line break
Ribbon can be used to identify the trend:
-Price action below ribbon is bearish
-Price action above is bullish
-Price will likely bounce off ribbon once for a continuation of trend, unless trends breaks ribbon, signals for reversal.
Please PM me for use, testing only.
This indicator is meant to be used with the following.

[AU] Zones// Zones v1
//References:
//@chrysopoetics:
//@chrysopoetics:
v1 of Zones; Default lengths for Anchor Zones subject to change/refinement for specific timeframes in the future

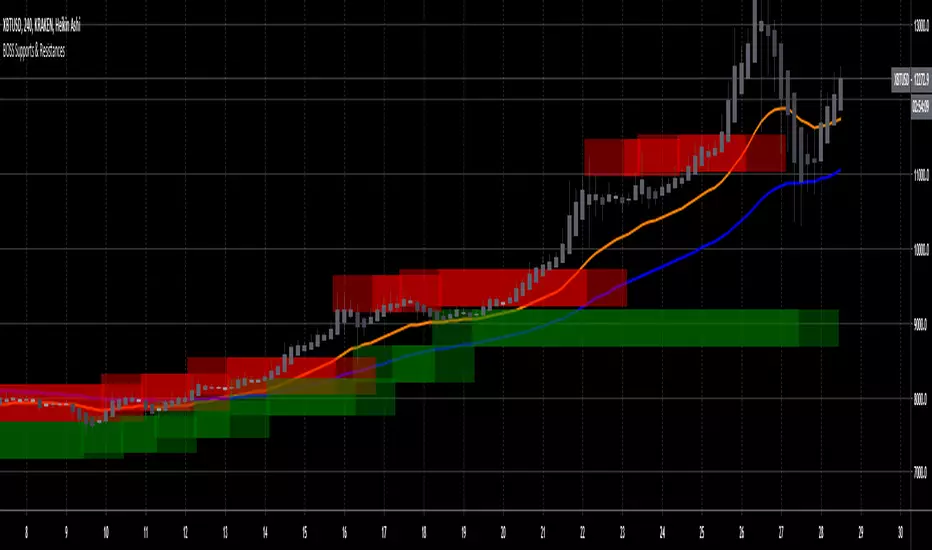
Boss Support and Resistance zonesTHE BEST FOREX, BINARY OPTIONS, AND CRYPTO INDICATORS FOR TRADINGVIEW.COM
Green = Support Zones
Red = Resistance Zones
The basic trading method for using support and resistance is to buy/long near support in uptrends, and to sell/short near resistance in downtrends.
Also included in this indicator are a Higher High, Lower High, Higher Low, and Lower Low indicator as well as Fast and Slow EMA'S
Available at bosscripts.com
Website bosscripts.com
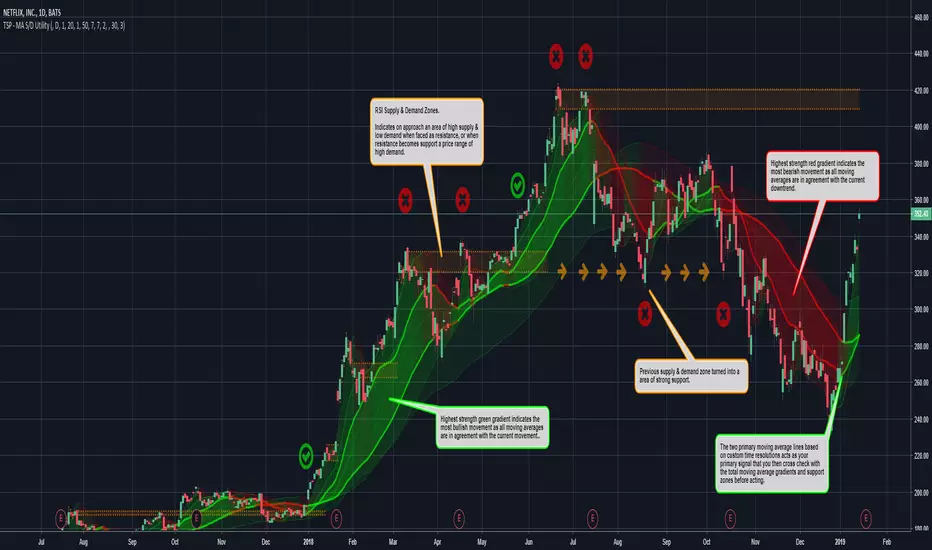
TradeSpot Pro - Advanced MA & Supply/Demand Zone UtilityTradeSpot Pro - Advanced MA & Supply/Demand Zone Utility
I have been using this script recently as an accompanying utility to my other means of finding entries and exits to trades, which so far has proved quite successful.
Multiple MA's able to be deployed with custom timeframes.
RSI based supply and demand zones to help locate future resistance and support lines.
Fantastic tool to help aid trading decisions whether bullish or bearish on the current market.
Please leave a comment and feedback on improvements or features you would like added and i'll see what I can do.
I hope you enjoy using it!
Donations
If you enjoyed using this free indicator and want to buy me a beer, please use the following address:
ETH Wallet: 0x78c130595A468db1fA9E2A86F4fbaA0813bA3CE4
Please note this is completely optional,
Thank you and happy trading!
Gap finder (gold minds)This tool highlights where gaps happens and outlines in the chart where the gap zones are. If there is a gap up there is a green line, a gap down it is red. The gap zone is highlighted in blue. You can choose the size of your gap with the input menu to the desired size. Feel free to ask comment below. Made for the Gold Minds group

MTI Stochastic RSI with Color Bars and ZonesPlots the %D line of a Stochastic Oscillator calculated from the RSI of close of length 14.
Red Sell Zone above 80, candles paint red
Green Buy Zone below 20, candles paint green

Unmitigated Liquidity ZonesUnmitigated Liquidity Zones
Description:
Unmitigated Liquidity Zones is a professional-grade Smart Money Concepts (SMC) tool designed to visualize potential "draws on liquidity" automatically.
Unlike standard Support & Resistance indicators, this script focuses exclusively on unmitigated price levels — Swing Highs and Swing Lows that price has not yet revisited. These levels often harbor resting liquidity (Stop Losses, Buy/Sell Stops) and act as magnets for market makers.
How it works:
Detection: The script identifies significant Pivot Points based on your customizable length settings.
Visualization: It draws a line extending forward from the pivot, labeled with the exact Price and the Volume generated at that specific swing.
Mitigation Logic: The moment price "sweeps" or touches a level, the script treats the liquidity as "collected" and automatically removes the line and label from the chart. This keeps your workspace clean and focused only on active targets.
Key Features:
Dynamic Cleanup: Old levels are removed instantly upon testing. No chart clutter.
Volume Context: Displays the volume (formatted as K/M/B) of the pivot candle. This helps you distinguish between weak structure and strong institutional levels.
High Visibility: customizable bold lines and clear labels with backgrounds, designed to be visible on any chart theme.
Performance: Optimized using Pine Script v6 arrays to handle hundreds of levels without lag.
How to trade with this:
Targets: Use the opposing liquidity pools (Green lines for shorts, Red lines for longs) as high-probability Take Profit levels.
Reversals (Turtle Soup): Wait for price to sweep a bold liquidity line. If price aggressively reverses after taking the line, it indicates a "Liquidity Grab" setup.
Magnets: Price tends to gravitate toward "old" unmitigated levels.
Settings:
Pivot Length: Sensitivity of the swing detection (default: 20). Higher values find more significant/long-term levels.
Limit: Maximum number of active lines to prevent memory overload.
Visuals: Toggle Price/Volume labels, adjust line thickness and text size.

Prev Day & Prev Hour Fibo Zones (Normal + Reverse)this works on previous day and hour fibb golden zone

Value Zones Indicator. Value Zones Indicator blends RSI-based momentum exhaustion, distance from the 200-day moving average, and position within a 2-year moving-average valuation band to quantify multi-horizon market stretch.
These components are normalized, averaged, inverted, and smoothed to form a regime-level “temperature” that distinguishes depressed, mean-reversion-favorable conditions from extended, higher-risk environments, with shaded zones highlighting historical extremes for macro risk-on / risk-off timing.
Works best on 1D TOTAL:INDEX, But not limited to does work across multiple assests, Just remember the lower down the MC ladder the less signal you will receive.
As always no one indicator is perfect, So best stacked with others to produce most alpha.
As always enjoy!!

POI Zones with Imbalance- Ahmed AwadHighlights Point of Interest (POI) zones on the chart where a significant price imbalance occurs between the candle’s open and close. The indicator draws semi-transparent orange zones to mark potential buy or sell areas, helping traders spot strong price moves and key levels. Adjustable imbalance threshold and transparency for flexibility.

Gap Zones with Unfilled AreasA very efficient scalping strategy for BTC. Both for the sell and buy. Take the trade when the price retraces back into 50% of the zone and and aim for a an easy 1:2

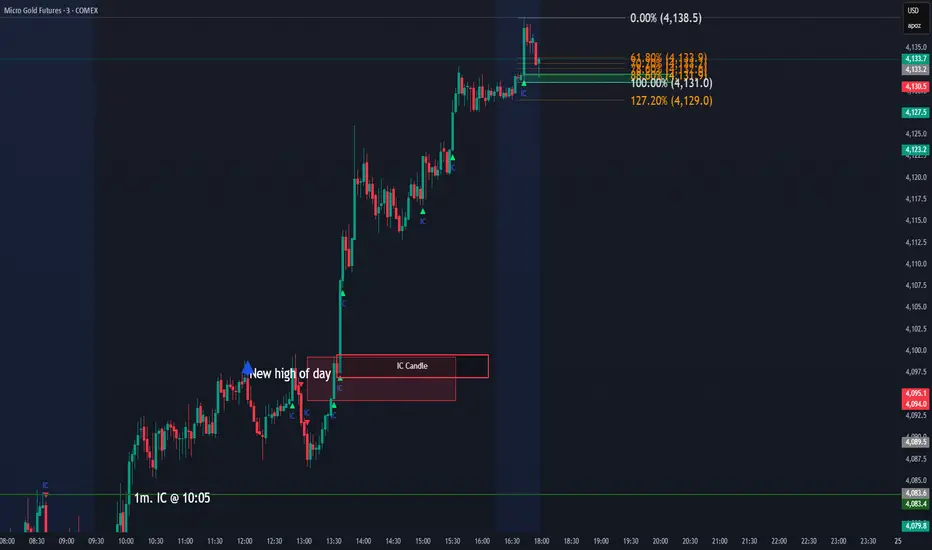
IC Opposite Candle Zones – BOXESWhat this does
✔ Detects bullish & bearish institutional candles
✔ Finds the last opposite candle before it
✔ Creates a zone using that candle’s full wick range
✔ Draws it with actual boxes that extend forward
✔ Deletes old boxes so your chart doesn’t get cluttered
TNT TRADER Sessions and Zones Premarket sessions and zone indicator full customization for premarket, yesterdays high and low , london, asia after hours etc.
R Dominant Range [CRT] by Sergi SernaR Dominant Range identifies the most influential R range located to the left of the current price action. It highlights the dominant zone that still impacts market behavior, helping traders understand which range is controlling the current structure.

Phoenix Smart ZoneThe Golden Trend Cloud Indicator is a professional trend-identification tool that combines Ichimoku Cloud with a 20-period Moving Average (MA20) to clearly define the market’s dominant direction.
It visually highlights bullish and bearish momentum using dynamic support and resistance zones derived from the Kumo cloud structure.

ICT Daily Levels & Liquidity Zones [HatefBW]ICT Daily Levels & Liquidity Zones
This indicator automatically detects and plots the daily high and low levels for the current day and the two previous days.
Each level dynamically tracks the exact candle that created it, allowing traders to identify where short-term liquidity pools form across multiple timeframes.
What makes this tool unique:
• Three-day structure: Displays current, previous, and 2-day-old highs/lows for contextual price action.
• Dynamic mapping: On lower timeframes, each level aligns precisely with the candle that created the daily high or low.
• Full customization: Traders can toggle each day’s levels, colors, label size, and extension behavior independently.
• Adaptive logic: Lines automatically extend or stay fixed depending on the chosen setting, avoiding chart clutter.
This tool helps ICT traders and smart money practitioners visualize daily liquidity zones — potential areas of stop hunts or institutional targeting.
The script is originally coded by @HatefBW from scratch, with no reused or modified open-source code
