Trend + Fibo Zone + Session Monitor🎯 FEATURES
📊 DASHBOARD:
H4 TREND: BULL / BEAR / NEUTRAL
FIBO ZONE: IN ZONE / OUT ZONE (GOLDEN ZONE) 50-61.8%
SESSION: LONDON/NY / ASIA/NIGHT
PRICE LEVEL: Position vs. Fibonacci
📈 VISUALIZATION:
Colored Fibonacci Levels
Highlighted 50%-61.8% Zone
Trend indicator (columns) can be removed if not needed or for a clearer chart
Real-time labels
Buscar en scripts para "zone"

LGZ – Liquidity Gravity Zones v1 📌 LGZ – Liquidity Gravity Zones (SVI + Net CVD + Volume)
Original Liquidity-Driven Price Magnet Model by Thomas Aaroon
📘 Concept Overview
LGZ (Liquidity Gravity Zones) is a new, original liquidity-based price-attraction model built using three core components:
SVI (Shock Volume Index) – measures abnormal volume spikes at each strike
Net CVD (NCP = CE_CVD − PE_CVD) – the real directional order-flow imbalance
Total Volume (CE + PE) – true liquidity density at each strike
Using these three elements, the indicator calculates Liquidity Gravity Weight (LGW) for every strike and identifies the strongest zones that attract price during the session.
🧠 Why This Indicator?
Traditional OI-based methods (long build-up, short build-up, OI change etc.) often lag.
LGZ focuses only on:
Real traded volume
Actual buy/sell aggression (CVD)
Shock events
Dealer hedging pressure
Strike-level liquidity clusters
This makes it far more responsive for intraday traders.
⭐ Core Formula
Liquidity Gravity Weight (LGW)
LGW = |SVI| × |Net CVD| × Total Volume
Where:
SVI = Shock Volume Index (Z-score based)
Net CVD (NCP) = CE_CVD − PE_CVD
Total Volume = CE_volume + PE_volume
LGW indicates how strongly a strike is pulling price toward it.
🎯 What the Indicator Shows
✔ Top Liquidity Gravity Zones (LGZ-1, LGZ-2, LGZ-3)
These are the strongest price magnets for the day.
✔ Gravity Lines on Chart
Each LGZ is plotted as a horizontal magnet line extending to the right.
✔ Strike-Level Liquidity Table
Shows:
Strike
SVI (Shock intensity)
LGW (Gravity strength)
This table gives a complete picture of the intraday liquidity landscape.
📈 How to Use (Intraday Trading Strategy)
🔵 1. Price gravitates toward LGZ-1
If price is below LGZ-1 → upward pull
If price is above LGZ-1 → downward pull
🔵 2. LGZ Flips = Trend Change
If LGZ-1 suddenly jumps to a different strike:
→ strong trend acceleration
🔵 3. LGZ Cluster = Reversal / Consolidation Zone
Multiple LGZ levels around the same strike indicate
→ liquidity saturation → reversal or slowdown.
🔵 4. Combine with Price Action
Best clarity on 5-minute timeframe
Use 1-minute only for entry.
🔬 Why LGZ Works
The indicator models the same reality driving option markets:
Where option volume + orderflow (CVD) + shock liquidity concentrate,
market makers hedge, and price moves toward that strike.
This is the foundation of dealer hedging mechanics and liquidity-based price movement.
🔧 Inputs
Symbol prefix (e.g., NIFTY)
Expiry (YYMMDD)
Center strike & range
Number of gravity zones
Color customization

PA + Big Candle Zones + EMA Pack (14/100/200/720) • TH v2.0PA + Big Candle Zones + EMA Pack (14/100/200/720) • TH v2.0
What it does
EMA Pack: 14/100/200/720 เลือกสไตล์เส้นได้ เปิด–ปิดเป็นรายเส้น
Price Action 10 แบบ: Bull/Bear Engulfing, Hammer, Shooting Star, Morning/Evening Star, Tweezer Bottom/Top, Bull/Bear Marubozu
Double Bottom (คอเสื้อ): เลือกยืนยันเฉพาะ “ปิดเหนือคอเสื้อ” ได้
BJ Key Levels: รวมระดับเป็นคลัสเตอร์ตาม % + เช็ก “ราคาใกล้ระดับสำคัญ”
Donchian Channel: ขอบบน/ล่าง + Midline เปลี่ยนสีตามฝั่งราคา (มีสัญญาณครอส BUY/SELL)
Big Candle Zones (Supply/Demand): ตรวจแท่งใหญ่ (ATR*k หรือ Body/Range), รวมโซน, อายุโซน, break buffer, แสดงเฉพาะ N โซนที่ใกล้ราคา
RSI: แถบ OB/OS + Regular Divergence (จุด/เส้น) + ตาราง RSI มุมจอ
Volume Profile (Fixed Range): POC + Value Area (อัปเดตแถบล่าสุด)
How to use (quick)
ดู Bias จาก Donchian Midline (เขียว=เหนือ, แดง=ใต้)
หา PA ฝั่งเดียวกับเทรนด์ใกล้ Big Candle Zone (Demand/Supply)
ถ้ามี BJ Near หรือ RSI Divergence ใช้เป็นตัวกรองจังหวะเข้า/ออก
วาง SL/TP ด้วยขอบโซน, Midline/ขอบ Donchian, POC/VA
Important inputs
Double Bottom: Pivot L/R, min bars apart, tolerance %, require close above neckline
Big Candle: ATR Len/Mult, Body/Range, EdgeFrac, (Option) Vol≥SMA20*k, Max zones near price, Expire bars, Break buffer %
BJ: Pivot L/R, Min touches, Cluster %, Near %, Max levels, Extend right
Donchian Len, RSI 14 (OB/OS/Extreme), VP: Bars/Rows/VA%
Alerts included
PA ทั้งหมด: Engulfing, Hammer, Shooting Star, Morning/Evening Star, Tweezer Bottom/Top, Marubozu
Double Bottom: (Confirm) / (Bottom#2)
BJ: Price near key level
Donchian Midline: BUY / SELL
RSI: Overbought/Extreme, Oversold/Extreme, Bullish/Bearish Divergence, Crossback
Notes
สัญญาณที่พึ่งพา pivot (Double Bottom/RSI Div) ยืนยันช้าตามธรรมชาติ
โซน Big Candle ถูก “รวม/หมดอายุ/ลบเมื่อเบรก” อัตโนมัติ
อินดี้นี้เป็นเครื่องมือช่วยตัดสินใจ ไม่ใช่คำแนะนำการลงทุน

Order Block Zones (Multi, Retest Highlight & Invalidation)A easy OB identificator with the conditon that it should be followed with at-least three strong/weak candles. Highlighted when re-tested (search for entry) and unvalidated once the "opposite" candle closes above/under the zone. Zones valid for 5 days then deleted.
V0.1

[Hosein] Support & Resistance Zones + FVGAdjustable FVG gap size and extension.
Option to ignore narrow gaps.
Option to ignore fully crossed gaps.
Show/hide FVGs.
Customizable colors with initial opacity.
Ideal for traders looking for supply/demand imbalance zones.

Smart Inside Bar Zones by Dinkan🔹 How It Works
An Inside Bar is formed when a candle’s high and low are completely within the previous candle’s range.
The indicator detects this structure in real time, creates a visual box around it, and extends the zone until the pattern is broken.
Inside Bar candles can be optionally highlighted with a custom color to make them stand out clearly on the chart.
🔹 Features
✅ Automatic Inside Bar detection
✅ Dynamic Inside Bar zone boxes with custom fill & border color
✅ Inside candle body highlighting with user-defined color
✅ Adjustable transparency and border style
✅ Option to display only the latest Inside Bar zone for cleaner charts
🔹 Usage
Traders can use Inside Bar zones to:
Study price compression and breakout regions
Observe range behavior and trend continuation setups
Combine with other tools like volume or support/resistance analysis
🔹 Customization
Change box fill and border color
Adjust Inside Candle color for better visibility
Set transparency and choose whether to show all or only the latest box
⚠️ Disclaimer
This script is intended for market structure visualization and educational purposes only.
It does not generate trading signals or financial advice.
Always perform your own analysis and risk management before making trading decisions.

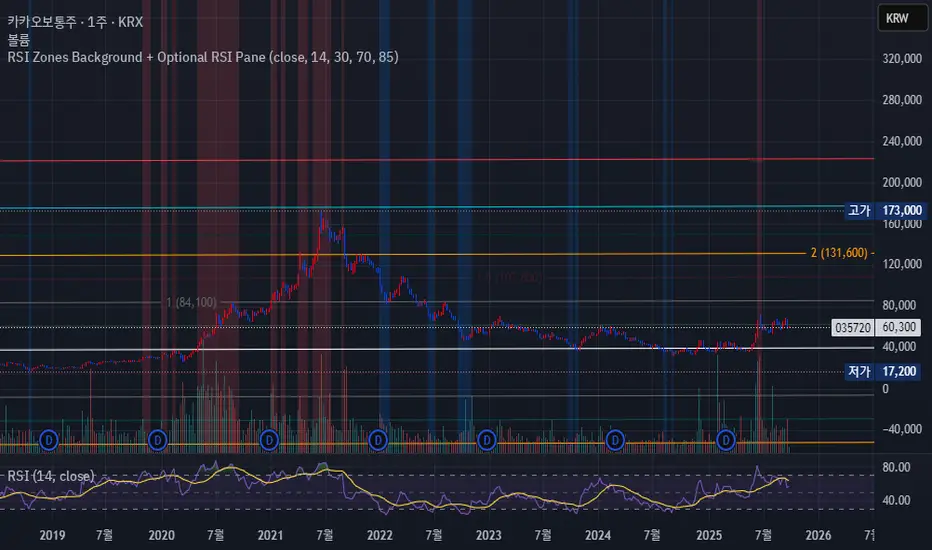
RSI Zones Background + Optional RSI PaneOverview
This Pine Script indicator does two things at once:
Colors the background of the main price chart whenever the RSI value is below a lower threshold (default 30) or above an upper threshold (default 70). This highlights oversold and overbought zones directly on the price chart itself.
Optionally displays a separate RSI panel with the RSI line and shaded region between the two threshold levels for reference.
The indicator is fully customizable through the settings panel—color choices, transparency, and whether to show the separate RSI pane can all be adjusted.
Key Parts of the Code
1. Inputs
src: The source price series for RSI calculation.
len: RSI lookback length (default 14).
lowerThr and upperThr: The lower and upper thresholds (defaults: 30 and 70).
lowColor and highColor: Colors for the background when RSI is below or above the thresholds.
bgTrans: Transparency level for the background shading.
showRSI: Boolean to toggle the optional RSI pane on or off.
2. RSI Calculation
rsi = ta.rsi(src, len)
This computes the RSI from the chosen price source.
3. Background Coloring on the Price Chart
bgCol = rsi <= lowerThr ? color.new(lowColor,bgTrans) :
rsi >= upperThr ? color.new(highColor,bgTrans) :
na
bgcolor(bgCol)
If RSI ≤ lower threshold: background turns lowColor (oversold zone).
If RSI ≥ upper threshold: background turns highColor (overbought zone).
Otherwise, no background color.
4. Optional RSI Pane
plot(showRSI ? rsi : na, display=display.pane)
Plots the RSI line in a separate pane when showRSI is true; otherwise hides it.
5. Horizontal Lines for Thresholds
hLower = hline(lowerThr, ...)
hUpper = hline(upperThr, ...)
Two horizontal lines at the lower and upper thresholds.
Because hline() can’t be wrapped inside if blocks, the script always creates them but makes them transparent (using na color) when the pane is hidden.
6. Filling Between Threshold Lines
fill(hLower, hUpper, color=showRSI ? color.new(color.gray,95) : na)
When the RSI pane is visible, the area between the two threshold lines is shaded in gray to create a “mid-zone” effect. This fill also switches off (becomes na) if the pane is hidden.
7. Alerts
The script also includes two alert conditions:
When RSI crosses below the lower threshold.
When RSI crosses above the upper threshold.
How It Works in Practice
On the price chart, you’ll see the background turn blue (or your chosen color) when RSI is ≤30, and red when RSI is ≥70.
If you enable “Show RSI” in the settings, a separate RSI pane will appear below the price chart, plotting the RSI line with two threshold lines and a shaded region in between.
You can fully adjust transparency and colors to suit your chart style.
Benefits
Quickly visualize overbought and oversold conditions without opening a separate RSI window.
Optional RSI pane provides context when needed.
Customizable colors and transparency make it easy to integrate with any chart theme.
Alerts give you automatic notifications when RSI crosses key levels.
------------------------------------------------------------------------------------------------------------------
개요
이 지표는 두 가지 기능을 동시에 수행합니다.
가격 차트 뒤 배경에 색상 표시
RSI 값이 설정한 하단 임계값(기본 30) 이하이거나 상단 임계값(기본 70) 이상일 때, 가격 차트 뒤쪽에 과매도·과매수 구간을 색으로 표시해줍니다.
선택적으로 RSI 보조창 표시
옵션을 켜면 별도의 RSI 패널이 나타나서 RSI 라인과 두 임계값(30, 70)을 연결한 구간을 음영 처리하여 보여줍니다.
설정 창에서 색상·투명도·보조창 표시 여부를 전부 조정할 수 있습니다.
코드 핵심 설명
1. 입력값
src: RSI 계산에 사용할 가격 소스(기본 종가).
len: RSI 기간(기본 14).
lowerThr / upperThr: RSI 하단·상단 임계값(기본 30, 70).
lowColor / highColor: RSI가 각각 하단 이하·상단 이상일 때 배경 색상.
bgTrans: 배경 투명도(0=불투명, 100=투명).
showRSI: RSI 보조창을 켜고 끌 수 있는 스위치.
2. RSI 계산
rsi = ta.rsi(src, len)
지정한 가격 소스를 기반으로 RSI를 계산합니다.
3. 가격 차트 배경 색칠
bgCol = rsi <= lowerThr ? color.new(lowColor,bgTrans) :
rsi >= upperThr ? color.new(highColor,bgTrans) :
na
bgcolor(bgCol)
RSI ≤ 하단 임계값 → lowColor(과매도 색)
RSI ≥ 상단 임계값 → highColor(과매수 색)
나머지 구간은 색상 없음.
4. 선택적 RSI 보조창
plot(showRSI ? rsi : na, display=display.pane)
showRSI가 켜져 있으면 RSI 라인을 보조창에 표시하고, 꺼져 있으면 숨깁니다.
5. 임계값 가로선
hLower = hline(lowerThr, ...)
hUpper = hline(upperThr, ...)
하단·상단 임계값을 가로선으로 표시합니다.
hline은 if 블록 안에서 쓸 수 없기 때문에 항상 그려지지만, 보조창이 꺼지면 색을 na로 처리해 안 보이게 합니다.
6. 임계값 사이 영역 음영 처리
fill(hLower, hUpper, color=showRSI ? color.new(color.gray,95) : na)
보조창이 켜져 있을 때만 두 가로선 사이를 회색으로 채워 “중립 구간”을 강조합니다.
7. 알림 조건
RSI가 하단 임계값을 아래로 돌파할 때 알림.
RSI가 상단 임계값을 위로 돌파할 때 알림.
실제 작동 모습
가격 차트 뒤쪽에 RSI ≤30이면 파란색, RSI ≥70이면 빨간색 배경이 나타납니다(색상은 설정에서 변경 가능).
RSI 보조창을 켜면, RSI 라인과 임계값 가로선, 그리고 그 사이 음영 영역이 함께 나타납니다.
투명도를 높이거나 낮추어 강조 정도를 조절할 수 있습니다.
장점
별도의 RSI창을 열지 않고도 가격 차트 배경만으로 과매수·과매도 상태를 직관적으로 확인 가능.
필요하면 보조창으로 RSI를 직접 확인하면서 임계값 가이드와 음영 영역을 함께 볼 수 있음.
색상·투명도를 자유롭게 조절할 수 있어 차트 스타일에 맞게 커스터마이징 가능.
RSI가 임계값을 돌파할 때 자동 알림을 받을 수 있음.
Clean Zone + SL/TP (Latest Only)📌 Description
Clean Zone + SL/TP (Latest Only) is an indicator designed to highlight the most recent supply or demand zone based on pivot highs/lows, and automatically plot entry, stop loss, and multiple take profit levels.
🔹 Automatic Direction Detection
The script can auto-detect trade direction (Long/Short) using pivot logic, or you can override manually.
🔹 Zone Drawing
Only the latest valid supply (red) or demand (green) zone is displayed.
Zones are extended to the right for a customizable number of bars.
🔹 Entry / SL / TP Levels
Entry, Stop Loss, and TP1/TP2/TP3 levels are plotted automatically.
Targets can be calculated either by zone size or by ATR-based multiples.
Risk/Reward ratios are fully adjustable.
🔹 Customizable Display
Toggle visibility for zones (box), entry/SL/TP lines, and price labels.
Labels show only on the latest bar for a clean chart look.
🎯 Use Case
This tool helps traders quickly identify the cleanest and most recent supply/demand setup and manage trades with predefined risk/reward targets. It’s especially useful for price action traders and those who prefer simple, uncluttered charts.

Dynamic Fibonacci MTF Zones v1🔹 Overview
This indicator automatically detects Fibonacci retracement levels across multiple timeframes (MTF) and highlights the most relevant zones around the current price.
Instead of cluttering the chart with too many lines, it only shows the 3 nearest levels above and below the current price, with clear labels and lines.
🔹 Key Features
Multi-Timeframe Support
Up to 7 custom timeframes can be analyzed simultaneously
Example: 5m, 15m, 1H, 4H, 1D, 1W, 1M
Dynamic Fibonacci Levels
Based on recent high/low within N bars
Uses extended set of 25 ratios (0.045 ~ 0.955)
Golden Pocket (0.382–0.618) zones are auto-highlighted
Nearest 3 Levels Display
Picks the 3 closest levels above and below current price
Labels and lines are plotted for clarity
Identical levels across TFs are merged automatically for clean display
Labels with Details
Direction (▲ / ▼)
Timeframe
Fibonacci ratio
Exact price
Visual Customization
Above levels in blue tones, below levels in red tones
Transparency darkens gradually from TF1 → TF7
Line style: solid / dashed / dotted
Zone fills with adjustable colors
🔹 How to Use
Identify strong support/resistance zones where multiple TF Fibonacci levels overlap
Scalpers: Combine short TFs (5m, 15m, 1H)
Swing traders: Use higher TFs (4H, 1D, 1W)
Investors: Track broader zones (1D, 1W, 1M)
🔹 Settings
Recent Range Bars (R): lookback period for Fibonacci highs/lows
Golden Pocket Highlight: toggle 0.382–0.618 shading
Line Style: switch between line/circle visualization
MTF Control: enable/disable TF1~TF7 with custom timeframe selection
✅ Core Idea:
This tool doesn’t just draw Fibonacci lines — it dynamically selects the most relevant MTF levels, merges duplicates, and highlights only the critical zones you need for real trading decisions.

BankNifty Institutional Zone MapperBankNifty Institutional Zone Mapper is a powerful support–resistance mapping tool designed to reveal the hidden grid where institutions are most likely placing their orders.
Instead of random lines, this indicator uses dual baselines with equidistant spacing to create highly accurate zones that act as magnets for price.
🔹 Why try it?
Detect institutional reaction levels instantly.
Spot high-probability support & resistance zones without guesswork.
Works seamlessly across intraday & positional trading.
Eliminates chart clutter while keeping the levels precise & repeatable.
Whether you’re trading BankNifty options, futures, or intraday moves, these zones will help you identify where real market battles are happening.
Add it once to your chart, and you’ll immediately see why price respects these levels again and again.

ICT Silver Bullet Zones (All Sessions)This Pine Script v6 indicator highlights the ICT Silver Bullet windows (10:00–11:00 local time) for all major forex/trading sessions: London, New York AM, New York PM, and Asia.
✅ Features:
Clearly visualizes Silver Bullet zones for each session.
Labels are centered inside each zone for easy identification.
Fully compatible with Pine Script v6 and TradingView.
Adjustable opacity and label size for better chart visibility.
Works on any timeframe and keeps historical zones visible.
Use Case:
Perfect for ICT strategy traders who want to identify high-probability trading windows during major market sessions. Helps in planning entries and understanding liquidity timing without cluttering the chart.
Instructions:
Add the script to your TradingView chart.
Adjust opacity and label size to suit your chart style.
Observe the SB zones for all sessions and plan trades according to ICT methodology.

Pro Market Toolkit (TH) v2.4 — S/R + Zones + ATR Bands + Alertsรายละเอียด (ภาษาไทย):
อินดิเคเตอร์ชุดเครื่องมือครบวงจรสำหรับนักเทรด
คำนวณ แนวรับ–แนวต้าน (Support / Resistance) อัตโนมัติจากสวิง (Pivot High/Low)
สร้าง Supply/Demand Zones จาก ATR เพื่อหาพื้นที่กลับตัวสำคัญ
วาดเส้น Moving Average และ ATR Bands เพื่อประเมินแนวโน้มและความผันผวน
แสดงสัญญาณ Breakout และ Bounce/Reject อย่างชัดเจนบนกราฟ
รองรับ Alerts สำหรับ 4 เงื่อนไขสำคัญ: Breakout ขึ้น/ลง, Demand Bounce, Supply Reject
มีตารางแสดง Trend และค่า ATR ปัจจุบัน
เหมาะสำหรับผู้ที่ต้องการดูแนวโน้ม, หาจุดเข้า/ออก และรับการแจ้งเตือนอัตโนมัติ โดยไม่ต้องเฝ้ากราฟตลอดเวลา
Description (English):
A comprehensive trading toolkit indicator for professional traders.
Automatically detects Support/Resistance levels using swing pivots
Generates Supply/Demand Zones based on ATR to highlight potential reversal areas
Plots Moving Average and ATR Bands for trend and volatility analysis
Displays clear signal markers for Breakouts and Zone Bounces/Rejects
Provides Alerts for 4 key conditions: Breakout Up/Down, Demand Bounce, Supply Reject
Includes an on-chart table showing the current Trend and ATR value
Ideal for traders who want automatic key levels, zones, and signal alerts without the need to monitor the chart constantly.

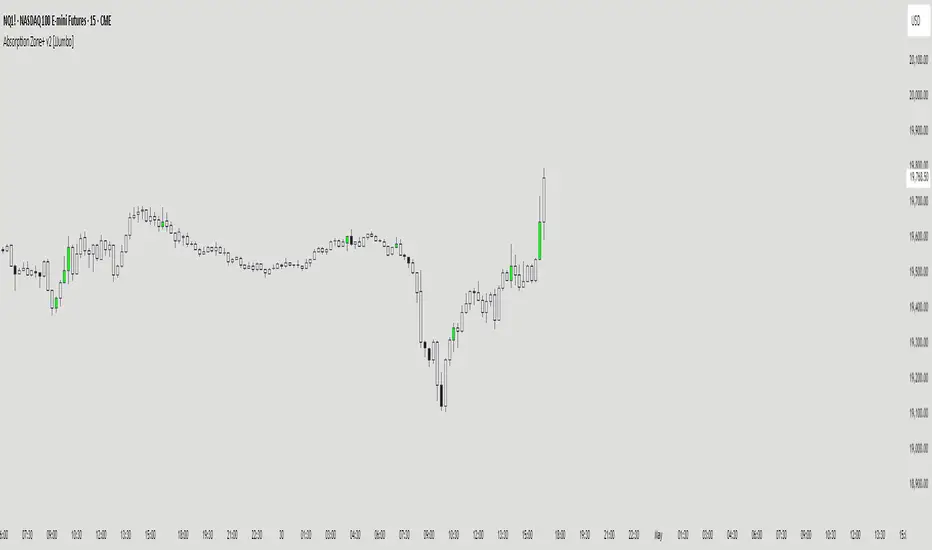
Absorption Zone+ v2 [JJumbo]Introduction
The Absorption Zone+ indicator identifies potential reversal zones by detecting high-volume absorption candles in the market where opposing orders get absorbed at key levels by the opposing party.
This script idea comes from orderflow trading, recreating what absorption would look like, it re-creates absorption based on the volumes of that specific candle or area (multiple candles), useful when trading reversals helping you identifying where influx of volume is coming in, combined with key levels it will help you understand whether a reversal is about to happen or continuation is expected during expansions.
An additional feature of Imbalances on the absorption candles is present, highlighting fair value gaps withing the absorption candles, with multi-timeframe plotting. This script is also applicable on all time frames.
This indicator is particularly valuable for traders focusing on order flow and institutional activity. Absorption candles often represent periods where smart money is actively accumulating or distributing positions while maintaining a tight price range, potentially signaling upcoming directional moves.
Key features
Bullish/Bearish candles color coding identifier:
The color coding for bullish/bearish candles help traders visualize where it is a bullish or bearish absorption identifying these zones at reversals or continuations.
Volume threshold and absorption isolation inputs:
This features let you set a threshold of the volume and percentage body to wick to set your preferred highlighting, and shading all non-absorption candles helping you identify only the absorptions present.
Absorption imbalances:
Imbalances (FVGs) bearish and bullish are shown on different time-frames, helping traders identify turnover areas or support and resistance within the absorptions, the imbalances also have a custom user defined time-frame selection to choose from and show on any time frame.
Additional inputs:
User Guidance
Custom Appearance: Adjust the style and colors of the imbalances for both bullish and bearish candles, this helps trader distinguish one from the other having a better understanding.
Custom time-frame imbalances: Choose your favorite time-frame to display its imbalances in any time-frame, helping trader visualize higher or lower time frame imbalances.
Absorption candles isolation: Isolation of the absorption candles to better identify the zones and specific candles where absorption is present.
Volume multiplier and threshold: Adjust the inputs of the absorption calculation thresholds to better taylor the volumes based on market volatility.
Conclusion
This tool is a great addition in the arsenal for the traders, whether you are a reversal trader or a continuation trader, this tool allows you to identify important areas of big amount of participants in specific candles and mixing it with fair value gap theory from The Inner Circle Trader it gives an additional factor of precision
Terms & Conditions
Our charting tools are products provided for informational and educational purposes only and do not constitute financial, investment, or trading advice. Our charting tools are not designed to predict market movements or provide specific recommendations. Users should be aware that past performance is not indicative of future results and should not be relied upon for making financial decisions. By using our charting tools, the purchaser agrees that the seller and the creator are not responsible for any decisions made based on the information provided by these charting tools. The purchaser assumes full responsibility and liability for any actions taken and the consequences thereof, including any loss of money or investments that may occur as a result of using these products. Hence, by purchasing these charting tools, the customer accepts and acknowledges that the seller and the creator are not liable nor responsible for any unwanted outcome that arises from the development, the sale, or the use of these products. We hold no reimbursement, refund, or chargeback policy. Once these Terms and Conditions are accepted by the Customer, before purchase, no reimbursements, refunds or chargebacks will be provided under any circumstances.
By continuing to use these charting tools, the user acknowledges and agrees to the Terms and Conditions outlined in this legal disclaimer.
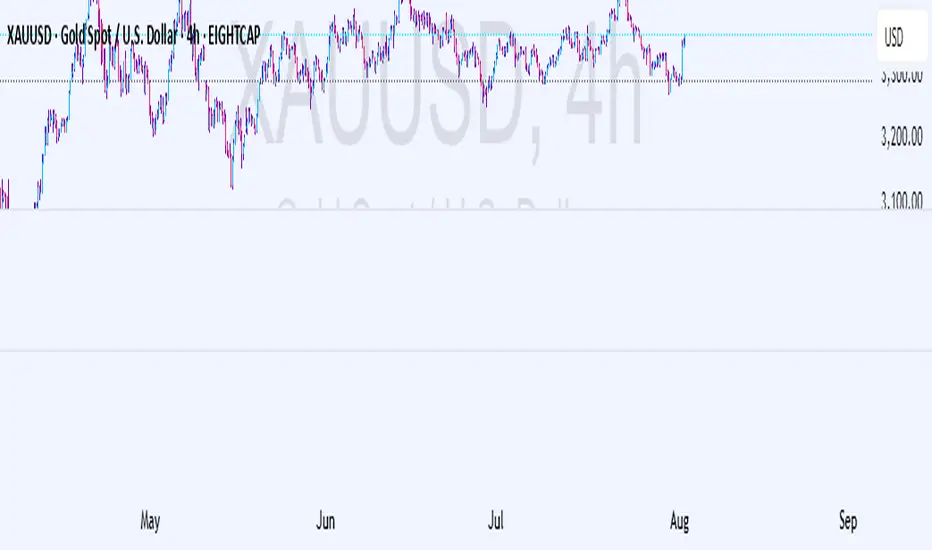
GOXXIE H4 S/R + Volume Zones + Alerts [For GOLD Day Traders]This advanced indicator identifies key trading levels by combining:
H4 Timeframe Support/Resistance
Automatically detects swing highs/lows from the 4-hour chart
Plots them on your current timeframe (perfect for day traders)
Only shows confirmed levels (adjustable from 1-5 touches)
Volume Confirmation
Highlights high-volume zones from the H4 timeframe
Purple shading shows where institutions traded actively
Proximity Alerts
Customizable alerts when price approaches key levels (0.1%-5% distance)
Prevents missed opportunities at critical zones
Key Features:
✅ Multi-Timeframe Analysis - See H4 structure while trading lower timeframes
✅ Volume-Filtered Levels - Avoid false breaks with volume confirmation
✅ Customizable Sensitivity - Adjust touch requirements and alert distances
✅ Clean Visualization - Dashed lines (red=resistance, green=support) with subtle volume shading
Ideal For:
Day traders who need to align with higher timeframe structure
Swing traders looking for confluent support/resistance zones
Breakout/Reversal strategies with volume confirmation
Input Parameters:
Higher Timeframe (H4) - Base timeframe for level detection
Min Touches - How many times a level must be tested (1-5)
Volume Threshold - Sensitivity for high-volume zones (0.1-2.0)
Alert Distance - How close price must be to trigger alerts (0.1%-5%)
Pro Tips:
Combine with:
Trend confirmation (e.g., 200 EMA)
Candlestick patterns at key levels
Strongest signals occur when:
Price tests H4 level + volume zone simultaneously
Lower timeframe shows rejection (wick) or breakout (close beyond level)
Publishing Notes:
Categories: Strategy > Support/Resistance > Volume
Tags: support, resistance, volume, daytrading, multitimeframe
Preview Image: Show a chart with:
H4 levels on a 15m chart
Purple volume zones
Example alerts popping up
Institutional Sweep Zone (Range-Based)Institutional Sweep Zone (Range-Based)
This indicator models potential stop sweep zones based on institutional capital ranges, helping traders visualize where high-probability liquidity grabs are likely to occur.
Unlike traditional volatility bands, this tool estimates price movement by calculating how far a specific amount of capital—entered into the market—can push price. By defining a lower and upper capital range (in millions of USD), the indicator dynamically draws bands representing the distance institutions could realistically move price in either direction.
It supports directional control, allowing you to focus on long sweeps, short sweeps, or both simultaneously. The pip cost is auto-calibrated based on the selected currency pair, making it highly adaptive to major FX pairs.
Key Features:
-Capital input range (in millions of USD)
-Directional sweep targeting: Long, Short, or Both
-Auto-detection of pip value based on FX pair
-Visual sweep zone mapped above and below current price
-Designed to highlight areas of institutional stop hunts
Why use it?
-Helps avoid setting stops inside common sweep zones
-Improves trade survivability when paired with higher timeframe strategies
-Offers a unique way to view price through an institutional lens
Created by: The_Forex_Steward
Explore more advanced tools and concepts on my TradingView profile.

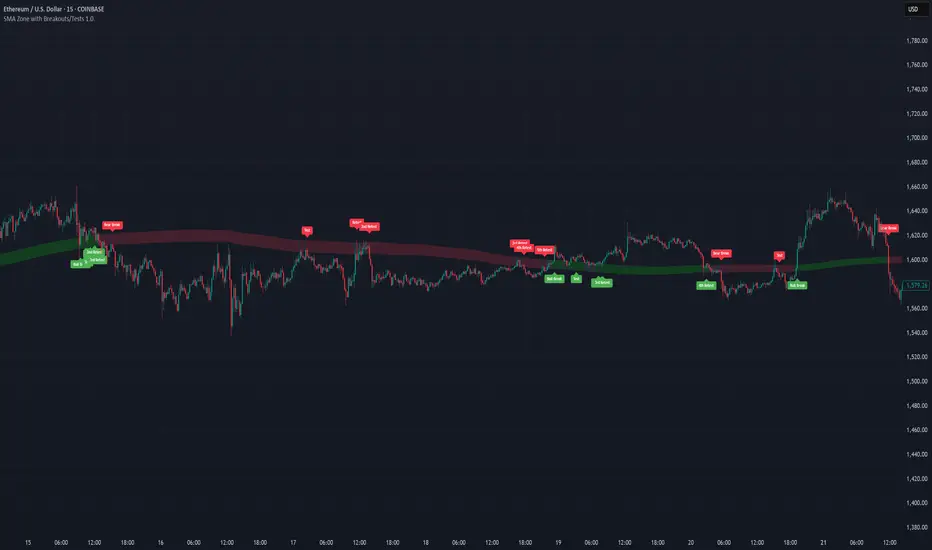
SMA Zone with Breakouts/Tests 1.0.This indicator plots a dynamic “SMA Zone” between two simple moving averages (one applied to lows, one to highs) and highlights key interaction points with the zone:
Breakouts
Bull Break: price closes above the upper SMA
Bear Break: price closes below the lower SMA
Requires confirmation via either above-average volume or an unusually wide bar (spread > ATR) closing near its extreme
Tests & Retests
After a breakout, the first re-entry into the zone edge is labeled “Test,” subsequent re-entries are numbered “Retest,” “2nd Retest,” etc.
Zone Weakening: each additional Test/Retest signifies diminished zone strength—fewer reliable boundaries remain (Traditional S/R theory)
Alerts
Fires a unified “Zone Signal” alert on every Break, Test, and Retest (set condition to “Any alert() function call”).
Disclaimer:
This is not financial advice and should not be used as a standalone trading signal.
It’s designed to draw your attention to important price-zone interactions so you can manually tune in.
The logic can be further enhanced or combined with other indicators/algorithms as part of a more complex trading system.
SuperSmoothed Volume Zone Oscillator------------------------------------------------------------------------------------
SUPERSMOOTHED VOLUME ZONE OSCILLATOR (SSVZO)
TECHNICAL INDICATOR DOCUMENTATION
------------------------------------------------------------------------------------
Table of Contents:
1. Original VZO Background
2. SuperSmoother Technology
3. SSVZO Components
3.1. Main SSVZO Oscillator
3.2. Momentum Velocity Component
3.3. Adaptive Levels
3.4. Static Levels
3.5. Trend Shift Detection
3.6. Glow Effect Visualization
4. References & Further Reading
------------------------------------------------------------------------------------
1. ORIGINAL VOLUME ZONE OSCILLATOR (VZO) BACKGROUND
------------------------------------------------------------------------------------
Creator: Walid Khalil (November 2009, Technical Analysis of Stocks & Commodities)
History: Khalil designed the VZO to address limitations in other volume indicators
by focusing on the relative balance between buying and selling volume while filtering
out market noise. The indicator identifies accumulation and distribution patterns.
Traditional Usage: The classic VZO uses a 14-period calculation setting and is
interpreted on a scale from -60% to +60%:
- Readings above +40% indicate strong buying pressure (potential overbought)
- Readings below -40% indicate strong selling pressure (potential oversold)
- The zero line acts as a key reference for trend changes
- Divergences between VZO and price offer valuable trading signals
Difference from Other Volume Indicators: Unlike simple volume indicators that only
track total volume, the VZO tracks the relative difference between up-volume and
down-volume, more effectively identifying buying/selling pressure imbalances and
potential reversal points.
------------------------------------------------------------------------------------
2. SUPERSMOOTHER FILTER TECHNOLOGY
------------------------------------------------------------------------------------
Creator: John F. Ehlers, an engineer specializing in digital signal processing for
trading systems.
Origins: Introduced in "Rocket Science for Traders" (2001) and refined in "Cybernetic
Analysis for Stocks and Futures" (2004). Represents the application of digital signal
processing techniques to financial markets.
Technical Foundation: The SuperSmoother is a two-pole low-pass filter specifically
designed to eliminate noise while preserving the underlying signal. It combines
principles of Butterworth and Gaussian filters to minimize both phase shift and
passband ripple.
Mathematical Implementation:
a1 = exp(-π * sqrt(2) / period)
b1 = 2 * a1 * cos(sqrt(2) * π / period)
c2 = b1
c3 = -a1²
c1 = 1 - c2 - c3
Advantages Over Traditional Filters:
- Reduces lag compared to simple moving averages
- Eliminates high-frequency market noise more effectively
- Minimizes unwanted ripples in the output signal
- Preserves important turning points in the data
- Superior handling of sudden market movements
According to Ehlers: "Conventional moving averages are plagued by excessive lag and/or
rippling in their passband. The SuperSmoother eliminates virtually all of this ripple
and has excellent transient response characteristics." (TASC Magazine, 2014)
------------------------------------------------------------------------------------
3. SSVZO COMPONENTS
------------------------------------------------------------------------------------
3.1. MAIN SSVZO OSCILLATOR
------------------------------------------------------------------------------------
Description: The core component measuring buying vs. selling volume pressure using
the SuperSmoother filter for enhanced noise reduction.
Calculation: SSVZO analyzes the relationship between up-volume (volume on rising
prices) and down-volume (volume on falling prices), applying exponential moving
averages to both components, then calculating their relative strength. The
SuperSmoother filter reduces market noise while preserving the underlying trend signal.
Implementation Advantage: By applying the SuperSmoother filter to the VZO calculation,
the SSVZO provides significantly cleaner signals with fewer false crossovers and more
accurate identification of true trend changes.
Interpretation:
- Values above zero indicate bullish volume dominance
- Values below zero indicate bearish volume dominance
- Readings above +60 suggest overbought conditions
- Readings below -60 suggest oversold conditions
- Crossovers of the zero line signal potential trend changes
Trading Application: Use SSVZO as a primary volume-based momentum indicator to
confirm price trends, identify divergences, and spot potential reversal zones.
------------------------------------------------------------------------------------
3.2. MOMENTUM VELOCITY COMPONENT
------------------------------------------------------------------------------------
Description: A histogram displaying the rate of change of momentum, showing how
quickly buying or selling pressure is accelerating or decelerating.
Calculation: Derived from price momentum over a user-defined period, with optional
adaptive filtering that adjusts sensitivity based on market volatility. The velocity
component shows the first derivative of momentum – essentially the "acceleration" of
market movement.
Technical Origin: Inspired by Ehlers' work on Hilbert Transforms and research on
cyclic components in financial markets, as detailed in "Cycle Analytics for Traders"
(2013).
Interpretation:
- Positive readings (teal bars) indicate accelerating upward momentum
- Negative readings (orange bars) suggest accelerating downward momentum
- Larger bars indicate stronger momentum acceleration
- Shrinking bars signal momentum deceleration
Trading Application: Use as an early warning system for potential trend exhaustion
or confirmation of a new trending move. When momentum velocity diverges from price,
it often precedes a reversal.
------------------------------------------------------------------------------------
3.3. ADAPTIVE LEVELS
------------------------------------------------------------------------------------
Description: Dynamic overbought and oversold boundaries that adjust to market
conditions, providing context-aware trading signals.
Calculation: Uses statistical methods based on the standard deviation of the SSVZO
values over a longer period. These levels automatically widen during higher volatility
periods and narrow during consolidation.
Research Base: Draws from Perry Kaufman's work on Adaptive Moving Averages (AMA) and
Bollinger's research on dynamic volatility bands, as published in "Trading Systems
and Methods" (2013).
Interpretation:
- Adaptive Overbought (dotted circles above): Dynamic ceiling that expands/contracts
based on market volatility
- Adaptive Oversold (dotted circles below): Dynamic floor that expands/contracts based
on market volatility
Trading Application: More reliable for identifying extremes than static levels,
particularly in changing market conditions or different instruments. Touching these
levels often provides higher-probability reversal signals.
------------------------------------------------------------------------------------
3.4. STATIC LEVELS
------------------------------------------------------------------------------------
Description: Fixed overbought and oversold horizontal lines that provide consistent
reference points for excess market conditions.
Calculation: Preset at +60 (overbought) and -60 (oversold) based on historical
analysis of volume behavior across multiple markets, extending the classic VZO range.
Interpretation:
- Readings above +60 suggest potential buying exhaustion
- Readings below -60 indicate potential selling exhaustion
- Duration spent beyond these levels correlates with reversal probability
Trading Application: Use as baseline reference points for extreme conditions. Most
effective when combined with other confirmation signals like divergences or
candlestick patterns.
------------------------------------------------------------------------------------
3.5. TREND SHIFT DETECTION
------------------------------------------------------------------------------------
Description: Visual markers and optional background shading highlighting potential
trend changes when the SSVZO crosses the zero line.
Calculation: Based on mathematical crossovers of the SSVZO value above or below the
zero line, with pattern recognition to reduce false signals.
Research Foundation: Incorporates concepts from Dr. Alexander Elder's "triple screen
trading system" and Mark Chaikin's volume-based trend identification research.
Interpretation:
- Upward triangles indicate bullish trend shifts (SSVZO crossing above zero)
- Downward triangles indicate bearish trend shifts (SSVZO crossing below zero)
- Background shading emphasizes the new trend direction
Trading Application: These signals often precede price trend changes and can serve
as entry triggers when aligned with the higher timeframe trend.
------------------------------------------------------------------------------------
3.6. GLOW EFFECT VISUALIZATION
------------------------------------------------------------------------------------
Description: An aesthetic enhancement creating a gradient "glow" around the main SSVZO
line, improving visual clarity and emphasizing signal strength.
Calculation: Generated using percentage-based bands around the main SSVZO value, with
multiple translucent layers to create a subtle illumination effect.
Design Inspiration: Inspired by modern UI/UX design principles for financial
dashboards and the MATS (Moving Average Trend Sniper) indicator's visual presentation,
enhancing perception of signal strength through visual intensity.
Interpretation:
- Teal glow indicates positive SSVZO values (bullish)
- Orange glow indicates negative SSVZO values (bearish)
- Glow intensity correlates with the strength of the signal
Trading Application: Beyond aesthetics, the glow creates visual emphasis that makes
trend direction, strength, and changes more immediately apparent, particularly useful
during fast-moving market conditions.
------------------------------------------------------------------------------------
4. REFERENCES & FURTHER READING
------------------------------------------------------------------------------------
1. Ehlers, J. F. (2001). "Rocket Science for Traders: Digital Signal Processing
Applications." John Wiley & Sons.
2. Ehlers, J. F. (2004). "Cybernetic Analysis for Stocks and Futures: Cutting-Edge
DSP Technology to Improve Your Trading." John Wiley & Sons.
3. Ehlers, J. F. (2013). "Cycle Analytics for Traders: Advanced Technical Trading
Concepts." John Wiley & Sons.
4. Khalil, W. (2009). "The Volume Zone Oscillator." Technical Analysis of Stocks &
Commodities, November 2009.
5. Kaufman, P. J. (2013). "Trading Systems and Methods." 5th Edition, Wiley Trading.
6. Elder, A. (2002). "Come Into My Trading Room: A Complete Guide to Trading."
John Wiley & Sons.
7. Bollinger, J. (2002). "Bollinger on Bollinger Bands." McGraw-Hill Education.
------------------------------------------------------------------------------------
END OF DOCUMENTATION
------------------------------------------------------------------------------------

matrixx Global Sessions + Good/Premium Spread ZonesSimple (enough) Script that allows you to visualize the major trading sessions, with some QoL stuff, Includes a "Monday Open" bar for reference when zooming out.
By default no one 'session' is turned on; instead, we have;
Good Zone - where spread tends to close up enough for (me) to trade in the 1-minute timezones
Premium Zone - where the tightest spreads tend to happen and I (you?) can get more aggressive with Stop Losses, and moment-to-moment trade accuracy.
The Monday Open - for reference.
You are able to go into the settings and turn these on and off at will, making any combination of 'zones' you prefer, and can colour code them, as well.
Points of Difference;
You can turn on and off any group or set of sessions for an overview;
Additionally, this is coded so that if there is a "Daylight Saving" or other localized timezone shift, it should be reflected correcty, as timezones are calculated based on each sessions' data, not arbitrarily with +/- as most of the other scripts that do similar to this one.
Monday Open
you can toggle sessions, or instead toggle the 'off hour' zones, at will

Trendchange Zones Indicator | iSolani
Spotting Reversals Before They Happen: The iSolani Trendshift System
Where RSI Meets Smart Volume Analysis - Your Visual Guide to Market Turns
Core Methodology
RSI-Powered Zones
Identifies critical levels using:
14-period RSI (default) with 70/30 thresholds
Semi-transparent boxes marking overbought (red) and oversold (green) territories
Zone persistence until RSI returns to neutral range
Dynamic Level Tracking
Plots evolving support/resistance using:
Pivot highs/lows with 15-bar lookback (default)
Auto-extending lines that adapt to new price extremes
Volume-Confirmed Breakouts
Flags significant moves with:
5/10 EMA volume oscillator
20% volume threshold (default) for confirmation
Technical Innovation
Three-Layer Confirmation
Unique combination of:
Classic RSI extremes
Price structure through pivot points
Volume-fueled momentum shifts
Adaptive Visualization
Zones maintain historical context at 33% transparency
Dynamic lines extend indefinitely until invalidated
Discreet labels for breakout events
System Workflow
Calculates RSI values in real-time
Draws colored zones when RSI crosses 70/30
Marks pivot points every 15 bars (default)
Updates support/resistance lines on new pivots
Triggers alerts when price breaks levels with volume confirmation
Standard Configuration
RSI Settings : 14-period length
Pivot Detection : 15-bar left/right lookback
Visuals : 33% transparency zones with thin borders
Volume Threshold : 20% oscillator difference
Alerts : Breakout signals with "B" labels
This system transforms the classic RSI into a spatial analysis tool - not just showing when markets are overextended, but where they're likely to reverse. The dynamic lines act as moving barriers that adapt to market structure, while the volume filter ensures only high-conviction breaks get flagged. By layering momentum, price action, and volume dynamics, it creates a multi-spectrum view of potential trend changes.

TrendGuard Scalper: SSL + Hama Candle with Consolidation ZonesThis TradingView script brings a powerful scalping strategy that combines the SSL Channel and Hama Candles indicators with a special twist—consolidation detection. Designed for traders looking for consistency in various markets like crypto, forex, and stocks, this strategy highlights clear trend signals, risk management, and helps filter out risky trades during consolidation periods.
Why Use This Strategy?
Clear Trend Detection:
With the SSL Channel, you’ll know exactly when the market is in an uptrend (green) or downtrend (red), giving you straightforward entry points.
Short-Term Trend Precision with Hama Candles:
By calculating unique EMAs for open, high, low, and close, the Hama Candles show the strength and direction of short-term trends. Combined with the Hama Line, it gives you a solid confirmation on whether the trend is strong or about to reverse, allowing for precise entries and exits.
Avoiding Choppy Markets:
Thanks to ATR-based consolidation detection, this strategy identifies low-volatility periods where the market is “choppy” and less predictable. During these times, a yellow background appears on the chart, warning you to hold off on trades, reducing the likelihood of entering losing trades.
Built-In Risk Management:
With adjustable Take Profit and Stop Loss levels based on price movements, you can set and forget your trades, with a safety net if the market turns against you. The strategy automatically closes positions if the price returns to the Hama Candle, keeping your risk low.
How It Works:
Long Position: When both the SSL and Hama indicators show a green trend, and the price is above the Hama Candles, the strategy opens a long position. Take Profit triggers at your chosen risk-to-reward ratio, while Stop Loss protects you just below the Hama Line.
Short Position: When both indicators align in red and the price is below the Hama Candles, the strategy opens a short. Similar to longs, Stop Loss is set just above the Hama Line, and Take Profit is at your defined level.
Start Trading Confidently
Test this strategy with different settings and discover how it can perform across various assets. Whether you're trading Bitcoin, forex pairs, or stocks, this system has the flexibility and robustness to help you spot profitable trends and avoid risky zones. Try it today on a 30-minute timeframe to see how it aligns with your trading goals, and let the consolidation detection guide you away from false signals.
Happy trading, and may the trends be with you! 📈

Trailing Support and Resistance Zones
This Script code is used to plot support and resistance levels on a chart. Here's how it works:
Input Parameters: The code starts by defining an input parameter lookback_period, which determines the number of bars to look back when calculating support and resistance levels. You can adjust this parameter based on your preferences or trading strategy. I recommend 50 for longer trends and larger profits.
Calculate Support and Resistance Levels: The calculateSR() function is defined to calculate the support and resistance levels based on the lowest low and highest high prices within the specified lookback period. It uses the ta.lowest() function to find the lowest low price and the ta.highest() function to find the highest high price over the specified number of bars.
Plotting: The function calculateSR() is called to compute the support and resistance levels, and the results are stored in the variables support_level and resistance_level, respectively. These levels are then plotted on the chart using the plot() function. The support levels are plotted in green, while the resistance levels are plotted in red. Both lines are drawn with a specified line width and style (plot.style_stepline).
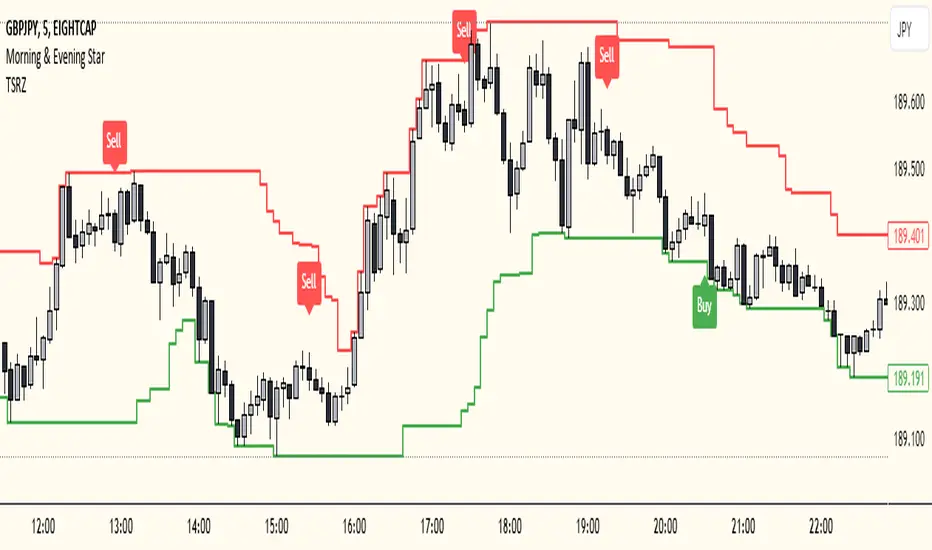
By visualizing these support and resistance levels on the chart, you can identify potential price levels where the market might find buying or selling pressure. These levels are crucial for making trading decisions, such as setting entry and exit points, defining stop-loss and take-profit levels, and assessing the overall market sentiment.
I recommend using this indicator together with my morning & Evening Star Indicator to find entry zones.
Time Range zoneThis TradingView script displays two time zones on the chart. The first zone starts at 8:00 AM and ends at 1:00 PM, while the second zone starts at 5:00 PM and ends at 10:00 PM. If the current time is within either of these two zones, a green or red background is drawn on the chart, respectively. This script is set by default for my personal XRP strategy.

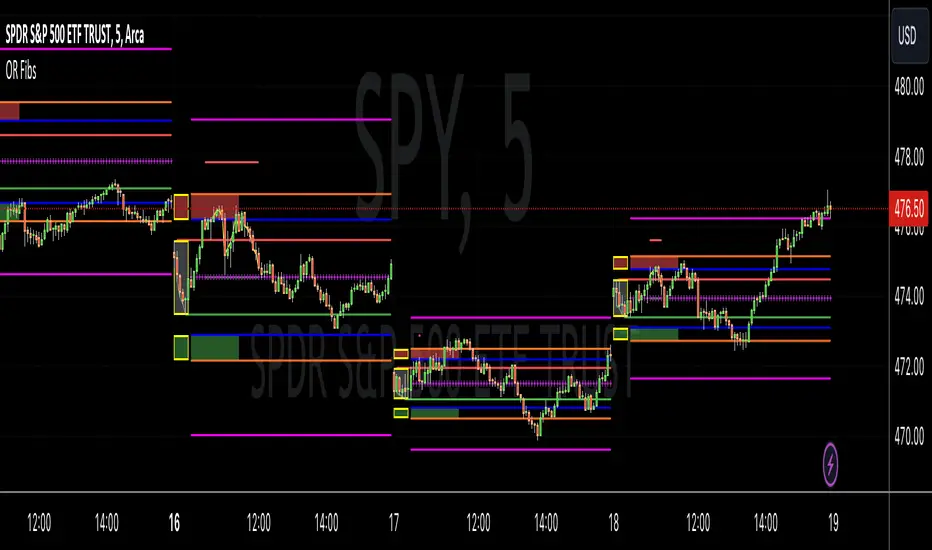
Opening Range Reversal ZonesThis script finds a reversal zone beyond the opening range for the selected period. I borrowed most of the opening range script itself from asenski.
I added a few things:
Trade Entry Times -- this restricts the "alert times."
Shading for the above mentioned times for the two "reversal" zones
A couple of other visuals for lines for the hi, mid, low of the opening range and lines for the fibs
Alerts while in the trading entry time session for fibbonacci crossovers.
I use this on NDX, SPY, and QQQs and have found buying "at the money" 0DTE puts in the "red zone" or 0DTE calls in the "green zone" frequently wins.
I have no statistics, as I am very methodical when I choose to enter, paying attention to the news, recent momentum, etc, and am not blindly entering when alert comes, but when one does, I do research and enter a trade.
In any case, thought I would share.