EMA RSI Trend Reversal Ver.1Overview:
The EMA RSI Trend Reversal indicator combines the power of two well-known technical indicators—Exponential Moving Averages (EMAs) and the Relative Strength Index (RSI)—to identify potential trend reversal points in the market. The strategy looks for key crossovers between the fast and slow EMAs, and uses the RSI to confirm the strength of the trend. This combination helps to avoid false signals during sideways market conditions.
How It Works:
Buy Signal:
The Fast EMA (9) crosses above the Slow EMA (21), indicating a potential shift from a downtrend to an uptrend.
The RSI is above 50, confirming strong bullish momentum.
Visual Signal: A green arrow below the price bar and a Buy label are plotted on the chart.
Sell Signal:
The Fast EMA (9) crosses below the Slow EMA (21), indicating a potential shift from an uptrend to a downtrend.
The RSI is below 50, confirming weak or bearish momentum.
Visual Signal: A red arrow above the price bar and a Sell label are plotted on the chart.
Key Features:
EMA Crossovers: The Fast EMA crossing above the Slow EMA signals potential buying opportunities, while the Fast EMA crossing below the Slow EMA signals potential selling opportunities.
RSI Confirmation: The RSI helps confirm trend strength—values above 50 indicate bullish momentum, while values below 50 indicate bearish momentum.
Visual Cues: The strategy uses green arrows and red arrows along with Buy and Sell labels for clear visual signals of when to enter or exit trades.
Signal Interpretation:
Green Arrow / Buy Label: The Fast EMA (9) has crossed above the Slow EMA (21), and the RSI is above 50. This is a signal to buy or enter a long position.
Red Arrow / Sell Label: The Fast EMA (9) has crossed below the Slow EMA (21), and the RSI is below 50. This is a signal to sell or exit the long position.
Strategy Settings:
Fast EMA Length: Set to 9 (this determines how sensitive the fast EMA is to recent price movements).
Slow EMA Length: Set to 21 (this smooths out price movements to identify the broader trend).
RSI Length: Set to 14 (default setting to track momentum strength).
RSI Level: Set to 50 (used to confirm the strength of the trend—above 50 for buy signals, below 50 for sell signals).
Risk Management (Optional):
Use take profit and stop loss based on your preferred risk-to-reward ratio. For example, you can set a 2:1 risk-to-reward ratio (2x take profit for every 1x stop loss).
Backtesting and Optimization:
Backtest the strategy on TradingView by opening the Strategy Tester tab. This will allow you to see how the strategy would have performed on historical data.
Optimization: Adjust the EMA lengths, RSI period, and risk-to-reward settings based on your asset and time frame.
Limitations:
False Signals in Sideways Markets: Like any trend-following strategy, this indicator may generate false signals during periods of low volatility or sideways movement.
Not Suitable for All Market Conditions: This indicator performs best in trending markets. It may underperform in choppy or range-bound markets.
Strategy Example:
XRP/USD Example:
If you're trading XRP/USD and the Fast EMA (9) crosses above the Slow EMA (21), while the RSI is above 50, the indicator will signal a Buy.
Conversely, if the Fast EMA (9) crosses below the Slow EMA (21), and the RSI is below 50, the indicator will signal a Sell.
Bitcoin (BTC/USD):
On the BTC/USD chart, when the indicator shows a green arrow and a Buy label, it’s signaling a potential long entry. Similarly, a red arrow and Sell label indicate a short entry or exit from a previous long position.
Summary:
The EMA RSI Trend Reversal Indicator helps traders identify potential trend reversals with clear buy and sell signals based on the EMA crossovers and RSI confirmations. By using green arrows and red arrows, along with Buy and Sell labels, this strategy offers easy-to-understand visual signals for entering and exiting trades. Combine this with effective risk management and backtesting to optimize your trading performance.
Buscar en scripts para "momentum"

VIDYA ProTrend Multi-Tier ProfitHello! This time is about a trend-following system.
VIDYA is quite an interesting indicator that adjusts dynamically to market volatility, making it more responsive to price changes compared to traditional moving averages. Balancing adaptability and precision, especially with the more aggressive short trade settings, challenged me to fine-tune the strategy for a variety of market conditions.
█ Introduction and How it is Different
The "VIDYA ProTrend Multi-Tier Profit" strategy is a trend-following system that combines the VIDYA (Variable Index Dynamic Average) indicator with Bollinger Bands and a multi-step take-profit mechanism.
Unlike traditional trend strategies, this system allows for more adaptive profit-taking, adjusting for long and short positions through distinct ATR-based and percentage-based targets. The innovation lies in its dynamic multi-tier approach to profit-taking, especially for short trades, where more aggressive percentages are applied using a multiplier. This flexibility helps adapt to various market conditions by optimizing trade management and profit allocation based on market volatility and trend strength.
BTCUSD 6hr performance
█ Strategy, How it Works: Detailed Explanation
The core of the "VIDYA ProTrend Multi-Tier Profit" strategy lies in the dual VIDYA indicators (fast and slow) that analyze price trends while accounting for market volatility. These indicators work alongside Bollinger Bands to filter trade entries and exits.
🔶 VIDYA Calculation
The VIDYA indicator is calculated using the following formula:
Smoothing factor (𝛼):
alpha = 2 / (Length + 1)
VIDYA formula:
VIDYA(t) = alpha * k * Price(t) + (1 - alpha * k) * VIDYA(t-1)
Where:
k = |Chande Momentum Oscillator (MO)| / 100
🔶 Bollinger Bands as a Volatility Filter
Bollinger Bands are calculated using a rolling mean and standard deviation of price over a specified period:
Upper Band:
BB_upper = MA + (K * stddev)
Lower Band:
BB_lower = MA - (K * stddev)
Where:
MA is the moving average,
K is the multiplier (typically 2), and
stddev is the standard deviation of price over the Bollinger Bands length.
These bands serve as volatility filters to identify potential overbought or oversold conditions, aiding in the entry and exit logic.
🔶 Slope Calculation for VIDYA
The slopes of both fast and slow VIDYAs are computed to assess the momentum and direction of the trend. The slope for a given VIDYA over its length is:
Slope = (VIDYA(t) - VIDYA(t-n)) / n
Where:
n is the length of the lookback period. Positive slope indicates bullish momentum, while negative slope signals bearish momentum.
LOCAL picture
🔶 Entry and Exit Conditions
- Long Entry: Occurs when the price moves above the slow VIDYA and the fast VIDYA is trending upward. Bollinger Bands confirm the signal when the price crosses the upper band, indicating bullish strength.
- Short Entry: Happens when the price drops below the slow VIDYA and the fast VIDYA trends downward. The signal is confirmed when the price crosses the lower Bollinger Band, showing bearish momentum.
- Exit: Based on VIDYA slopes flattening or reversing, or when the price hits specific ATR or percentage-based profit targets.
🔶 Multi-Step Take Profit Mechanism
The strategy incorporates three levels of take profit for both long and short trades:
- ATR-based Take Profit: Each step applies a multiple of the ATR (Average True Range) to the entry price to define the exit point.
The first level of take profit (long):
TP_ATR1_long = Entry Price + (2.618 * ATR)
etc.
█ Trade Direction
The strategy offers flexibility in defining the trading direction:
- Long: Only long trades are considered based on the criteria for upward trends.
- Short: Only short trades are initiated in bearish trends.
- Both: The strategy can take both long and short trades depending on the market conditions.
█ Usage
To use the strategy effectively:
- Adjust the VIDYA lengths (fast and slow) based on your preference for trend sensitivity.
- Use Bollinger Bands as a filter for identifying potential breakout or reversal scenarios.
- Enable the multi-step take profit feature to manage positions dynamically, allowing for partial exits as the price reaches specified ATR or percentage levels.
- Leverage the short trade multiplier for more aggressive take profit levels in bearish markets.
This strategy can be applied to different asset classes, including equities, forex, and cryptocurrencies. Adjust the input parameters to suit the volatility and characteristics of the asset being traded.
█ Default Settings
The default settings for this strategy have been designed for moderate to trending markets:
- Fast VIDYA Length (10): A shorter length for quick responsiveness to price changes. Increasing this length will reduce noise but may delay signals.
- Slow VIDYA Length (30): The slow VIDYA is set longer to capture broader market trends. Shortening this value will make the system more reactive to smaller price swings.
- Minimum Slope Threshold (0.05): This threshold helps filter out weak trends. Lowering the threshold will result in more trades, while raising it will restrict trades to stronger trends.
Multi-Step Take Profit Settings
- ATR Multipliers (2.618, 5.0, 10.0): These values define how far the price should move before taking profit. Larger multipliers widen the profit-taking levels, aiming for larger trend moves. In higher volatility markets, these values might be adjusted downwards.
- Percentage Levels (3%, 8%, 17%): These percentage levels define how much the price must move before taking profit. Increasing the percentages will capture larger moves, while smaller percentages offer quicker exits.
- Short TP Multiplier (1.5): This multiplier applies more aggressive take profit levels for short trades. Adjust this value based on the aggressiveness of your short trade management.
Each of these settings directly impacts the performance and risk profile of the strategy. Shorter VIDYA lengths and lower slope thresholds will generate more trades but may result in more whipsaws. Higher ATR multipliers or percentage levels can delay profit-taking, aiming for larger trends but risking partial gains if the trend reverses too early.

RMI Trend Sync - Strategy [presentTrading]█ Introduction and How It Is Different
The "RMI Trend Sync - Strategy " combines the strength of the Relative Momentum Index (RMI) with the dynamic nature of the Supertrend indicator. This strategy diverges from traditional methodologies by incorporating a dual analytical framework, leveraging both momentum and trend indicators to offer a more holistic market perspective. The integration of the RMI provides an enhanced understanding of market momentum, while the Super Trend indicator offers clear insights into the end of market trends, making this strategy particularly effective in diverse market conditions.
BTC 4h long/short performance
█ Strategy: How It Works - Detailed Explanation
- Understanding the Relative Momentum Index (RMI)
The Relative Momentum Index (RMI) is an adaptation of the traditional Relative Strength Index (RSI), designed to measure the momentum of price movements over a specified period. While RSI focuses on the speed and change of price movements, RMI incorporates the direction and magnitude of those movements, offering a more nuanced view of market momentum.
- Principle of RMI
Calculation Method: RMI is calculated by first determining the average gain and average loss over a given period (Length). It differs from RSI in that it uses the price change (close-to-close) rather than absolute gains or losses. The average gain is divided by the average loss, and this ratio is then normalized to fit within a 0-100 scale.
- Momentum Analysis in the Strategy
Thresholds for Decision Making: The strategy uses predetermined thresholds (pmom for positive momentum and nmom for negative momentum) to trigger trading decisions. When RMI crosses above the positive threshold and other conditions align (e.g., a bullish trend), it signals a potential long entry. Similarly, crossing below the negative threshold in a bearish trend may trigger a short entry.
- Super Trend and Trend Analysis
The Super Trend indicator is calculated based on a higher time frame, providing a broader view of the market trend. This indicator uses the Average True Range (ATR) to adapt to market volatility, making it an effective tool for identifying trend reversals.
The strategy employs a Volume Weighted Moving Average (VWMA) alongside the Super Trend, enhancing its capability to identify significant trend shifts.
ETH 4hr long/short performance
█ Trade Direction
The strategy offers flexibility in selecting the trading direction: long, short, or both. This versatility allows traders to adapt to their market outlook and risk tolerance, whether looking to capitalize on bullish trends, bearish trends, or a combination of both.
█ Usage
To effectively use the "RMI Trend Sync" strategy, traders should first set their preferred trading direction and adjust the RMI and Super Trend parameters according to their risk appetite and trading goals.
The strategy is designed to adapt to various market conditions, making it suitable for different asset classes and time frames.
█ Default Settings
RMI Settings: Length: 21, Positive Momentum Threshold: 70, Negative Momentum Threshold: 30
Super Trend Settings: Length: 10, Higher Time Frame: 480 minutes, Super Trend Factor: 3.5, MA Source: WMA
Visual Settings: Display Range MA: True, Bullish Color: #00bcd4, Bearish Color: #ff5252
Additional Settings: Band Length: 30, RWMA Length: 20

CNN Fear and Greed StrategyAdaptation of the CNN Fear and Greed Index Indicator (Original by EdgeTools)
The following changes have been implemented:
Put/Call Ratio Data Source: The data source for the Put/Call Ratio has been updated.
Bond Data Source: The data sources for the bond components (Safe Haven Demand and Junk Bond Demand) have been updated.
Normalization Adjustment: The normalization method has been adjusted to allow the CNN Fear and Greed Index to display over a longer historical period, optimizing it for backtesting purposes.
Style Modification: The display style has been modified for a simpler and cleaner appearance.
Strategy Logic Addition: Added a new strategy entry condition: index >= 25 AND index crosses over its 5-period Simple Moving Average (SMA), and a corresponding exit condition of holding the position for 252 bars (days).
CNN Fear & Greed Backtest Strategy (Adapted)
This script is an adaptation of the popular CNN Fear & Greed Index, originally created by EdgeTools, with significant modifications to optimize it for long-term backtesting on the TradingView platform.
The core function of the Fear & Greed Index is to measure the current emotional state of the stock market, ranging from 0 (Extreme Fear) to 100 (Extreme Greed). It operates on the principle that excessive fear drives prices too low (a potential buying opportunity), and excessive greed drives them too high (a potential selling opportunity).
Key Components of the Index (7 Factors)
The composite index is calculated as a weighted average of seven market indicators, each normalized to a score between 0 and 100:
Market Momentum: S&P 500's current level vs. its 125-day Moving Average.
Stock Price Strength: Stocks hitting 52-week highs vs. those hitting 52-week lows.
Stock Price Breadth: Measured by the McClellan Volume Summation Index (or similar volume/breadth metric).
Put/Call Ratio: The relationship between volume of put options (bearish bets) and call options (bullish bets).
Market Volatility: The CBOE VIX Index relative to its 50-day Moving Average.
Safe Haven Demand: The relative performance of stocks (S&P 500) vs. bonds.
Junk Bond Demand: The spread between high-yield (junk) bonds and U.S. Treasury yields.
Critical Adaptations for Backtesting
To improve the index's utility for quantitative analysis, the following changes were made:
Long-Term Normalization: The original normalization method (ta.stdev over a short LENGTH) has been replaced or adjusted to use longer historical data. This change ensures the index generates consistent and comparable sentiment scores across decades of market history, which is crucial for reliable backtesting results.
Updated Data Sources: Specific ticker requests for the Put/Call Ratio and Bond components (Safe Haven and Junk Bond Demand) have been updated to use the most reliable and long-running data available on TradingView, reducing data gaps and improving chart continuity.
Simplified Visuals: The chart display is streamlined, focusing only on the final Fear & Greed Index line and key threshold levels (25, 50, 75) for quick visual assessment.
Integrated Trading Strategy
This script also includes a simple, rules-based strategy designed to test the counter-trend philosophy of the index:
Entry Logic (Long Position): A long position is initiated when the market shows increasing fear, specifically when the index score is less than or equal to the configurable FEAR_LEVEL (default 25) and the index crosses above its own short-term 5-period Simple Moving Average (SMA). This crossover acts as a confirmation that sentiment may be starting to turn around from peak fear.
Exit Logic (Time-Based): All positions are subject to a time-based exit after holding for 252 trading days (approximately one year). This fixed holding period aims to capture the typical duration of a cyclical market recovery following a major panic event.

RSI + MACD Multi-Timeframe StrategyThis strategy combines the Relative Strength Index (RSI) from the daily timeframe with the Moving Average Convergence Divergence (MACD) from the 4-hour timeframe to generate precise long entry and exit signals.
The system uses a multi-timeframe approach to align longer-term trend conditions with shorter-term momentum shifts — allowing traders to catch dips with confirmation and exit before reversals.
🧠 Strategy Logic
✅ Long Entry Condition:
- RSI on the daily (1D) timeframe is oversold (below your defined threshold)
- MACD on the 4H timeframe crosses above the signal line
→ A long trade is opened when these two align
✅ Long Exit Condition:
- RSI on the daily timeframe is overbought
- MACD on the 4H timeframe crosses below the signal line
→ The long trade is closed when these two conditions are met
💡 This strategy currently supports long entries only. Short logic can be added if needed.
📊 Indicator Components
🔹 RSI (Relative Strength Index):
- A momentum oscillator that measures the speed and magnitude of price changes.
- Helps identify overbought (potential sell) and oversold (potential buy) conditions.
- Applied on the 1D timeframe (by default) to reflect broader market trend or exhaustion levels.
🔹 MACD (Moving Average Convergence Divergence):
- A trend-following momentum indicator based on moving averages.
- The MACD Line (fast EMA - slow EMA) crossing above the Signal Line indicates bullish momentum.
- Used here on the 4-hour timeframe (by default) for shorter-term momentum confirmation.
🔹 Multi-Timeframe (MTF) Logic:
- Uses request.security() to pull higher timeframe data (1D for RSI, 4H for MACD).
- Ensures no repainting, as it only uses closed candles from the higher timeframe.
- Aligns longer-term signals with shorter-term entries, reducing false signals.
📈 Plotting Options
The script includes a plot selector input allowing you to toggle between:
- RSI Plot (with overbought/oversold lines)
- MACD Plot (MACD line and signal line)
- This helps visualize signal conditions clearly on your chart.
🛠 Customization
- RSI & MACD settings are fully configurable
- RSI and MACD timeframes can be adjusted independently
⚠️ Disclaimer
This strategy is provided for educational and informational purposes only.
It is not financial advice or a recommendation to buy or sell any asset.
Past performance does not guarantee future results. Always test strategies in a simulated environment before live use, and consult with a licensed financial advisor for investment decisions.

Turtles StrategyBorn from the 1980s "Turtle" experiment, this method of trading captures breakouts and places or closes trades with intrabar entries or exits and realized-equity risk controls.
How It Works
The strategy buys/sells on breakouts from recent highs/lows, using ATR for volatility-adjusted stops and sizing. It risks a fixed % (default 1%) of realized equity per trade—initial capital plus closed P&L, ignoring open positions for conservatism. Drawdown protection auto-reduces risk by 20% at 10% drops (up to three times), resetting only on full peak recovery. Single positions only, with 1-tick slippage simulated for realistic fills. Best for trending assets like forex,commodities, crypto, stocks. Backtest for optimal parameters.
Main Operations
The strategy works on any timeframe but it's meant to be used on daily charts.
Entry Signals:
Long: Buy-stop 1 tick above 20-bar high (default "Entry Period") when no position—enters intrabar on breakout.
Short: Sell-stop 1 tick below 20-bar low. OCA cancels opposites.
Size: (Realized equity × adjusted risk %) ÷ (2× ATR stop distance), scaled by point value.
Exit Signals:
Longs: Stop at tighter of (entry - 2× ATR) or (10-bar low - 1 tick trailing, default "Exit Period").
Shorts: Stop at tighter of (entry + 2× ATR) or (10-bar high + 1 tick trailing).
Locks profits in trends, exits fast on fades.
Risk Controls:
Tracks realized equity peak.
10% drawdown: Risk ×0.8; 20%/30%: Further ×0.8 (max 3x).
Full reset above peak—preserves capital in slumps.

HEK Dinamik Fiyat Kanalı Stratejisi v1HEK Dynamic Price Channel Strategy
Concept
The HEK Dynamic Price Channel provides a channel structure that expands and contracts according to price momentum and time-based equilibrium.
Unlike fixed-band systems, it evaluates the interaction between price and its balance line through an adaptive channel width that dynamically adjusts to changing market conditions.
How It Works
When the price reacts to the midline, the channel bands automatically reposition themselves.
Touching the upper band indicates a strengthening trend, while touching the lower band signals weakening momentum.
This adaptive mechanism helps filter out false signals during sudden directional changes, enhancing overall signal quality.
Advantages
✅ Maintains trend continuity while avoiding overtrading.
✅ Automatically adapts to changing volatility conditions.
✅ Detects early signals of short- and mid-term trend reversals.
Applications
Directional confirmation in spot and futures markets.
A supporting tool in channel breakout strategies.
Identifying price consolidation and equilibrium zones.
Note
This strategy is intended for educational and research purposes only.
It should not be considered financial advice. Always consult a professional financial advisor before making investment decisions.
© HEK — Adaptive Channel Approach on Dynamic Market Structures
6 gün önce
Sürüm Notları
HEK Dynamic Price Channel Strategy
Concept
The HEK Dynamic Price Channel provides a channel structure that expands and contracts according to price momentum and time-based equilibrium.
Unlike fixed-band systems, it evaluates the interaction between price and its balance line through an adaptive channel width that dynamically adjusts to changing market conditions.
How It Works
When the price reacts to the midline, the channel bands automatically reposition themselves.
Touching the upper band indicates a strengthening trend, while touching the lower band signals weakening momentum.
This adaptive mechanism helps filter out false signals during sudden directional changes, enhancing overall signal quality.
Advantages
✅ Maintains trend continuity while avoiding overtrading.
✅ Automatically adapts to changing volatility conditions.
✅ Detects early signals of short- and mid-term trend reversals.
Applications
Directional confirmation in spot and futures markets.
A supporting tool in channel breakout strategies.
Identifying price consolidation and equilibrium zones.
Note
This strategy is intended for educational and research purposes only.
It should not be considered financial advice. Always consult a professional financial advisor before making investment decisions.
© HEK — Adaptive Channel Approach on Dynamic Market Structures

Gold 15m: Trend + S/R + Liquidity Sweep (RR 1:2)This strategy is designed for short-term trading on XAUUSD (Gold) using the 15-minute timeframe. It combines trend direction, support/resistance pivots, liquidity sweep detection, and momentum confirmation to identify high-probability reversal setups in line with the dominant market trend.
⚙️ Core Logic:
Trend Filter (EMA 200):
The strategy only takes long positions when price is above the 200 EMA and short positions when price is below it.
Support/Resistance via Pivots:
Dynamic swing highs and lows are identified using pivot points. These act as local supply and demand levels where liquidity is likely to accumulate.
Liquidity Sweep Detection:
A bullish liquidity sweep occurs when price briefly breaks below the last pivot low (grabbing liquidity) and then closes back above it.
A bearish sweep occurs when price breaks above the last pivot high and then closes back below.
Momentum & Candle Strength:
The strategy filters signals based on candle range and body size to ensure entries occur during strong price reactions, not weak retracements.
Risk Management (1:2 RR):
Stop-loss is placed slightly beyond the last pivot level using ATR-based buffers, and take-profit is set at 2× the risk distance, maintaining a reward-to-risk ratio of 1:2.
💼 Trade Logic Summary:
Long Entry:
After a bullish liquidity sweep & reclaim, momentum confirmation, and trend alignment (above EMA 200).
Short Entry:
After a bearish sweep & reclaim, momentum confirmation, and trend alignment (below EMA 200).
Exit:
Automated via ATR-based Stop Loss and Take Profit targets.
📊 Customization Options:
Adjustable EMA length, pivot settings, ATR multipliers, and RR ratio.
Option to enable/disable trend filter.
Toggle display of S/R zones on chart.
🧠 Best Use:
Works best during London and New York sessions when Gold shows strong momentum.
Can be adapted for forex pairs and indices by tuning ATR and pivot parameters.

VWAP Retest + EMA9 Cross + Candle Pattern V2📈 VWAP Retest + EMA9 Cross + Candle Pattern Strategy_V2
Setup: This intraday momentum strategy combines 3 core elements:
• VWAP Retest: Price retests VWAP within a small buffer zone
• EMA9 Crossover: EMA9 crosses above VWAP within the last 3 bars
• Bullish Candle Pattern: At least one bullish signal — Hammer, Engulfing, or Momentum candle
A trade is triggered only during the US morning session (9:30–12:30 EST) and only if price is above yesterday’s high, suggesting strong momentum.
⚙️ Strategy Settings
• Initial Capital: $100,000
• Position Sizing: 10% of equity per trade
• Commission: 0.03% per trade
• Slippage: 1 tick
• Take Profit: +3% from entry
• Stop Loss: 0.5% below VWAP at entry
• Forced Exit: 1:00 PM EST
📊 Strategy Logic
• VWAP Retest Filter ensures entry is near a value zone.
• EMA9 Cross Confirmation aligns short-term momentum with volume-weighted price.
• Bullish Candle Patterns provide price action confirmation:
○ ✅ Hammer
○ ✅ Bullish Engulfing
○ ✅ Large momentum body
• Above Yesterday’s High (YH) acts as a bullish bias filter.
🧪 Backtest Results (Jan 2023 – Oct 2025)
• Total Trades: 120
• Win Rate: 52.5%
• Profit Factor: 1.18
• Max Drawdown: 1.22%
• Net P&L: +$1,064 (+1.06%)
Due to chart data limits, only part of the period may be visible on publication charts.
🔍 Chart Visuals
This strategy plots:
• VWAP (white) and EMA9 (orange)
• Candle pattern markers:
○ “H” = Hammer
○ “BE” = Bullish Engulfing
○ “M” = Momentum Candle
• “SETUP” label when all conditions are met
• YH/YL labels for context — previous day’s high/low
💡 Use Case
This setup is designed for intraday momentum scalping, ideal for traders who:
• Trade morning breakouts
• Use VWAP as a dynamic support/resistance
• Want clear, rule-based entries based on both trend and price action
Educational and research use - not financial advice.

AVWAP+RSI Confluence — 1R TesterRSI + 1R ATR - Monthly P\&L (v4)
WHAT THIS STRATEGY DOES (OVERVIEW)
* Pine strategy (v4) that combines a simple momentum trigger with a symmetric 1R ATR risk model and an on-chart Monthly/Yearly P\&L table.
* Momentum filter: trades only when RSI crosses its own SMA in the direction of the trend (price vs Trend EMA).
* Risk engine: exits use fixed 1R ATR brackets captured at entry (no drifting targets/stops).
* Accounting: the table aggregates percentage returns by month and year using strategy equity.
ENTRY LOGIC (LONGS & OPTIONAL SHORTS)
Indicators used:
* RSI(rsiLen) and its SMA: SMA(RSI, rsiMaLen)
* Trend filter: EMA(emaTrendLen) on price
Longs:
1. RSI crosses above its RSI SMA
2. RSI > rsiBuyThr (filters weak momentum)
3. Close > EMA(emaTrendLen)
Shorts (optional via enableShort):
1. RSI crosses below its RSI SMA
2. RSI < rsiSellThr
3. Close < EMA(emaTrendLen)
EXIT LOGIC AND RISK MODEL (1R ATR)
* On entry, snapshot ATR(atrLen) into atrAtEntry and the average fill price into entryPx.
* Longs: stop = entryPx - ATR \* atrMult; target = entryPx + ATR \* atrMult
* Shorts: mirrored.
* Stops and targets are posted immediately and remain fixed for the life of the trade.
POSITION SIZING AND COSTS
* Default position size: 25% of equity per trade (adjustable in Properties/inputs).
* Commission percent and a small slippage are set in strategy() so backtests include friction by default.
MONTHLY / YEARLY P\&L TABLE (HOW IT WORKS)
* Uses strategy equity to compute bar returns: equity / equity\ - 1.
* Compounds bar returns into current month and current year; commits each finished period at month/year change (or last bar).
* Renders rows as years; columns Jan..Dec plus a Year total column.
* Cells colored by sign; precision and maximum rows are controlled by inputs.
* Values represent percentage returns, not currency P\&L.
VISUAL AIDS
* Two pivot trails (pivot high/low) are plotted for context only; they do not affect entries or exits.
CUSTOMIZATION TIPS
* Raise rsiBuyThr (long) or lower rsiSellThr (short) to filter weak momentum.
* Increase emaTrendLen to tighten trend alignment.
* Adjust atrLen and atrMult to fit your timeframe/instrument volatility.
* Leave enableShort = false if you prefer long-only behavior or shorting is constrained.
NON-REPAINTING AND BACKTEST NOTES
* Signals use bar-close crosses of built-in indicators (RSI, EMA, ATR); no future bars are referenced.
* calc\_on\_every\_tick = true for responsive visuals; Strategy Tester evaluates on bar close in history.
* Backtest stop/limit fills are simulated and may differ from live execution/liquidity.
DISCLAIMERS
* Educational use only. This is not financial advice. Markets involve risk. Past performance does not guarantee future results.
INPUTS (QUICK REFERENCE)
* rsiLen, rsiMaLen, rsiBuyThr, rsiSellThr
* emaTrendLen
* atrLen, atrMult, enableShort
* leftBars, rightBars, prec, showTable, maxYearsRows
SHORT TAGLINE
RSI momentum with 1R ATR brackets and a built-in Monthly/Yearly P\&L table.
TAGS
strategy, RSI, ATR, trend, risk-management, backtest, Pine-v4

The Barking Rat LiteMomentum & FVG Reversion Strategy
The Barking Rat Lite is a disciplined, short-term mean-reversion strategy that combines RSI momentum filtering, EMA bands, and Fair Value Gap (FVG) detection to identify short-term reversal points. Designed for practical use on volatile markets, it focuses on precise entries and ATR-based take profit management to balance opportunity and risk.
Core Concept
This strategy seeks potential reversals when short-term price action shows exhaustion outside an EMA band, confirmed by momentum and FVG signals:
EMA Bands:
Parameters used: A 20-period EMA (fast) and 100-period EMA (slow).
Why chosen:
- The 20 EMA is sensitive to short-term moves and reflects immediate momentum.
- The 100 EMA provides a slower, structural anchor.
When price trades outside both bands, it often signals overextension relative to both short-term and medium-term trends.
Application in strategy:
- Long entries are only considered when price dips below both EMAs, identifying potential undervaluation.
- Short entries are only considered when price rises above both EMAs, identifying potential overvaluation.
This dual-band filter avoids counter-trend signals that would occur if only a single EMA was used, making entries more selective..
Fair Value Gap Detection (FVG):
Parameters used: The script checks for dislocations using a 12-bar lookback (i.e. comparing current highs/lows with values 12 candles back).
Why chosen:
- A 12-bar displacement highlights significant inefficiencies in price structure while filtering out micro-gaps that appear every few bars in high-volatility markets.
- By aligning FVG signals with candle direction (bullish = close > open, bearish = close < open), the strategy avoids random gaps and instead targets ones that suggest exhaustion.
Application in strategy:
- Bullish FVGs form when earlier lows sit above current highs, hinting at downward over-extension.
- Bearish FVGs form when earlier highs sit below current lows, hinting at upward over-extension.
This gives the strategy a structural filter beyond simple oscillators, ensuring signals have price-dislocation context.
RSI Momentum Filter:
Parameters used: 14-period RSI with thresholds of 80 (overbought) and 20 (oversold).
Why chosen:
- RSI(14) is a widely recognized momentum measure that balances responsiveness with stability.
- The thresholds are intentionally extreme (80/20 vs. the more common 70/30), so the strategy only engages at genuine exhaustion points rather than frequent minor corrections.
Application in strategy:
- Longs trigger when RSI < 20, suggesting oversold exhaustion.
- Shorts trigger when RSI > 80, suggesting overbought exhaustion.
This ensures entries are not just technically valid but also backed by momentum extremes, raising conviction.
ATR-Based Take Profit:
Parameters used: 14-period ATR, with a default multiplier of 4.
Why chosen:
- ATR(14) reflects the prevailing volatility environment without reacting too much to outliers.
- A multiplier of 4 is a pragmatic compromise: wide enough to let trades breathe in volatile conditions, but tight enough to enforce disciplined exits before mean reversion fades.
Application in strategy:
- At entry, a fixed target is set = Entry Price ± (ATR × 4).
- This target scales automatically with volatility: narrower in calm periods, wider in explosive markets.
By avoiding discretionary exits, the system maintains rule-based discipline.
Visual Signals on Chart
Blue “▲” below candle: Potential long entry
Orange/Yellow “▼” above candle: Potential short entry
Green “✔️”: Trade closed at ATR take profit
Blue (20 EMA) & Orange (100 EMA) lines: Dynamic channel reference
⚙️Strategy report properties
Position size: 25% equity per trade
Initial capital: 10,000.00 USDT
Pyramiding: 10 entries per direction
Slippage: 2 ticks
Commission: 0.055% per side
Backtest timeframe: 1-minute
Backtest instrument: HYPEUSDT
Backtesting range: Jul 28, 2025 — Aug 17, 2025
Note on Sample Size:
You’ll notice the report displays fewer than the ideal 100 trades in the strategy report above. This is intentional. The goal of the script is to isolate high-quality, short-term reversal opportunities while filtering out low-conviction setups. This means that the Barking Rat Lite strategy is very selective, filtering out over 90% of market noise. The brief timeframe shown in the strategy report here illustrates its filtering logic over a short window — not its full capabilities. As a result, even on lower timeframes like the 1-minute chart, signals are deliberately sparse — each one must pass all criteria before triggering.
For a larger dataset:
Once the strategy is applied to your chart, users are encouraged to expand the lookback range or apply the strategy to other volatile pairs to view a full sample.
💡Why 25% Equity Per Trade?
While it's always best to size positions based on personal risk tolerance, we defaulted to 25% equity per trade in the backtesting data — and here’s why:
Backtests using this sizing show manageable drawdowns even under volatile periods.
The strategy generates a sizeable number of trades, reducing reliance on a single outcome.
Combined with conservative filters, the 25% setting offers a balance between aggression and control.
Users are strongly encouraged to customize this to suit their risk profile.
What makes Barking Rat Lite valuable
Combines multiple layers of confirmation: EMA bands + FVG + RSI
Adaptive to volatility: ATR-based exits scale with market conditions
Clear, actionable visuals: Easy to monitor and manage trades

Dskyz (DAFE) GENESIS Dskyz (DAFE) GENESIS: Adaptive Quant, Real Regime Power
Let’s be honest: Most published strategies on TradingView look nearly identical—copy-paste “open-source quant,” generic “adaptive” buzzwords, the same shallow explanations. I’ve even fallen into this trap with my own previously posted strategies. Not this time.
What Makes This Unique
GENESIS is not a black-box mashup or a pre-built template. It’s the culmination of DAFE’s own adaptive, multi-factor, regime-aware quant engine—built to outperform, survive, and visualize live edge in anything from NQ/MNQ to stocks and crypto.
True multi-factor core: Volume/price imbalances, trend shifts, volatility compression/expansion, and RSI all interlock for signal creation.
Adaptive regime logic: Trades only in healthy, actionable conditions—no “one-size-fits-all” signals.
Momentum normalization: Uses rolling, percentile-based fast/slow EMA differentials, ALWAYS normalized, ALWAYS relevant—no “is it working?” ambiguity.
Position sizing that adapts: Not fixed-lot, not naive—not a loophole for revenge trading.
No hidden DCA or pyramiding—what you see is what you trade.
Dashboard and visual system: Directly connected to internal logic. If it’s shown, it’s used—and nothing cosmetic is presented on your chart that isn’t quantifiable.
📊 Inputs and What They Mean (Read Carefully)
Maximum Raw Score: How many distinct factors can contribute to regime/trade confidence (default 4). If you extend the quant logic, increase this.
RSI Length / Min RSI for Shorts / Max RSI for Longs: Fine-tunes how “overbought/oversold” matters; increase the length for smoother swings, tighten floors/ceilings for more extreme signals.
⚡ Regime & Momentum Gates
Min Normed Momentum/Score (Conf): Raise to demand only the strongest trends—your filter to avoid algorithmic chop.
🕒 Volatility & Session
ATR Lookback, ATR Low/High Percentile: These control your system’s awareness of when the market is dead or ultra-volatile. All sizing and filter logic adapts in real time.
Trading Session (hours): Easy filter for when entries are allowed; default is regular trading hours—no surprise overnight fills.
📊 Sizing & Risk
Max Dollar Risk / Base-Max Contracts: All sizing is adaptive, based on live regime and volatility state—never static or “just 1 contract.” Control your max exposures and real $ risk. ATR will effect losses in high volatility times.
🔄 Exits & Scaling
Stop/Trail/Scale multipliers: You choose how dynamic/flexible risk controls and profit-taking need to be. ATR-based, so everything auto-adjusts to the current market mode.
Visuals That Actually Matter
Dashboard (Top Right): Shows only live, relevant stats: scoring, status, position size, win %, win streak, total wins—all from actual trade engine state (not “simulated”).
Watermark (Bottom Right): Momentum bar visual is always-on, regime-aware, reflecting live regime confidence and momentum normalization. If the bar is empty, you’re truly in no-momentum. If it glows lime, you’re riding the strongest possible edge.
*No cosmetics, no hidden code distractions.
Backtest Settings
Initial capital: $10,000
Commission: Conservative, realistic roundtrip cost:
15–20 per contract (including slippage per side) I set this to $25
Slippage: 3 ticks per trade
Symbol: CME_MINI:NQ1!
Timeframe: 1 min (but works on all timeframes)
Order size: Adaptive, 1–3 contracts
No pyramiding, no hidden DCA
Why these settings?
These settings are intentionally strict and realistic, reflecting the true costs and risks of live trading. The 10,000 account size is accessible for most retail traders. 25/contract including 3 ticks of slippage are on the high side for NQ, ensuring the strategy is not curve-fit to perfect fills. If it works here, it will work in real conditions.
Why It Wins
While others put out “AI-powered” strategies with little logic or soul, GENESIS is ruthlessly practical. It is built around what keeps traders alive:
- Context-aware signals, not just patterns
- Tight, transparent risk
- Inputs that adapt, not confuse
- Visuals that clarify, not distract
- Code that runs clean, efficient, and with minimal overfitting risk (try it on QQQ, AMD, SOL, etc. out of the box)
Disclaimer (for TradingView compliance):
Trading is risky. Futures, stocks, and crypto can result in significant losses. Do not trade with funds you cannot afford to lose. This is for educational and informational purposes only. Use in simulation/backtest mode before live trading. No past performance is indicative of future results. Always understand your risk and ownership of your trades.
This will not be my last—my goal is to keep raising the bar until DAFE is a brand or I’m forced to take this private.
Use with discipline, use with clarity, and always trade smarter.
— Dskyz , powered by DAFE Trading Systems.

Dskyz (DAFE) Quantum Sentiment Flux - Beginners Dskyz (DAFE) Quantum Sentiment Flux - Beginners:
Welcome to the Dskyz (DAFE) Quantum Sentiment Flux - Beginners , a strategy and concept that’s your ultimate wingman for trading futures like MNQ, NQ, MES, and ES. This gem combines lightning-fast momentum signals, market sentiment smarts, and bulletproof risk management into a system so intuitive, even newbies can trade like pros. With clean DAFE visuals, preset modes for every vibe, and a revamped dashboard that’s basically a market GPS, this strategy makes futures trading feel like a high-octane sci-fi mission.
Built on the Dskyz (DAFE) legacy of Aurora Divergence, the Quantum Sentiment Flux is designed to empower beginners while giving seasoned traders a lean, sentiment-driven edge. It uses fast/slow EMA crossovers for entries, filters trades with VIX, SPX trends, and sector breadth, and keeps your account safe with adaptive stops and cooldowns. Tuned for more action with faster signals and a slick bottom-left dashboard, this updated version is ready to light up your charts and outsmart institutional traps. Let’s dive into why this strat’s a must-have and break down its brilliance.
Why Traders Need This Strategy
Futures markets are a wild ride—fast moves, volatility spikes (like the April 28, 2025 NQ 1k-point drop), and institutional games that can wreck unprepared traders. Beginners often get lost in complex systems or burned by impulsive trades. The Quantum Sentiment Flux is the antidote, offering:
Dead-Simple Setup: Preset modes (Aggressive, Balanced, Conservative) auto-tune signals, risk, and sizing, so you can trade without a quant degree.
Sentiment Superpower: VIX filter, SPX trend, and sector breadth visuals keep you aligned with market health, dodging chop and riding trends.
Ironclad Safety: Tighter ATR-based stops, 2:1 take-profits, and preset cooldowns protect your capital, even in chaotic sessions.
Next-Level Visuals: Green/red entry triangles, vibrant EMAs, a sector breadth background, and a beefed-up dashboard make signals and context pop.
DAFE Swagger: The clean aesthetics, sleek dashboard—ties it to Dskyz’s elite brand, making your charts a work of art.
Traders need this because it’s a plug-and-play system that blends beginner-friendly simplicity with pro-level market awareness. Whether you’re just starting or scalping 5min MNQ, this strat’s your key to trading with confidence and style.
Strategy Components
1. Core Signal Logic (High-Speed Momentum)
The strategy’s engine is a momentum-based system using fast and slow Exponential Moving Averages (EMAs), now tuned for faster, more frequent trades.
How It Works:
Fast/Slow EMAs: Fast EMA (Aggressive: 5, Balanced: 7, Conservative: 9 bars) and slow EMA (12/14/18 bars) track short-term vs. longer-term momentum.
Crossover Signals:
Buy: Fast EMA crosses above slow EMA, and trend_dir = 1 (fast EMA > slow EMA + ATR * strength threshold).
Sell: Fast EMA crosses below slow EMA, and trend_dir = -1 (fast EMA < slow EMA - ATR * strength threshold).
Strength Filter: ma_strength = fast EMA - slow EMA must exceed an ATR-scaled threshold (Aggressive: 0.15, Balanced: 0.18, Conservative: 0.25) for robust signals.
Trend Direction: trend_dir confirms momentum, filtering out weak crossovers in choppy markets.
Evolution:
Faster EMAs (down from 7–10/21–50) catch short-term trends, perfect for active futures markets.
Lower strength thresholds (0.15–0.25 vs. 0.3–0.5) make signals more sensitive, boosting trade frequency without sacrificing quality.
Preset tuning ensures beginners get optimized settings, while pros can tweak via mode selection.
2. Market Sentiment Filters
The strategy leans hard into market sentiment with a VIX filter, SPX trend analysis, and sector breadth visuals, keeping trades aligned with the big picture.
VIX Filter:
Logic: Blocks long entries if VIX > threshold (default: 20, can_long = vix_close < vix_limit). Shorts are always allowed (can_short = true).
Impact: Prevents longs during high-fear markets (e.g., VIX spikes in crashes), while allowing shorts to capitalize on downturns.
SPX Trend Filter:
Logic: Compares S&P 500 (SPX) close to its SMA (Aggressive: 5, Balanced: 8, Conservative: 12 bars). spx_trend = 1 (UP) if close > SMA, -1 (DOWN) if < SMA, 0 (FLAT) if neutral.
Impact: Provides dashboard context, encouraging trades that align with market direction (e.g., longs in UP trend).
Sector Breadth (Visual):
Logic: Tracks 10 sector ETFs (XLK, XLF, XLE, etc.) vs. their SMAs (same lengths as SPX). Each sector scores +1 (bullish), -1 (bearish), or 0 (neutral), summed as breadth (-10 to +10).
Display: Green background if breadth > 4, red if breadth < -4, else neutral. Dashboard shows sector trends (↑/↓/-).
Impact: Faster SMA lengths make breadth more responsive, reflecting sector rotations (e.g., tech surging, energy lagging).
Why It’s Brilliant:
- VIX filter adds pro-level volatility awareness, saving beginners from panic-driven losses.
- SPX and sector breadth give a 360° view of market health, boosting signal confidence (e.g., green BG + buy signal = high-probability trade).
- Shorter SMAs make sentiment visuals react faster, perfect for 5min charts.
3. Risk Management
The risk controls are a fortress, now tighter and more dynamic to support frequent trading while keeping accounts safe.
Preset-Based Risk:
Aggressive: Fast EMAs (5/12), tight stops (1.1x ATR), 1-bar cooldown. High trade frequency, higher risk.
Balanced: EMAs (7/14), 1.2x ATR stops, 1-bar cooldown. Versatile for most traders.
Conservative: EMAs (9/18), 1.3x ATR stops, 2-bar cooldown. Safer, fewer trades.
Impact: Auto-scales risk to match style, making it foolproof for beginners.
Adaptive Stops and Take-Profits:
Logic: Stops = entry ± ATR * atr_mult (1.1–1.3x, down from 1.2–2.0x). Take-profits = entry ± ATR * take_mult (2x stop distance, 2:1 reward/risk). Longs: stop below entry, TP above; shorts: vice versa.
Impact: Tighter stops increase trade turnover while maintaining solid risk/reward, adapting to volatility.
Trade Cooldown:
Logic: Preset-driven (Aggressive/Balanced: 1 bar, Conservative: 2 bars vs. old user-input 2). Ensures bar_index - last_trade_bar >= cooldown.
Impact: Faster cooldowns (especially Aggressive/Balanced) allow more trades, balanced by VIX and strength filters.
Contract Sizing:
Logic: User sets contracts (default: 1, max: 10), no preset cap (unlike old 7/5/3 suggestion).
Impact: Flexible but risks over-leverage; beginners should stick to low contracts.
Built To Be Reliable and Consistent:
- Tighter stops and faster cooldowns make it a high-octane system without blowing up accounts.
- Preset-driven risk removes guesswork, letting newbies trade confidently.
- 2:1 TPs ensure profitable trades outweigh losses, even in volatile sessions like April 27, 2025 ES slippage.
4. Trade Entry and Exit Logic
The entry/exit rules are simple yet razor-sharp, now with VIX filtering and faster signals:
Entry Conditions:
Long Entry: buy_signal (fast EMA crosses above slow EMA, trend_dir = 1), no position (strategy.position_size = 0), cooldown passed (can_trade), and VIX < 20 (can_long). Enters with user-defined contracts.
Short Entry: sell_signal (fast EMA crosses below slow EMA, trend_dir = -1), no position, cooldown passed, can_short (always true).
Logic: Tracks last_entry_bar for visuals, last_trade_bar for cooldowns.
Exit Conditions:
Stop-Loss/Take-Profit: ATR-based stops (1.1–1.3x) and TPs (2x stop distance). Longs exit if price hits stop (below) or TP (above); shorts vice versa.
No Other Exits: Keeps it straightforward, relying on stops/TPs.
5. DAFE Visuals
The visuals are pure DAFE magic, blending clean function with informative metrics utilized by professionals, now enhanced by faster signals and a responsive breadth background:
EMA Plots:
Display: Fast EMA (blue, 2px), slow EMA (orange, 2px), using faster lengths (5–9/12–18).
Purpose: Highlights momentum shifts, with crossovers signaling entries.
Sector Breadth Background:
Display: Green (90% transparent) if breadth > 4, red (90%) if breadth < -4, else neutral.
Purpose: Faster breadth_sma_len (5–12 vs. 10–50) reflects sector shifts in real-time, reinforcing signal strength.
- Visuals are intuitive, turning complex signals into clear buy/sell cues.
- Faster breadth background reacts to market rotations (e.g., tech vs. energy), giving a pro-level edge.
6. Sector Breadth Dashboard
The new bottom-left dashboard is a game-changer, a 3x16 table (black/gray theme) that’s your market command center:
Metrics:
VIX: Current VIX (red if > 20, gray if not).
SPX: Trend as “UP” (green), “DOWN” (red), or “FLAT” (gray).
Trade Longs: “OK” (green) if VIX < 20, “BLOCK” (red) if not.
Sector Breadth: 10 sectors (Tech, Financial, etc.) with trend arrows (↑ green, ↓ red, - gray).
Placeholder Row: Empty for future metrics (e.g., ATR, breadth score).
Purpose: Consolidates regime, volatility, market trend, and sector data, making decisions a breeze.
- VIX and SPX metrics add context, helping beginners avoid bad trades (e.g., no longs if “BLOCK”).
Sector arrows show market health at a glance, like a cheat code for sentiment.
Key Features
Beginner-Ready: Preset modes and clear visuals make futures trading a breeze.
Sentiment-Driven: VIX filter, SPX trend, and sector breadth keep you in sync with the market.
High-Frequency: Faster EMAs, tighter stops, and short cooldowns boost trade volume.
Safe and Smart: Adaptive stops/TPs and cooldowns protect capital while maximizing wins.
Visual Mastery: DAFE’s clean flair, EMAs, dashboard—makes trading fun and clear.
Backtestable: Lean code and fixed qty ensure accurate historical testing.
How to Use
Add to Chart: Load on a 5min MNQ/ES chart in TradingView.
Pick Preset: Aggressive (scalping), Balanced (versatile), or Conservative (safe). Balanced is default.
Set Contracts: Default 1, max 10. Stick low for safety.
Check Dashboard: Bottom-left shows preset, VIX, SPX, and sectors. “OK” + green breadth = strong buy.
Backtest: Run in strategy tester to compare modes.
Live Trade: Connect to Tradovate or similar. Watch for slippage (e.g., April 27, 2025 ES issues).
Replay Test: Try April 28, 2025 NQ drop to see VIX filter and stops in action.
Why It’s Brilliant
The Dskyz (DAFE) Quantum Sentiment Flux - Beginners is a masterpiece of simplicity and power. It takes pro-level tools—momentum, VIX, sector breadth—and wraps them in a system anyone can run. Faster signals and tighter stops make it a trading machine, while the VIX filter and dashboard keep you ahead of market chaos. The DAFE visuals and bottom-left command center turn your chart into a futuristic cockpit, guiding you through every trade. For beginners, it’s a safe entry to futures; for pros, it’s a scalping beast with sentiment smarts. This strat doesn’t just trade—it transforms how you see the market.
Final Notes
This is more than a strategy—it’s your launchpad to mastering futures with Dskyz (DAFE) flair. The Quantum Sentiment Flux blends accessibility, speed, and market savvy to help you outsmart the game. Load it, watch those triangles glow, and let’s make the markets your canvas!
Official Statement from Pine Script Team
(see TradingView help docs and forums):
"This warning may appear when you call functions such as ta.sma inside a request.security in a loop. There is no runtime impact. If you need to loop through a dynamic list of tickers, this cannot be avoided in the present version... Values will still be correct. Ignore this warning in such contexts."
(This publishing will most likely be taken down do to some miscellaneous rule about properly displaying charting symbols, or whatever. Once I've identified what part of the publishing they want to pick on, I'll adjust and repost.)
Use it with discipline. Use it with clarity. Trade smarter.
**I will continue to release incredible strategies and indicators until I turn this into a brand or until someone offers me a contract.
Created by Dskyz, powered by DAFE Trading Systems. Trade fast, trade bold.

BONK 1H Long Volatility StrategyGrok 1hr bonk strategy:
Key Changes and Why They’re Made
1. Indicator Adjustments
Moving Averages:
Fast MA: Changed to 5 periods (from, e.g., 9 on a higher timeframe).
Slow MA: Changed to 13 periods (from, e.g., 21).
Why: Shorter periods make the moving averages more sensitive to quick price changes on the 1-hour chart, helping identify trends faster.
ATR (Average True Range):
Length: Set to 10 periods (down from, e.g., 14).
Multiplier: Reduced to 1.5 (from, e.g., 2.0).
Why: A shorter ATR length tracks recent volatility better, and a lower multiplier lets the strategy catch smaller price swings, which are more common hourly.
RSI:
Kept at 14 periods with an overbought level of 70.
Why: RSI stays the same to filter out overbought conditions, maintaining consistency with the original strategy.
2. Entry Conditions
Trend: Requires the fast MA to be above the slow MA, ensuring a bullish direction.
Volatility: The candle’s range (high - low) must exceed 1.5 times the ATR, confirming a significant move.
Momentum: RSI must be below 70, avoiding entries at potential peaks.
Price: The close must be above the fast MA, signaling a pullback or trend continuation.
Why: These conditions are tightened to capture frequent volatility spikes while filtering out noise, which is more prevalent on a 1-hour chart.
3. Exit Strategy
Profit Target: Default is 5% (adjustable from 3-7%).
Stop-Loss: Default is 3% (adjustable from 1-5%).
Why: These levels remain conservative to lock in gains quickly and limit losses, suitable for the faster pace of a 1-hour timeframe.
4. Risk Management
The strategy may trigger more trades on a 1-hour chart. To avoid overtrading:
The ATR filter ensures only volatile moves are traded.
Trading fees (e.g., 0.5% on Coinbase) reduce the net profit to ~4% on winners and -3.5% on losers, requiring a win rate above 47% for profitability.
Suggestion: Risk only 1-2% of your capital per trade to manage exposure.
5. Visuals and Alerts
Plots: Blue fast MA, red slow MA, and green triangles for buy signals.
Alerts: Trigger when an entry condition is met, so you don’t need to watch the chart constantly.
How to Use the Strategy
Setup:
Load TradingView, select BONK/USD on the 1-hour chart (Coinbase pair).
Paste the script into the Pine Editor and add it to your chart.
Customize:
Adjust the profit target (e.g., 5%) and stop-loss (e.g., 3%) to your preference.
Tweak ATR or MA lengths if BONK’s volatility shifts.
Trade:
Look for green triangle signals and confirm with market context (e.g., volume or news).
Enter trades manually or via TradingView’s broker tools if supported.
Exit when the profit target or stop-loss is hit.
Test:
Use TradingView’s Strategy Tester to backtest on historical data and refine settings.
Benefits of the 1-Hour Timeframe
Faster Opportunities: Captures shorter-term uptrends in BONK’s volatile price action.
Responsive: Adjusted indicators react quickly to hourly changes.
Conservative: Maintains the 3-7% profit goal with tight risk control.
Potential Challenges
Noise: The 1-hour chart has more false signals. The ATR and MA filters help, but caution is needed.
Fees: Frequent trading increases costs, so ensure each trade’s potential justifies the expense.
Volatility: BONK can move unpredictably—monitor broader market trends or Solana ecosystem news.
Final Thoughts
Switching to a 1-hour timeframe makes the strategy more active, targeting shorter volatility spikes while keeping profits conservative at 3-7%. The adjusted indicators and conditions balance responsiveness with reliability. Backtest it on TradingView to confirm it suits BONK’s behavior, and always use proper risk management, as meme coins are highly speculative.
Disclaimer: This is for educational purposes, not financial advice. Cryptocurrency trading, especially with assets like BONK, is risky. Test thoroughly and trade responsibly.

Bull Flag (9:30-12:00 Only) [One-Liner Fix]🚀 Bull Flag Breakout Strategy | Intraday Momentum (9:30-12:00) 🔥📈
💡 Designed for Intraday Traders who love momentum breakouts and want to automate Bull Flag setups with volume confirmation! This strategy detects strong bullish moves, measures pullbacks, and triggers trades when the first candle makes a new high—ensuring maximum momentum.
⸻
🏆 Why This Strategy?
✅ Bull Flag Pattern Automation – No need to manually spot pullbacks! 🎯
✅ Smart Volume Confirmation – Only enter trades when breakout volume is strong! 📊
✅ Morning Session Focused (9:30 - 12:00 EST) – Trade when momentum is at its peak! ⏰
✅ Customizable ATR & Risk Settings – Adjust pullback %, stop-loss, and take-profit! 🛠️
✅ Backtest-Friendly – See how the strategy performs over time! 🔍
⸻
🎯 How It Works
📌 Step 1: Detects a Bullish Impulse Bar
🔹 Large green candle 🚀
🔹 Candle range > ATR multiplier
🔹 Volume > Average volume threshold
📌 Step 2: Confirms a Valid Pullback
🔸 Pullback must stay within % range of the impulse move 📉
🔸 If the pullback is too deep or takes too long, the setup is ignored ⛔
📌 Step 3: First Candle to Make a New High 📈
🔹 When a candle breaks the previous high and volume confirms, go long! 💰
🔹 Stop-Loss set at pullback low
🔹 Take-Profit at Risk:Reward (R:R) Target 🎯
⸻
🔥 Best For
💎 Scalpers & Day Traders – Capture short-term breakout momentum! ⚡
📊 Backtesters – Optimize ATR, volume, and pullback rules for best performance! 🧪
⏳ Morning Momentum Traders – Focus on 9:30-12:00 AM EST for higher probability setups!
⸻
🚨 Important Notes
🔹 This strategy is not financial advice! 📜
🔹 Always backtest & paper trade before using real money! 📉📈
🔹 Volatility varies – Customize settings based on your trading style! 🔧
🚀 Like this script? Give it a try & let us know how it works for you! 🔥👊
⸻

Pure Price Action StrategyTest Price Action Strategy from Lux Pure Price Action Indicator
How This Strategy Works:
Recognizing Trends & Reversals:
Break of Structure (BOS): A bullish signal indicating a trend continuation.
Market Structure Shift (MSS): A bearish signal indicating a potential reversal.
Analyzing Market Momentum:
It uses recent highs and lows to confirm whether the price is making higher highs (bullish) or lower lows (bearish).
Customizing Visualization Styles:
Buy signals (BUY Signal) are plotted as green upward arrows.
Sell signals (SELL Signal) are plotted as red downward arrows.
Stop-Loss (SL) & Take-Profit (TP): Configurable via percentage input.

TSI Long/Short for BTC 2HThe TSI Long/Short for BTC 2H strategy is an advanced trend-following system designed specifically for trading Bitcoin (BTC) on a 2-hour timeframe. It leverages the True Strength Index (TSI) to identify momentum shifts and executes both long and short trades in response to dynamic market conditions.
Unlike traditional moving average-based strategies, this script uses a double-smoothed momentum calculation, enhancing signal accuracy and reducing noise. It incorporates automated position sizing, customizable leverage, and real-time performance tracking, ensuring a structured and adaptable trading approach.
🔹 What Makes This Strategy Unique?
Unlike simple crossover strategies or generic trend-following approaches, this system utilizes a customized True Strength Index (TSI) methodology that dynamically adjusts to market conditions.
🔸 True Strength Index (TSI) Filtering – The script refines the TSI by applying double exponential smoothing, filtering out weak signals and capturing high-confidence momentum shifts.
🔸 Adaptive Entry & Exit Logic – Instead of fixed thresholds, it compares the TSI value against a dynamically determined high/low range from the past 100 bars to confirm trade signals.
🔸 Leverage & Risk Optimization – Position sizing is dynamically adjusted based on account equity and leverage settings, ensuring controlled risk exposure.
🔸 Performance Monitoring System – A built-in performance tracking table allows traders to evaluate monthly and yearly results directly on the chart.
📊 Core Strategy Components
1️⃣ Momentum-Based Trade Execution
The strategy generates long and short trade signals based on the following conditions:
✅ Long Entry Condition – A buy signal is triggered when the TSI crosses above its 100-bar highest value (previously set), confirming bullish momentum.
✅ Short Entry Condition – A sell signal is generated when the TSI crosses below its 100-bar lowest value (previously set), indicating bearish pressure.
Each trade execution is fully automated, reducing emotional decision-making and improving trading discipline.
2️⃣ Position Sizing & Leverage Control
Risk management is a key focus of this strategy:
🔹 Dynamic Position Sizing – The script calculates position size based on:
Account Equity – Ensuring trade sizes adjust dynamically with capital fluctuations.
Leverage Multiplier – Allows traders to customize risk exposure via an adjustable leverage setting.
🔹 No Fixed Stop-Loss – The strategy relies on reversals to exit trades, meaning each position is closed when the opposite signal appears.
This design ensures maximum capital efficiency while adapting to market conditions in real time.
3️⃣ Performance Visualization & Tracking
Understanding historical performance is crucial for refining strategies. The script includes:
📌 Real-Time Trade Markers – Buy and sell signals are visually displayed on the chart for easy reference.
📌 Performance Metrics Table – Tracks monthly and yearly returns in percentage form, helping traders assess profitability over time.
📌 Trade History Visualization – Completed trades are displayed with color-coded boxes (green for long trades, red for short trades), visually representing profit/loss dynamics.
📢 Why Use This Strategy?
✔ Advanced Momentum Detection – Uses a double-smoothed TSI for more accurate trend signals.
✔ Fully Automated Trading – Removes emotional bias and enforces discipline.
✔ Customizable Risk Management – Adjust leverage and position sizing to suit your risk profile.
✔ Comprehensive Performance Tracking – Integrated reporting system provides clear insights into past trades.
This strategy is ideal for Bitcoin traders looking for a structured, high-probability system that adapts to both bullish and bearish trends on the 2-hour timeframe.
📌 How to Use: Simply add the script to your 2H BTC chart, configure your leverage settings, and let the system handle trade execution and tracking! 🚀

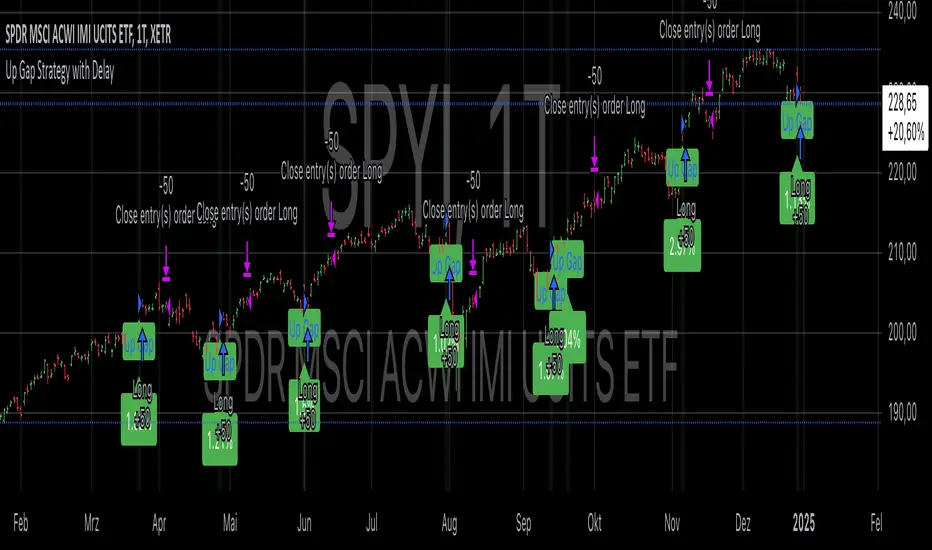
Up Gap Strategy with DelayThis strategy, titled “Up Gap Strategy with Delay,” is based on identifying up gaps in the price action of an asset. A gap is defined as the percentage difference between the current bar’s open price and the previous bar’s close price. The strategy triggers a long position if the gap exceeds a user-defined threshold and includes a delay period before entering the position. After entering, the position is held for a set number of periods before being closed.
Key Features:
1. Gap Threshold: The strategy defines an up gap when the gap size exceeds a specified threshold (in percentage terms). The gap threshold is an input parameter that allows customization based on the user’s preference.
2. Delay Period: After the gap occurs, the strategy waits for a delay period before initiating a long position. This delay can help mitigate any short-term volatility that might occur immediately after the gap.
3. Holding Period: Once the position is entered, it is held for a user-defined number of periods (holdingPeriods). This is to capture the potential post-gap trend continuation, as gaps often indicate strong directional momentum.
4. Gap Plotting: The strategy visually plots up gaps on the chart by placing a green label beneath the bar where the gap condition is met. Additionally, the background color turns green to highlight up-gap occurrences.
5. Exit Condition: The position is exited after the defined holding period. The strategy ensures that the position is closed after this time, regardless of whether the price is in profit or loss.
Scientific Background:
The gap theory has been widely studied in financial literature and is based on the premise that gaps in price often represent areas of significant support or resistance. According to research by Kaufman (2002), gaps in price action can be indicators of future price direction, particularly when they occur after a period of consolidation or a trend reversal. Moreover, Gaps and their Implications in Technical Analysis (Murphy, 1999) highlights that gaps can reflect imbalances between supply and demand, leading to high momentum and potential price continuation or reversal.
In trading strategies, utilizing gaps with specific conditions, such as delay and holding periods, can enhance the ability to capture significant price moves. The strategy’s delay period helps avoid potential market noise immediately after the gap, while the holding period seeks to capitalize on the price continuation that often follows gap formation.
This methodology aligns with momentum-based strategies, which rely on the persistence of trends in financial markets. Several studies, including Jegadeesh & Titman (1993), have documented the existence of momentum effects in stock prices, where past price movements can be predictive of future returns.
Conclusion:
This strategy incorporates gap detection and momentum principles, supported by empirical research in technical analysis, to attempt to capitalize on price movements following significant gaps. By waiting for a delay period and holding the position for a specified time, it aims to mitigate the risk associated with early volatility while maximizing the potential for sustained price moves.
DAILY Supertrend + EMA Crossover with RSI FilterThis strategy is a technical trading approach that combines multiple indicators—Supertrend, Exponential Moving Averages (EMAs), and the Relative Strength Index (RSI)—to identify and manage trades.
Core Components:
1. Exponential Moving Averages (EMAs):
Two EMAs, one with a shorter period (fast) and one with a longer period (slow), are calculated. The idea is to spot when the faster EMA crosses above or below the slower EMA. A fast EMA crossing above the slow EMA often suggests upward momentum, while crossing below suggests downward momentum.
2. Supertrend Indicator:
The Supertrend uses Average True Range (ATR) to establish dynamic support and resistance lines. These lines shift above or below price depending on the prevailing trend. When price is above the Supertrend line, the trend is considered bullish; when below, it’s considered bearish. This helps ensure that the strategy trades only in the direction of the overall trend rather than against it.
3. RSI Filter:
The RSI measures momentum. It helps avoid buying into markets that are already overbought or selling into markets that are oversold. For example, when going long (buying), the strategy only proceeds if the RSI is not too high, and when going short (selling), it only proceeds if the RSI is not too low. This filter is meant to improve the quality of the trades by reducing the chance of entering right before a reversal.
4. Time Filters:
The strategy only triggers entries during user-specified date and time ranges. This is useful if one wants to limit trading activity to certain trading sessions or periods with higher market liquidity.
5. Risk Management via ATR-based Stops and Targets:
Both stop loss and take profit levels are set as multiples of the ATR. ATR measures volatility, so when volatility is higher, both stops and profit targets adjust to give the trade more breathing room. Conversely, when volatility is low, stops and targets tighten. This dynamic approach helps maintain consistent risk management regardless of market conditions.
Overall Logic Flow:
- First, the market conditions are analyzed through EMAs, Supertrend, and RSI.
- When a buy (long) condition is met—meaning the fast EMA crosses above the slow EMA, the trend is bullish according to Supertrend, and RSI is below the specified “overbought” threshold—the strategy initiates or adds to a long position.
- Similarly, when a sell (short) condition is met—meaning the fast EMA crosses below the slow EMA, the trend is bearish, and RSI is above the specified “oversold” threshold—it initiates or adds to a short position.
- Each position is protected by an automatically calculated stop loss and a take profit level based on ATR multiples.
Intended Result:
By blending trend detection, momentum filtering, and volatility-adjusted risk management, the strategy aims to capture moves in the primary trend direction while avoiding entries at excessively stretched prices. Allowing multiple entries can potentially amplify gains in strong trends but also increases exposure, which traders should consider in their risk management approach.
In essence, this strategy tries to ride established trends as indicated by the Supertrend and EMAs, filter out poor-quality entries using RSI, and dynamically manage trade risk through ATR-based stops and targets.

Gold Scalping Strategy with Precise EntriesThe Gold Scalping Strategy with Precise Entries is designed to take advantage of short-term price movements in the gold market (XAU/USD). This strategy uses a combination of technical indicators and chart patterns to identify precise buy and sell opportunities during times of consolidation and trend continuation.
Key Elements of the Strategy:
Exponential Moving Averages (EMAs):
50 EMA: Used as the shorter-term moving average to detect the recent price trend.
200 EMA: Used as the longer-term moving average to determine the overall market trend.
Trend Identification:
A bullish trend is identified when the 50 EMA is above the 200 EMA.
A bearish trend is identified when the 50 EMA is below the 200 EMA.
Average True Range (ATR):
ATR (14) is used to calculate the market's volatility and to set a dynamic stop loss based on recent price movements. Higher ATR values indicate higher volatility.
ATR helps define a suitable stop-loss distance from the entry point.
Relative Strength Index (RSI):
RSI (14) is used as a momentum oscillator to detect overbought or oversold conditions.
However, in this strategy, the RSI is primarily used as a consolidation filter to look for neutral zones (between 45 and 55), which may indicate a potential breakout or trend continuation after a consolidation phase.
Engulfing Patterns:
Bullish Engulfing: A bullish signal is generated when the current candle fully engulfs the previous bearish candle, indicating potential upward momentum.
Bearish Engulfing: A bearish signal is generated when the current candle fully engulfs the previous bullish candle, signaling potential downward momentum.
Precise Entry Conditions:
Long (Buy):
The 50 EMA is above the 200 EMA (bullish trend).
The RSI is between 45 and 55 (neutral/consolidation zone).
A bullish engulfing pattern occurs.
The price closes above the 50 EMA.
Short (Sell):
The 50 EMA is below the 200 EMA (bearish trend).
The RSI is between 45 and 55 (neutral/consolidation zone).
A bearish engulfing pattern occurs.
The price closes below the 50 EMA.
Take Profit and Stop Loss:
Take Profit: A fixed 20-pip target (where 1 pip = 0.10 movement in gold) is used for each trade.
Stop Loss: The stop-loss is dynamically set based on the ATR, ensuring that it adapts to current market volatility.
Visual Signals:
Buy and sell signals are visually plotted on the chart using green and red labels, indicating precise points of entry.
Advantages of This Strategy:
Trend Alignment: The strategy ensures that trades are taken in the direction of the overall trend, as indicated by the 50 and 200 EMAs.
Volatility Adaptation: The use of ATR allows the stop loss to adapt to the current market conditions, reducing the risk of premature exits in volatile markets.
Precise Entries: The combination of engulfing patterns and the neutral RSI zone provides a high-probability entry signal that captures momentum after consolidation.
Quick Scalping: With a fixed 20-pip profit target, the strategy is designed to capture small price movements quickly, which is ideal for scalping.
This strategy can be applied to lower timeframes (such as 1-minute, 5-minute, or 15-minute charts) for frequent trade opportunities in gold trading, making it suitable for day traders or scalpers. However, proper risk management should always be used due to the inherent volatility of gold.

Monthly Breakout StrategyThis Monthly High/Low Breakout Strategy is designed to take long or short positions based on breakouts from the high or low of the previous month. Users can select whether they want to go long at a breakout above the previous month’s high, short at a breakdown below the previous month’s low, or use the reverse logic. Additionally, it includes a month filter, allowing trades to be executed only during user-specified months.
Breakout strategies, particularly those based on monthly highs and lows, aim to capitalize on price momentum. These systems rely on the assumption that once a significant price level is breached (such as the previous month's high or low), the market is likely to continue moving in the same direction due to increased volatility and trend-following behaviors by traders. Studies have demonstrated the potential effectiveness of breakout strategies in financial markets.
Scientific Evidence Supporting Breakout Strategies:
Momentum in Financial Markets:
Research on momentum-based strategies, which include breakout trading, shows that securities breaking key levels of support or resistance tend to continue their price movement in the direction of the breakout. Jegadeesh and Titman (1993) found that stocks with strong performance over a given period tend to continue performing well in subsequent periods, a principle also applied to breakout strategies.
Behavioral Finance:
The psychological factor of herd behavior is one of the driving forces behind breakout strategies. When prices break out of a key level (such as a monthly high), it triggers increased buying or selling pressure as traders join the trend. Barberis, Shleifer, and Vishny (1998) explained how cognitive biases, such as overconfidence and sentiment, can amplify price trends, which breakout strategies attempt to exploit.
Market Efficiency:
While markets are generally efficient, periods of inefficiency can occur, particularly around the breakouts of significant price levels. These inefficiencies often result in temporary price trends, which breakout strategies can exploit before the market corrects itself (Fama, 1970).
Risk Considerations:
Despite the potential for profit, the Monthly Breakout Strategy comes with several risks:
False Breakouts:
One of the most common risks in breakout strategies is the occurrence of false breakouts. These happen when the price temporarily moves above (or below) a key level but quickly reverses direction, causing losses for traders who entered positions too early. This is particularly risky in low-volatility environments.
Market Volatility:
Monthly breakout strategies rely on momentum, which may not be consistent across different market conditions. During periods of low volatility, price breakouts might lack the follow-through required for the strategy to succeed, leading to poor performance.
Whipsaw Risk:
The strategy is vulnerable to whipsaw markets, where prices oscillate around key levels without establishing a clear direction. This can result in frequent entry and exit signals that lead to losses, especially if trading costs are not managed properly.
Overfitting to Past Data:
If the month-selection filter is overly optimized based on historical data, the strategy may suffer from overfitting—performing well in backtests but poorly in real-time trading. This happens when strategies are tailored to past market conditions that may not repeat.
Conclusion:
While monthly breakout strategies can be effective in markets with strong momentum, they are subject to several risks, including false breakouts, volatility dependency, and whipsaw behavior. It is crucial to backtest this strategy thoroughly and ensure it aligns with your risk tolerance before implementing it in live trading.
References:
Jegadeesh, N., & Titman, S. (1993). Returns to Buying Winners and Selling Losers: Implications for Stock Market Efficiency. Journal of Finance, 48(1), 65-91.
Barberis, N., Shleifer, A., & Vishny, R. (1998). A Model of Investor Sentiment. Journal of Financial Economics, 49(3), 307-343.
Fama, E. F. (1970). Efficient Capital Markets: A Review of Theory and Empirical Work. Journal of Finance, 25(2), 383-417.
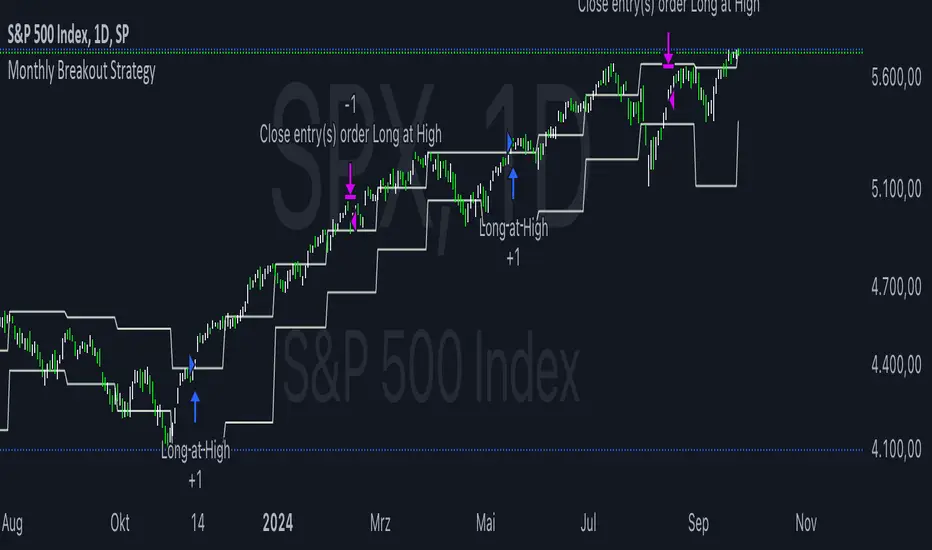
MACD with 1D Stochastic Confirmation Reversal StrategyOverview
The MACD with 1D Stochastic Confirmation Reversal Strategy utilizes MACD indicator in conjunction with 1 day timeframe Stochastic indicators to obtain the high probability short-term trend reversal signals. The main idea is to wait until MACD line crosses up it’s signal line, at the same time Stochastic indicator on 1D time frame shall show the uptrend (will be discussed in methodology) and not to be in the oversold territory. Strategy works on time frames from 30 min to 4 hours and opens only long trades.
Unique Features
Dynamic stop-loss system: Instead of fixed stop-loss level strategy utilizes average true range (ATR) multiplied by user given number subtracted from the position entry price as a dynamic stop loss level.
Configurable Trading Periods: Users can tailor the strategy to specific market windows, adapting to different market conditions.
Higher time frame confirmation: Strategy utilizes 1D Stochastic to establish the major trend and confirm the local reversals with the higher probability.
Trailing take profit level: After reaching the trailing profit activation level scrip activate the trailing of long trade using EMA. More information in methodology.
Methodology
The strategy opens long trade when the following price met the conditions:
MACD line of MACD indicator shall cross over the signal line of MACD indicator.
1D time frame Stochastic’s K line shall be above the D line.
1D time frame Stochastic’s K line value shall be below 80 (not overbought)
When long trade is executed, strategy set the stop-loss level at the price ATR multiplied by user-given value below the entry price. This level is recalculated on every next candle close, adjusting to the current market volatility.
At the same time strategy set up the trailing stop validation level. When the price crosses the level equals entry price plus ATR multiplied by user-given value script starts to trail the price with EMA. If price closes below EMA long trade is closed. When the trailing starts, script prints the label “Trailing Activated”.
Strategy settings
In the inputs window user can setup the following strategy settings:
ATR Stop Loss (by default = 3.25, value multiplied by ATR to be subtracted from position entry price to setup stop loss)
ATR Trailing Profit Activation Level (by default = 4.25, value multiplied by ATR to be added to position entry price to setup trailing profit activation level)
Trailing EMA Length (by default = 20, period for EMA, when price reached trailing profit activation level EMA will stop out of position if price closes below it)
User can choose the optimal parameters during backtesting on certain price chart, in our example we use default settings.
Justification of Methodology
This strategy leverages 2 time frames analysis to have the high probability reversal setups on lower time frame in the direction of the 1D time frame trend. That’s why it’s recommended to use this strategy on 30 min – 4 hours time frames.
To have an approximation of 1D time frame trend strategy utilizes classical Stochastic indicator. The Stochastic Indicator is a momentum oscillator that compares a security's closing price to its price range over a specific period. It's used to identify overbought and oversold conditions. The indicator ranges from 0 to 100, with readings above 80 indicating overbought conditions and readings below 20 indicating oversold conditions.
It consists of two lines:
%K: The main line, calculated using the formula (CurrentClose−LowestLow)/(HighestHigh−LowestLow)×100 . Highest and lowest price taken for 14 periods.
%D: A smoothed moving average of %K, often used as a signal line.
Strategy logic assumes that on 1D time frame it’s uptrend in %K line is above the %D line. Moreover, we can consider long trade only in %K line is below 80. It means that in overbought state the long trade will not be opened due to higher probability of pullback or even major trend reversal. If these conditions are met we are going to our working (lower) time frame.
On the chosen time frame, we remind you that for correct work of this strategy you shall use 30min – 4h time frames, MACD line shall cross over it’s signal line. The MACD (Moving Average Convergence Divergence) is a popular momentum and trend-following indicator used in technical analysis. It helps traders identify changes in the strength, direction, momentum, and duration of a trend in a stock's price.
The MACD consists of three components:
MACD Line: This is the difference between a short-term Exponential Moving Average (EMA) and a long-term EMA, typically calculated as: MACD Line=12-period EMA−26-period
Signal Line: This is a 9-period EMA of the MACD Line, which helps to identify buy or sell signals. When the MACD Line crosses above the Signal Line, it can be a bullish signal (suggesting a buy); when it crosses below, it can be a bearish signal (suggesting a sell).
Histogram: The histogram shows the difference between the MACD Line and the Signal Line, visually representing the momentum of the trend. Positive histogram values indicate increasing bullish momentum, while negative values indicate increasing bearish momentum.
In our script we are interested in only MACD and signal lines. When MACD line crosses signal line there is a high chance that short-term trend reversed to the upside. We use this strategy on 45 min time frame.
ATR is used to adjust the strategy risk management to the current market volatility. If volatility is low, we don’t need the large stop loss to understand the there is a high probability that we made a mistake opening the trade. User can setup the settings ATR Stop Loss and ATR Trailing Profit Activation Level to realize his own risk to reward preferences, but the unique feature of a strategy is that after reaching trailing profit activation level strategy is trying to follow the trend until it is likely to be finished instead of using fixed risk management settings. It allows sometimes to be involved in the large movements.
Backtest Results
Operating window: Date range of backtests is 2023.01.01 - 2024.08.01. It is chosen to let the strategy to close all opened positions.
Commission and Slippage: Includes a standard Binance commission of 0.1% and accounts for possible slippage over 5 ticks.
Initial capital: 10000 USDT
Percent of capital used in every trade: 30%
Maximum Single Position Loss: -4.79%
Maximum Single Profit: +20.14%
Net Profit: +2361.33 USDT (+44.72%)
Total Trades: 123 (44.72% win rate)
Profit Factor: 1.623
Maximum Accumulated Loss: 695.80 USDT (-5.48%)
Average Profit per Trade: 19.20 USDT (+0.59%)
Average Trade Duration: 30 hours
These results are obtained with realistic parameters representing trading conditions observed at major exchanges such as Binance and with realistic trading portfolio usage parameters.
How to Use
Add the script to favorites for easy access.
Apply to the desired timeframe between 30 min and 4 hours and chart (optimal performance observed on 45 min BTC/USDT).
Configure settings using the dropdown choice list in the built-in menu.
Set up alerts to automate strategy positions through web hook with the text: {{strategy.order.alert_message}}
Disclaimer:
Educational and informational tool reflecting Skyrex commitment to informed trading. Past performance does not guarantee future results. Test strategies in a simulated environment before live implementation

Dual RSI Differential - Strategy [presentTrading]█ Introduction and How it is Different
The Dual RSI Differential Strategy introduces a nuanced approach to market analysis and trading decisions by utilizing two Relative Strength Index (RSI) indicators calculated over different time periods. Unlike traditional strategies that employ a single RSI and may signal premature or delayed entries, this method leverages the differential between a shorter and a longer RSI. This approach pinpoints more precise entry and exit points, providing a refined tool for traders to exploit market conditions effectively, particularly in overbought and oversold scenarios.
Most important: it is a good eductional code for swing trading.
For beginners, this Pine Script provides a complete function that includes crucial elements such as holding days and the option to configure take profit/stop loss settings:
- Hold Days: This feature ensures that trades are not exited too hastily, helping traders to ride out short-term market volatility. It's particularly valuable for swing trading where maintaining positions slightly longer can lead to capturing significant trends.
- TPSL Condition (None by default): This setting allows traders to focus solely on the strategy's robust entry and exit signals without being constrained by preset profit or loss limits. This flexibility is crucial for learning to adjust strategy settings based on personal risk tolerance and market observations.
BTCUSD 6h LS Performance
█ Strategy, How It Works: Detailed Explanation
🔶 RSI Calculation:
The RSI is a momentum oscillator that measures the speed and change of price movements. It is calculated using the formula:
RSI = 100 - (100 / (1 + RS))
Where RS (Relative Strength) = Average Gain of up periods / Average Loss of down periods.
🔶 Dual RSI Setup:
This strategy involves two RSI indicators:
RSI_Short (RSI_21): Calculated over a short period (21 days).
RSI_Long (RSI_42): Calculated over a longer period (42 days).
Differential Calculation:
The strategy focuses on the differential between these two RSIs:
RSI Differential = RSI_Long - RSI_Short
This differential helps to identify when the shorter-term sentiment diverges from longer-term trends, signaling potential trading opportunities.
BTCUSD Local picuture
🔶 Signal Triggers:
Entry Signal: A buy (long) signal is triggered when the RSI Differential exceeds -5, suggesting strengthening short-term momentum. Conversely, a sell (short) signal occurs when the RSI Differential falls below +5, indicating weakening short-term momentum.
Exit Signal: Trades are generally exited when the RSI Differential reverses past these thresholds, indicating a potential momentum shift.
█ Trade Direction
This strategy accommodates various trading preferences by allowing selections among long, short, or both directions, thus enabling traders to capitalize on diverse market movements and volatility.
█ Usage
The Dual RSI Differential Strategy is particularly suited for:
Traders who prefer a systematic approach to capture market trends.
Those who seek to minimize risks associated with rapid and unexpected market movements.
Traders who value strategies that can be finely tuned to different market conditions.
█ Default Settings
- Trading Direction: Both — allows capturing of upward and downward market movements.
- Short RSI Period: 21 days — balances sensitivity to market movements.
- Long RSI Period: 42 days — smoothens out longer-term fluctuations to provide a clearer market trend.
- RSI Difference Level: 5 — minimizes false signals by setting a moderate threshold for action.
Use Hold Days: True — introduces a temporal element to trading strategy, holding positions to potentially enhance outcomes.
- Hold Days: 5 — ensures that trades are not exited too hastily, helping to ride out short-term volatility.
- TPSL Condition: None — enables traders to focus solely on the strategy's entry and exit signals without preset profit or loss limits.
- Take Profit Percentage: 15% — aims for significant market moves to lock in profits.
- Stop Loss Percentage: 10% — safeguards against large losses, essential for long-term capital preservation.
