nOI + Funding + CVD • strategynOI + Funding + CVD Strategy
Overview
This strategy is designed for cryptocurrency trading on platforms like TradingView, focusing on perpetual futures markets. It combines three key indicators—Normalized Open Interest (nOI), Funding Rate, and Cumulative Volume Delta (CVD)—to generate buy and sell signals for long and short positions. The strategy aims to capitalize on market imbalances, such as overextended open interest, funding rate extremes, and volume deltas, which often signal potential reversals or continuations in trending markets.
The script supports pyramiding (up to 10 positions), uses percentage-based position sizing (default 10% of equity per trade), and allows customization of trade directions (longs and shorts can be enabled/disabled independently). It includes multiple signal systems for entries, various exit mechanisms (including stop-loss, take-profit, time-based exits, and conditional closes based on indicators), a Martingale add-on system for averaging positions during drawdowns, and handling of opposite signals (ignore, close, or reverse).
This strategy is not financial advice; backtest thoroughly and use at your own risk. It requires data sources for Open Interest (OI) and Funding Rates, which are fetched via TradingView's security functions (e.g., from Binance for funding premiums).
Key Indicators
1. Normalized Open Interest (nOI)
Group: Open Interest
Purpose: Measures the relative level of open interest over a lookback window to identify overbought (high OI) or oversold (low OI) conditions, which can indicate potential exhaustion in trends.
Calculation:
Fetches OI data (close) from the symbol's standard ticker (e.g., "{symbol}_OI").
Normalizes OI within a user-defined window (default: 500 bars) using min-max scaling: (OI - min_OI) / (max_OI - min_OI) * 100.
Upper threshold (default: 70%): Signals potential short opportunities when crossed from above.
Lower threshold (default: 30%): Signals potential long opportunities when crossed from below.
Visualization: Plotted as a line (teal above upper, red below lower, gray in between). Horizontal lines at upper, mid (50%), lower, and a separator at 102%.
Notes: Handles non-crypto symbols by adjusting timeframe to daily if intraday. Errors if no OI data available.
2. Funding Rate
Group: Funding Rate
Purpose: Tracks the average funding rate (premium index) to detect market sentiment extremes. Positive funding suggests bull bias (longs pay shorts), negative suggests bear bias.
Calculation:
Fetches premium index data from Binance (e.g., "binance:{base}usdt_premium").
Supports lower timeframe aggregation (default: enabled, using 1-min TF) for smoother data.
Averages open and close premiums, clamps values, and scales/shifts for plotting (base: 150, scale: 1000x).
Upper threshold (default: 1.0%): Overheat for shorts.
Lower threshold (default: 1.0%): Overcool for longs.
Ultra level (default: 1.8%): Extreme for additional short signals.
Smoothing: Uses inverse weighted moving average (IWMA) or lower-TF aggregation to reduce noise.
Visualization: Shifted plot (green positive, red negative) with filled areas. Horizontal lines for overheat, overcool, base (0%), and ultra.
Notes: Custom ticker option for non-standard symbols.
3. Cumulative Volume Delta (CVD)
Group: CVD (Cumulative Volume Delta)
Purpose: Measures net buying/selling pressure via volume delta, normalized to identify divergences or confirmations with price.
Calculation:
Delta: +volume if close > open, -volume if close < open.
Cumulative: Rolling cumsum over a window (default: 500 bars), smoothed with EMA (default: 20).
Normalized: Scaled by absolute max in window (-1 to 1 range).
Scaled/shifted for plotting (base: 300 or 0 if anchored, scale: 120x).
Upper threshold (default: 1.0%): Over for shorts.
Lower threshold (default: 1.0%): Under for longs.
Visualization: Shifted plot (aqua positive, purple negative) with filled areas. Horizontal lines for over, under, and separator (default: 252).
Filter Options (for Signal A):
Enable filter (default: false).
Require sign match (Long ≥0, Short ≤0).
Require extreme zones.
Require momentum (rising/falling over N bars, default: 3).
Signal Logics for Entries
Entries are triggered by buy/sell signals from multiple systems (A, B, C, D), filtered by direction toggles and entry conditions.
Signal System A: OI + Funding (with optional CVD filter)
Enabled: Default true.
Sell (Short): nOI > upper threshold, falling over N bars (default: 3), delta ≥ threshold (default: 3%), funding > overheat, and CVD filter OK.
Buy (Long): nOI < lower threshold, rising over N bars (default: 3), delta ≥ threshold (default: 3%), funding < overcool, and CVD filter OK.
Signal System B: Short - Funding Crossunder + Filters
Enabled: Default true.
Sell (Short): Funding crosses under overheat level, optional: CVD > over, nOI < upper.
Signal System C: Short - Ultra Funding
Enabled: Default false.
Sell (Short): Funding crosses ultra level (up or down, both default true).
Signal System D: Long - Funding Crossover + Filters
Enabled: Default true.
Buy (Long): Funding crosses over overcool level, optional: CVD < under, nOI > lower.
Combined: Sell if A/B/C active; Buy if A/D active.
Entry Filters
Cooldown: Optional pause between entries (default: false, 3 bars).
Max Entries: Limit pyramiding (default: true, 6 max).
Entries only if both filters pass and direction allowed.
Opposite Signal Handling
Mode: Ignore (default), Reverse (close and enter opposite), or Close (exit only).
Processed before regular entries.
Position Management
Martingale (3 Steps):
Enabled per step (default: all true).
Triggers add-ons at loss levels (defaults: 5%, 8%, 11%) by adding % to position (default: 100% each).
Resets on position close.
Break Even:
Enabled (default: true).
Activates at profit threshold (default: 5%), sets SL better by offset (default: 0.1%).
Exit Systems
Multiple exits checked in sequence.
Exit 1: SL/TP
Enabled: Separate for long/short (default: true).
SL: % from avg price (defaults: 1% long/short).
TP: % from avg price (defaults: 2% long/short).
Exit 2: Funding
Enabled: Separate for long (up) / short (down) (default: true).
Long Exit: Funding > upper exit threshold (default: 0.8%).
Short Exit: Funding < lower exit threshold (default: 0.8%).
Exit 3: nOI
Enabled: Separate for long (up) / short (down) (default: true).
Long Exit: nOI > upper exit (default: 85%).
Short Exit: nOI < lower exit (default: 15%).
Exit 4: Global SL
Enabled: Default true.
Exit: If position loss ≥ % (default: 7%).
Exit 5: Break Even (integrated in position block)
Exit 6: Time Limit
Enabled: Separate for long/short (default: true).
Exit: After N bars in trade (defaults: 30 each).
Timer updates on add-ons if enabled (default: true).
Visual Elements
Buy/Sell Labels: Small labels ("BUY"/"SELL") on bars with signals, limited to last 30.
All indicators plotted on a separate pane (overlay=false).
Usage Notes
Backtesting: Adjust parameters based on asset/timeframe. Test on historical data.
Data Requirements: Works best on crypto perps with OI and funding data.
Risk Management: Incorporates SL/TP and global SL; monitor drawdowns with Martingale.
Customization: All thresholds, enables, and scales are inputs for fine-tuning.
Version: Pine Script v6.
For questions or improvements, contact the author. Happy trading!
Buscar en scripts para "momentum"

NY ORB - Full Dynamic SystemNY ORB - Full Dynamic Strategy Summary
1. Opening Range and Session Timing
Opening Range (ORB) Calculation: The strategy identifies the ORB High and ORB Low by tracking the highest high and lowest low during the specified New York pre-market window, which is set by default from 8:30 to 8:45 (New York time).
Entry Window: Trading activity is restricted to a specific entry period, typically starting shortly after the ORB is established (default: 8:50 to 12:00).
Hard Exit Time: Any remaining open positions are automatically closed at a fixed exit time (default: 13:25).
2. Trade Entry Logic and Filters
An entry (Long or Short) is generated when the price breaks out of the established ORB, provided it passes a series of optional filters:
Direction Control: The user can restrict the strategy to trade Long Only, Short Only, or Both.
Second Breakout Logic: An optional filter that requires the price to break out, reverse back into the range, and then break out again, confirming momentum after a consolidation.
Confirmation Candle Count: An optional filter that checks the close of a previous candle (e.g., 1 or 2 candles ago) to ensure the price was still inside the range, preventing premature entry.
Technical Filters (Optional): The entry is only executed if it aligns with selected indicators:
RSI: Filters for non-overbought (Long) or non-oversold (Short) conditions.
MACD: Requires the MACD line to be above/below the Signal line for alignment.
VWAP: Requires the price to be above/below the Volume-Weighted Average Price.
Trend Filter (SMMA): Requires the price to be above/below a 50-period Simple Moving Average.
3. Dynamic Risk and Exit Management
This strategy features highly configurable stop-loss and profit-taking mechanics:
Primary Stop Loss Methods: The Stop Loss distance can be dynamically chosen from four types:
Fixed: A fixed number of ticks.
ATR: Based on a multiple of the Average True Range (ATR).
Capped ATR: ATR-based, but with a hard maximum tick limit.
OR-Based: Based on a multiple of the actual ORB High-to-Low range.
Dynamic Profit Target: The Take Profit level is calculated dynamically based on a multiplier of either the ATR or the ORB Range.
Breakeven Stop:
If enabled, the Stop Loss automatically moves to the entry price (Breakeven) once the price moves a predetermined distance in the profitable direction.
An Adaptive Breakeven option allows the trigger distance to be calculated as a percentage of the overall ATR Profit Target.
Trailing Stop: The strategy uses a trailing stop, which can be custom-set (fixed ticks) or dynamically tied to the ATR. An optional feature Auto Tighten Trailing reduces the trailing multiplier once the breakeven level is hit.
MA Cross Exit: An alternative, counter-trend exit mechanism that closes the trade if the price crosses back over the chosen Moving Average (either SMMA or VWAP), overriding the pending profit target.
4. Daily Account Management
The strategy includes crucial daily risk controls to protect capital and lock in profits:
Daily Profit Limit: If the total daily PnL (realized and unrealized) hits a predefined maximum profit threshold (in ticks), all trades are closed, and new entries are blocked for the remainder of the trading day.
Daily Loss Limit: Conversely, if the total daily PnL hits a predefined maximum loss threshold, all trades are closed, and new entries are blocked for the remainder of the day.

Enhanced MA Crossover Pro📝 Strategy Summary: Enhanced MA Crossover Pro
This strategy is an advanced, highly configurable moving average (MA) crossover system designed for algorithmic trading. It uses the crossover of two customizable MAs (a "Fast" MA 1 and a "Slow" MA 2) as its core entry signal, but aggressively integrates multiple technical filters, time controls, and dynamic position management to create a robust and comprehensive trading system.
💡 Core Logic
Entry Signal: A bullish crossover (MA1 > MA2) generates a Long signal, and a bearish crossover (MA1 < MA2) generates a Short signal. Users can opt to use MA crossovers from a Higher Timeframe (HTF) for the entry signal.
Confirmation/Filters: The basic MA cross signal is filtered by several optional indicators (see Filters section below) to ensure trades align with a broader trend or momentum context.
Position Management: Trades are managed with a sophisticated system of Stop Loss, Take Profit, Trailing Stops, and Breakeven stops that can be fixed, ATR-based, or dynamically adjusted.
Risk Management: Daily limits are enforced for maximum profit/loss and maximum trades per day.
⚙️ Key Features and Customization
1. Moving Averages
Primary MAs (MA1 & MA2): Highly configurable lengths (default 8 & 20) and types: EMA, WMA, SMA, or SMMA/RMA.
Higher Timeframe (HTF) MAs: Optional MAs calculated on a user-defined resolution (e.g., "60" for 1-hour) for use as an entry signal or as a trend confirmation filter.
2. Multi-Filter System
The entry signal can be filtered by the following optional conditions:
SMA Filter: Price must be above a 200-period SMA for long trades, and below it for short trades.
VWAP Filter: Price must be above VWAP for long trades, and below it for short trades.
RSI Filter: Long trades are blocked if RSI is overbought (default 70); short trades are blocked if RSI is oversold (default 30).
MACD Filter: Requires the MACD Line to be above the Signal Line for long trades (and vice versa for short trades).
HTF Confirmation: Requires the HTF MA1 to be above HTF MA2 for long entries (and vice versa).
3. Dynamic Stop and Target Management (S/L & T/P)
The strategy provides extensive control over exits:
Stop Loss Methods:
Fixed: Fixed tick amount.
ATR: Based on a multiple of the Average True Range (ATR).
Capped ATR: ATR stop limited by a maximum fixed tick amount.
Exit on Close Cross MA: Position is closed if the price crosses back over the chosen MA (MA1 or MA2).
Breakeven Stop: A stop can be moved to the entry price once a trigger distance (fixed ticks or Adaptive Breakeven based on ATR%) is reached.
Trailing Stop: Can be fixed or ATR-based, with an optional feature to auto-tighten the trailing multiplier after the breakeven condition is met.
Profit Target: Can be a fixed tick amount or a dynamic target based on an ATR multiplier.
4. Time and Session Control
Trading Session: Trades are only taken between defined Start/End Hours and Minutes (e.g., 9:30 to 16:00).
Forced Close: All open positions are closed near the end of the session (e.g., 15:45).
Trading Days: Allows specific days of the week to be enabled or disabled for trading.
5. Risk and Position Limits
Daily Profit/Loss Limits: The strategy tracks daily realized and unrealized PnL in ticks and will close all positions and block new entries if the user-defined maximum profit or maximum loss is hit.
Max Trades Per Day: Limits the number of executed trades in a single day.
🎨 Outputs and Alerts
Plots: Plots the MA1, MA2, SMA, VWAP, and HTF MAs (if enabled) on the chart.
Shapes: Plots visual markers (BUY/SELL labels) on the bar where the MA crossover occurs.
Trailing Stop: Plots the dynamic trailing stop level when a position is open.
Alerts: Generates JSON-formatted alerts for entry ({"action":"buy", "price":...}) and exit ({"action":"exit", "position":"long", "price":...}).

INDIAN INTRADAY BEASTThe Indian Intraday Beast is a precision-built intraday strategy optimized for the 15-minute timeframe.
It captures high-probability momentum shifts and trend reversals using adaptive price-action logic and proprietary confirmation filters.
Designed for traders who demand clarity, speed, and consistency in India’s fast-paced markets.

Vandan V2Vandan V2 is an automated trend-following strategy for NASDAQ E-mini Futures (NQ1!).
It uses multi-timeframe momentum and volatility filters to identify high-probability entries.
Includes dynamic risk management and trailing logic optimized for intraday trading.

Gold H1 Breakout Failure (V11.0)This strategy is designed for trading XAU/USD (Gold) on the 1-hour timeframe. It identifies and trades fake breakouts of the Asian session range.
The logic is simple yet effective:
The script first marks the Asian session high and low.
Once price breaks out of this range and closes outside, it waits for confirmation by watching for price to close back inside the range.
When this re-entry occurs, the strategy takes a position in the opposite direction of the initial breakout, anticipating a false breakout or liquidity trap setup.
By focusing on these fakeouts, the strategy aims to capture reversal momentum after liquidity sweeps, making it especially effective during sessions when volatility transitions from Asia to London or New York.

FluxVector Liquidity Universal Trendline FluxVector Liquidity Trendline FFTL
Summary in one paragraph
FFTL is a single adaptive trendline for stocks ETFs FX crypto and indices on one minute to daily. It fires only when price action pressure and volatility curvature align. It is original because it fuses a directional liquidity pulse from candle geometry and normalized volume with realized volatility curvature and an impact efficiency term to modulate a Kalman like state without ATR VWAP or moving averages. Add it to a clean chart and use the colored line plus alerts. Shapes can move while a bar is open and settle on close. For conservative alerts select on bar close.
Scope and intent
• Markets. Major FX pairs index futures large cap equities liquid crypto top ETFs
• Timeframes. One minute to daily
• Default demo used in the publication. SPY on 30min
• Purpose. Reduce false flips and chop by gating the line reaction to noise and by using a one bar projection
• Limits. This is a strategy. Orders are simulated on standard candles only
Originality and usefulness
• Unique fusion. Directional Liquidity Pulse plus Volatility Curvature plus Impact Efficiency drives an adaptive gain for a one dimensional state
• Failure mode addressed. One or two shock candles that break ordinary trendlines and saw chop in flat regimes
• Testability. All windows and gains are inputs
• Portable yardstick. Returns use natural log units and range is bar high minus low
• Protected scripts. Not used. Method disclosed plainly here
Method overview in plain language
Base measures
• Return basis. Natural log of close over prior close. Average absolute return over a window is a unit of motion
Components
• Directional Liquidity Pulse DLP. Measures signed participation from body and wick imbalance scaled by normalized volume and variance stabilized
• Volatility Curvature. Second difference of realized volatility from returns highlights expansion or compression
• Impact Efficiency. Price change per unit range and volume boosts gain during efficient moves
• Energy score. Z scores of the above form a single energy that controls the state gain
• One bar projection. Current slope extended by one bar for anticipatory checks
Fusion rule
Weighted sum inside the energy score then logistic mapping to a gain between k min and k max. The state updates toward price plus a small flow push.
Signal rule
• Long suggestion and order when close is below trend and the one bar projection is above the trend
• Short suggestion and flip when close is above trend and the one bar projection is below the trend
• WAIT is implicit when neither condition holds
• In position states end on the opposite condition
What you will see on the chart
• Colored trendline teal for rising red for falling gray for flat
• Optional projection line one bar ahead
• Optional background can be enabled in code
• Alerts on price cross and on slope flips
Inputs with guidance
Setup
• Price source. Close by default
Logic
• Flow window. Typical range 20 to 80. Higher smooths the pulse and reduces flips
• Vol window. Typical range 30 to 120. Higher calms curvature
• Energy window. Typical range 20 to 80. Higher slows regime changes
• Min gain and Max gain. Raise max to react faster. Raise min to keep momentum in chop
UI
• Show 1 bar projection. Colors for up down flat
Properties visible in this publication
• Initial capital 25000
• Base currency USD
• Commission percent 0.03
• Slippage 5
• Default order size method percent of equity value 3%
• Pyramiding 0
• Process orders on close off
• Calc on every tick off
• Recalculate after order is filled off
Realism and responsible publication
• No performance claims
• Intrabar reminder. Shapes can move while a bar forms and settle on close
• Strategy uses standard candles only
Honest limitations and failure modes
• Sudden gaps and thin liquidity can still produce fast flips
• Very quiet regimes reduce contrast. Use larger windows and lower max gain
• Session time uses the exchange time of the chart if you enable any windows later
• Past results never guarantee future outcomes
Open source reuse and credits
• None

Quantum Flux Universal Strategy Summary in one paragraph
Quantum Flux Universal is a regime switching strategy for stocks, ETFs, index futures, major FX pairs, and liquid crypto on intraday and swing timeframes. It helps you act only when the normalized core signal and its guide agree on direction. It is original because the engine fuses three adaptive drivers into the smoothing gains itself. Directional intensity is measured with binary entropy, path efficiency shapes trend quality, and a volatility squash preserves contrast. Add it to a clean chart, watch the polarity lane and background, and trade from positive or negative alignment. For conservative workflows use on bar close in the alert settings when you add alerts in a later version.
Scope and intent
• Markets. Large cap equities and ETFs. Index futures. Major FX pairs. Liquid crypto
• Timeframes. One minute to daily
• Default demo used in the publication. QQQ on one hour
• Purpose. Provide a robust and portable way to detect when momentum and confirmation align, while dampening chop and preserving turns
• Limits. This is a strategy. Orders are simulated on standard candles only
Originality and usefulness
• Unique concept or fusion. The novelty sits in the gain map. Instead of gating separate indicators, the model mixes three drivers into the adaptive gains that power two one pole filters. Directional entropy measures how one sided recent movement has been. Kaufman style path efficiency scores how direct the path has been. A volatility squash stabilizes step size. The drivers are blended into the gains with visible inputs for strength, windows, and clamps.
• What failure mode it addresses. False starts in chop and whipsaw after fast spikes. Efficiency and the squash reduce over reaction in noise.
• Testability. Every component has an input. You can lengthen or shorten each window and change the normalization mode. The polarity plot and background provide a direct readout of state.
• Portable yardstick. The core is normalized with three options. Z score, percent rank mapped to a symmetric range, and MAD based Z score. Clamp bounds define the effective unit so context transfers across symbols.
Method overview in plain language
The strategy computes two smoothed tracks from the chart price source. The fast track and the slow track use gains that are not fixed. Each gain is modulated by three drivers. A driver for directional intensity, a driver for path efficiency, and a driver for volatility. The difference between the fast and the slow tracks forms the raw flux. A small phase assist reduces lag by subtracting a portion of the delayed value. The flux is then normalized. A guide line is an EMA of a small lead on the flux. When the flux and its guide are both above zero, the polarity is positive. When both are below zero, the polarity is negative. Polarity changes create the trade direction.
Base measures
• Return basis. The step is the change in the chosen price source. Its absolute value feeds the volatility estimate. Mean absolute step over the window gives a stable scale.
• Efficiency basis. The ratio of net move to the sum of absolute step over the window gives a value between zero and one. High values mean trend quality. Low values mean chop.
• Intensity basis. The fraction of up moves over the window plugs into binary entropy. Intensity is one minus entropy, which maps to zero in uncertainty and one in very one sided moves.
Components
• Directional Intensity. Measures how one sided recent bars have been. Smoothed with RMA. More intensity increases the gain and makes the fast and slow tracks react sooner.
• Path Efficiency. Measures the straightness of the price path. A gamma input shapes the curve so you can make trend quality count more or less. Higher efficiency lifts the gain in clean trends.
• Volatility Squash. Normalizes the absolute step with Z score then pushes it through an arctangent squash. This caps the effect of spikes so they do not dominate the response.
• Normalizer. Three modes. Z score for familiar units, percent rank for a robust monotone map to a symmetric range, and MAD based Z for outlier resistance.
• Guide Line. EMA of the flux with a small lead term that counteracts lag without heavy overshoot.
Fusion rule
• Weighted sum of the three drivers with fixed weights visible in the code comments. Intensity has fifty percent weight. Efficiency thirty percent. Volatility twenty percent.
• The blend power input scales the driver mix. Zero means fixed spans. One means full driver control.
• Minimum and maximum gain clamps bound the adaptive gain. This protects stability in quiet or violent regimes.
Signal rule
• Long suggestion appears when flux and guide are both above zero. That sets polarity to plus one.
• Short suggestion appears when flux and guide are both below zero. That sets polarity to minus one.
• When polarity flips from plus to minus, the strategy closes any long and enters a short.
• When flux crosses above the guide, the strategy closes any short.
What you will see on the chart
• White polarity plot around the zero line
• A dotted reference line at zero named Zen
• Green background tint for positive polarity and red background tint for negative polarity
• Strategy long and short markers placed by the TradingView engine at entry and at close conditions
• No table in this version to keep the visual clean and portable
Inputs with guidance
Setup
• Price source. Default ohlc4. Stable for noisy symbols.
• Fast span. Typical range 6 to 24. Raising it slows the fast track and can reduce churn. Lowering it makes entries more reactive.
• Slow span. Typical range 20 to 60. Raising it lengthens the baseline horizon. Lowering it brings the slow track closer to price.
Logic
• Guide span. Typical range 4 to 12. A small guide smooths without eating turns.
• Blend power. Typical range 0.25 to 0.85. Raising it lets the drivers modulate gains more. Lowering it pushes behavior toward fixed EMA style smoothing.
• Vol window. Typical range 20 to 80. Larger values calm the volatility driver. Smaller values adapt faster in intraday work.
• Efficiency window. Typical range 10 to 60. Larger values focus on smoother trends. Smaller values react faster but accept more noise.
• Efficiency gamma. Typical range 0.8 to 2.0. Above one increases contrast between clean trends and chop. Below one flattens the curve.
• Min alpha multiplier. Typical range 0.30 to 0.80. Lower values increase smoothing when the mix is weak.
• Max alpha multiplier. Typical range 1.2 to 3.0. Higher values shorten smoothing when the mix is strong.
• Normalization window. Typical range 100 to 300. Larger values reduce drift in the baseline.
• Normalization mode. Z score, percent rank, or MAD Z. Use MAD Z for outlier heavy symbols.
• Clamp level. Typical range 2.0 to 4.0. Lower clamps reduce the influence of extreme runs.
Filters
• Efficiency filter is implicit in the gain map. Raising efficiency gamma and the efficiency window increases the preference for clean trends.
• Micro versus macro relation is handled by the fast and slow spans. Increase separation for swing, reduce for scalping.
• Location filter is not included in v1.0. If you need distance gates from a reference such as VWAP or a moving mean, add them before publication of a new version.
Alerts
• This version does not include alertcondition lines to keep the core minimal. If you prefer alerts, add names Long Polarity Up, Short Polarity Down, Exit Short on Flux Cross Up in a later version and select on bar close for conservative workflows.
Strategy has been currently adapted for the QQQ asset with 30/60min timeframe.
For other assets may require new optimization
Properties visible in this publication
• Initial capital 25000
• Base currency Default
• Default order size method percent of equity with value 5
• Pyramiding 1
• Commission 0.05 percent
• Slippage 10 ticks
• Process orders on close ON
• Bar magnifier ON
• Recalculate after order is filled OFF
• Calc on every tick OFF
Honest limitations and failure modes
• Past results do not guarantee future outcomes
• Economic releases, circuit breakers, and thin books can break the assumptions behind intensity and efficiency
• Gap heavy symbols may benefit from the MAD Z normalization
• Very quiet regimes can reduce signal contrast. Use longer windows or higher guide span to stabilize context
• Session time is the exchange time of the chart
• If both stop and target can be hit in one bar, tie handling would matter. This strategy has no fixed stops or targets. It uses polarity flips for exits. If you add stops later, declare the preference
Open source reuse and credits
• None beyond public domain building blocks and Pine built ins such as EMA, SMA, standard deviation, RMA, and percent rank
• Method and fusion are original in construction and disclosure
Legal
Education and research only. Not investment advice. You are responsible for your decisions. Test on historical data and in simulation before any live use. Use realistic costs.
Strategy add on block
Strategy notice
Orders are simulated by the TradingView engine on standard candles. No request.security() calls are used.
Entries and exits
• Entry logic. Enter long when both the normalized flux and its guide line are above zero. Enter short when both are below zero
• Exit logic. When polarity flips from plus to minus, close any long and open a short. When the flux crosses above the guide line, close any short
• Risk model. No initial stop or target in v1.0. The model is a regime flipper. You can add a stop or trail in later versions if needed
• Tie handling. Not applicable in this version because there are no fixed stops or targets
Position sizing
• Percent of equity in the Properties panel. Five percent is the default for examples. Risk per trade should not exceed five to ten percent of equity. One to two percent is a common choice
Properties used on the published chart
• Initial capital 25000
• Base currency Default
• Default order size percent of equity with value 5
• Pyramiding 1
• Commission 0.05 percent
• Slippage 10 ticks
• Process orders on close ON
• Bar magnifier ON
• Recalculate after order is filled OFF
• Calc on every tick OFF
Dataset and sample size
• Test window Jan 2, 2014 to Oct 16, 2025 on QQQ one hour
• Trade count in sample 324 on the example chart
Release notes template for future updates
Version 1.1.
• Add alertcondition lines for long, short, and exit short
• Add optional table with component readouts
• Add optional stop model with a distance unit expressed as ATR or a percent of price
Notes. Backward compatibility Yes. Inputs migrated Yes.

Turtle Strategy - Triple EMA Trend with ADX and ATRDescription
The Triple EMA Trend strategy is a directional momentum system built on the alignment of three exponential moving averages and a strong ADX confirmation filter. It is designed to capture established trends while maintaining disciplined risk management through ATR-based stops and targets.
Core Logic
The system activates only under high-trend conditions, defined by the Average Directional Index (ADX) exceeding a configurable threshold (default: 43).
A bullish setup occurs when the short-term EMA is above the mid-term EMA, which in turn is above the long-term EMA, and price trades above the fastest EMA.
A bearish setup is the mirror condition.
Execution Rules
Entry:
• Long when ADX confirms trend strength and EMA alignment is bullish.
• Short when ADX confirms trend strength and EMA alignment is bearish.
Exit:
• Stop Loss: 1.8 × ATR below (for longs) or above (for shorts) the entry price.
• Take Profit: 3.3 × ATR in the direction of the trade.
Both parameters are configurable.
Additional Features
• Start/end date inputs for controlled backtesting.
• Selective activation of long or short trades.
• Built-in commission and position sizing (percent of equity).
• Full visual representation of EMAs, ADX, stop-loss, and target levels.
This strategy emphasizes clean trend participation, strict entry qualification, and consistent reward-to-risk structure. Ideal for swing or medium-term testing across trending assets.

Fury by Tetrad Fury by Tetrad
What it is:
A rules-based Bollinger+RSI strategy that fades extremes: it looks for price stretching beyond Bollinger Bands while RSI confirms exhaustion, enters countertrend, then exits at predefined profit multipliers or optional stoploss. “Ultra Glow” visuals are purely cosmetic.
How it works — logic at a glance
Framework: Classic Bollinger Bands (SMA basis; configurable length & multiplier) + RSI (configurable length).
Long entries:
Price closes below the lower band and RSI < Long RSI threshold (default 28.3) → open LONG (subject to your “Market Direction” setting).
Short entries:
Price closes above the upper band and RSI > Short RSI threshold (default 88.4) → open SHORT.
Profit exits (price targets):
Uses simple multipliers of the strategy’s average entry price:
Long exit = `entry × Long Exit Multiplier` (default 1.14).
Short exit = `entry × Short Exit Multiplier` (default 0.915).
Risk controls:
Optional pricebased stoploss (disabled by default) via:
Long stop = `entry × Long Stop Factor` (default 0.73).
Short stop = `entry × Short Stop Factor` (default 1.05).
Directional filter:
“Market Direction” input lets you constrain entries to Market Neutral, Long Only, or Short Only.
Visuals:
“Ultra Glow” draws thin layered bands around upper/basis/lower; these do not affect signals.
> Note: Inputs exist for a timebased stop tracker in code, but this version exits via targets and (optional) price stop only.
Why it’s different / original
Explicit extreme + momentum pairing: Entries require simultaneous band breach and RSI exhaustion, aiming to avoid entries on gardenvariety volatility pokes.
Deterministic exits: Multiplier-based targets keep results auditable and reproducible across datasets and assets.
Minimal, unobtrusive visuals: Thin, layered glow preserves chart readability while communicating regime around the Bollinger structure.
Inputs you can tune
Bollinger: Length (default 205), Multiplier (default 2.2).
RSI: Length (default 23), Long/Short thresholds (28.3 / 88.4).
Targets: Long Exit Mult (1.14), Short Exit Mult (0.915).
Stops (optional): Enable/disable; Long/Short Stop Factors (0.73 / 1.05).
Market Direction: Market Neutral / Long Only / Short Only.
Visuals: Ultra Glow on/off, light bar tint, trade labels on/off.
How to use it
1. Timeframe & assets: Works on any symbol/timeframe; start with liquid majors and 60m–1D to establish baseline behavior, then adapt.
2. Calibrate thresholds:
Narrow/meanreverting markets often tolerate tighter RSI thresholds.
Fast/volatile markets may need wider RSI thresholds and stronger stop factors.
3. Pick realistic targets: The default multipliers are illustrative; tune them to reflect typical mean reversion distance for your instrument/timeframe (e.g., ATRinformed profiling).
4. Risk: If enabling stops, size positions so risk per trade ≤ 1–2% of equity (max 5–10% is a commonly cited upper bound).
5. Mode: Use Long Only or Short Only when your discretionary bias or higher timeframe model favors one side; otherwise Market Neutral.
Recommended publication properties (for backtests that don’t mislead)
When you publish, set your strategy’s Properties to realistic values and keep them consistent with this description:
Initial capital: 10,000 (typical retail baseline).
Commission: ≥ 0.05% (adjust for your venue).
Slippage: ≥ 2–3 ticks (or a conservative pertrade value).
Position sizing: Avoid risking > 5–10% equity per trade; fixedfractional sizing ≤ 10% or fixedcash sizing is recommended.
Dataset / sample size: Prefer symbols/timeframes yielding 100+ trades over the tested period for statistical relevance. If you deviate, say why.
> If you choose different defaults (e.g., capital, commission, slippage, sizing), explain and justify them here, and use the same settings in your publication.
Interpreting results & limitations
This is a countertrend approach; it can struggle in strong trends where band breaches compound.
Parameter sensitivity is real: thresholds and multipliers materially change trade frequency and expectancy.
No predictive claims: Past performance is not indicative of future results. The future is unknowable; treat outputs as decision support, not guarantees.
Suggested validation workflow
Try different assets. (TSLA, AAPL, BTC, SOL, XRP)
Run a walkforward across multiple years and market regimes.
Test several timeframes and multiple instruments. (30m Suggested)
Compare different commission/slippage assumptions.
Inspect distribution of returns, max drawdown, win/loss expectancy, and exposure.
Confirm behavior during trend vs. range segments.
Alerts & automation
This release focuses on chart execution and visualization. If you plan to automate, create alerts at your entry/exit conditions and ensure your broker/venue fills reflect your slippage/fees assumptions.
Disclaimer
This script is provided for educational and research purposes. It is not investment advice. Trading involves risk, including the possible loss of principal. © Tetrad Protocol.

Ajay R5.41🔻 Ajay Gold 3H Power Indicator 🔻
Precision-Based Smart Sell System for Gold (XAU/USD)
💡 Overview
This indicator is specifically designed for Gold (XAU/USD) and delivers best results on the 3-Hour Timeframe (3H TF).
It is a Smart Money Logic-based Sell Confirmation System, combining institutional structure and candle behavior to generate highly accurate bearish signals.
⚙️ Technical Foundation
The indicator uses multiple advanced confirmations:
📉 EMA Trend Filter → Confirms downtrend
💪 RSI Overbought Rejection → Momentum reversal signal
📊 MACD Bearish Cross → Confirms trend strength
🕯️ Bearish Candle Structure → Price action validation
When all conditions align, a clear 🔻 Sell Signal is plotted on the chart.
💎 Hidden Feature
This indicator includes a hidden feature that activates only when the correct market structure forms.
It helps reduce false signals and increases accuracy without being visible on the chart — fully automated internal logic.
📆 Recommended Settings
Symbol: XAU/USD (Gold)
Timeframe: 3-Hour (3H)
Market: Forex / Commodity
Mode: Sell-Only Confirmation Indicator
Performance: Best precision and consistency on 3H TF
📈 How to Use
Select XAU/USD on chart and set 3H timeframe.
Add the indicator to the chart.
Wait for the 🔻 Sell Signal and confirm the market structure after candle close.
Take entry according to your risk management.
⚠️ Disclaimer
This indicator is for educational and analytical purposes only.
No system is 100% accurate — always backtest and demo trade before using in real trading.
💬 Credits
Developed by Ajay Sahu (India)
Based on Institutional & Smart Money Logic
Best results on 3H TF
Hidden Algorithm for XAU/USD traders

VWAP + Multi-Timeframe RSI StrategyThis strategy combines VWAP trend direction with confirmation from RSI on a higher timeframe. The idea is to only take trades when both intraday momentum and higher-timeframe trend are aligned, increasing accuracy.
LONG Entry:
Price above VWAP (bullish environment).
RSI on the current timeframe is below overbought (room to rise).
RSI on the higher timeframe (default H1) is above 50 (bullish confirmation).
SHORT Entry:
Price below VWAP (bearish environment).
RSI on the current timeframe is above oversold (room to fall).
RSI on the higher timeframe is below 50 (bearish confirmation).
Exit Rule:
Stop-loss near VWAP.
Take-profit at ~2x risk or when major levels are reached.
Best Timeframes:
Use 15m or 30m chart with H1 RSI for intraday trading.
Use 1H chart with Daily RSI for swing trading.
⚡ The higher-timeframe RSI filter reduces false signals and aligns trades with institutional flow.

KCandle Strategy 1.0# KCandle Strategy 1.0 - Trading Strategy Description
## Overview
The **KCandle Strategy** is an advanced Pine Script trading system based on bullish and bearish engulfing candlestick patterns, enhanced with sophisticated risk management and position optimization features.
## Core Logic
### Entry Signal Generation
- **Pattern Recognition**: Detects bullish and bearish engulfing candlestick formations
- **EMA Filter**: Uses a customizable EMA (default 25) to filter trades in the direction of the trend
- **Entry Levels**:
- **Long entries** at 25% of the candlestick range from the low
- **Short entries** at 75% of the candlestick range from the low
- **Signal Validation**: Orange candlesticks indicate valid setup conditions
### Risk Management System
#### 1. **Stop Loss & Take Profit**
- Configurable stop loss in pips
- Risk-reward ratio setting (default 2:1)
- Visual representation with colored lines and labels
#### 2. **Break-Even Management**
- Automatically moves stop loss to break-even when specified R:R is reached
- Customizable break-even offset for added protection
- Prevents losing trades after reaching profitability
#### 3. **Trailing Stop System**
- **Activation Trigger**: Activates when position reaches specified R:R level
- **Distance Control**: Maintains trailing stop at defined distance from entry
- **Step Management**: Moves stop loss forward in incremental R steps
- **Dynamic Protection**: Locks in profits while allowing for continued upside
### Advanced Features
#### Position Management
- **Pyramiding Support**: Optional multiple position entries with size reduction
- **Order Expiration**: Pending orders automatically cancel after specified bars
- **Position Sizing**: Percentage-based allocation with pyramid level adjustments
#### Visual Interface
- **Real-time Monitoring**: Comprehensive information panel with all strategy metrics
- **Historical Tracking**: Visual representation of past trades and levels
- **Color-coded Indicators**: Different colors for break-even, trailing, and standard stops
- **Debug Options**: Optional labels for troubleshooting and optimization
## Key Parameters
### Basic Settings
- **EMA Length**: Trend filter period
- **Stop Loss**: Risk per trade in pips
- **Risk/Reward**: Target profit ratio
- **Order Validity**: Duration of pending orders
### Risk Management
- **Break-Even R:R**: Profit level to trigger break-even
- **Trailing Activation**: R:R level to start trailing
- **Trailing Distance**: Stop distance from entry when trailing
- **Trailing Step**: Increment for stop loss advancement
## Strategy Benefits
1. **Objective Entry Signals**: Based on proven candlestick patterns
2. **Trend Alignment**: EMA filter ensures trades align with market direction
3. **Robust Risk Control**: Multiple layers of protection (SL, BE, Trailing)
4. **Profit Optimization**: Trailing stops maximize winning trade potential
5. **Flexibility**: Extensive customization options for different market conditions
6. **Visual Clarity**: Complete visual feedback for trade management
## Ideal Use Cases
- **Swing Trading**: Medium-term positions with trend-following approach
- **Breakout Trading**: Capturing momentum from engulfing patterns
- **Risk-Conscious Trading**: Suitable for traders prioritizing capital preservation
- **Multi-Timeframe**: Adaptable to various timeframes and instruments
---
*The KCandle Strategy combines traditional technical analysis with modern risk management techniques, providing traders with a comprehensive tool for systematic market participation.*

Weekend Hunter Ultimate v6.2 Weekend Hunter Ultimate v6.2 - Automated Crypto Weekend Trading System
OVERVIEW:
Specialized trading strategy designed for cryptocurrency weekend markets (Saturday-Sunday) when institutional traders are typically offline and market dynamics differ significantly from weekdays. Optimized for 15-minute timeframe execution with multi-timeframe confluence analysis.
KEY FEATURES:
- Weekend-Only Trading: Automatically activates during configurable weekend hours
- Dynamic Leverage: 5-20x leverage adjusted based on market safety and signal confidence
- Multi-Timeframe Analysis: Combines 4H trend, 1H momentum, and 15M execution
- 10 Pre-configured Crypto Pairs: BTC, ETH, LINK, XRP, DOGE, SOL, AVAX, PEPE, TON, POL
- Position & Risk Management: Max 4 concurrent positions, -30% account protection
- Smart Trailing Stops: Protects profits when approaching targets
RISK MANAGEMENT:
- Maximum daily loss: 5% (configurable)
- Maximum weekend loss: 15% (configurable)
- Per-position risk: Capped at 120-156 USDT
- Emergency stops for flash crashes (8% moves)
- Consecutive loss protection (4 losses = pause)
TECHNICAL INDICATORS:
- CVD (Cumulative Volume Delta) divergence detection
- ATR-based dynamic stop loss and take profit
- RSI, MACD, Bollinger Bands confluence
- Volume surge confirmation (1.5x average)
- Weekend liquidity adjustments
INTEGRATION:
- Designed for Bybit Futures (0.075% taker fee)
- WunderTrading webhook compatibility via JSON alerts
- Minimum position size: 120 USDT (Bybit requirement)
- Initial capital: $500 recommended
TARGET METRICS:
- Win rate target: 65%
- Average win: 5.5%
- Average loss: 1.8%
- Risk-reward ratio: ~3:1
IMPORTANT DISCLAIMERS:
- Past performance does not guarantee future results
- Leveraged trading carries substantial risk of loss
- Weekend crypto markets have 13% of normal liquidity
- Not suitable for traders who cannot afford to lose their entire investment
- Requires continuous monitoring and adjustment
USAGE:
1. Apply to 15-minute charts only
2. Configure weekend hours for your timezone
3. Set up webhook alerts for automation
4. Monitor performance table in top-right corner
5. Adjust parameters based on your risk tolerance
This is an experimental strategy for educational purposes. Always test with small amounts first and never invest more than you can afford to lose completely.

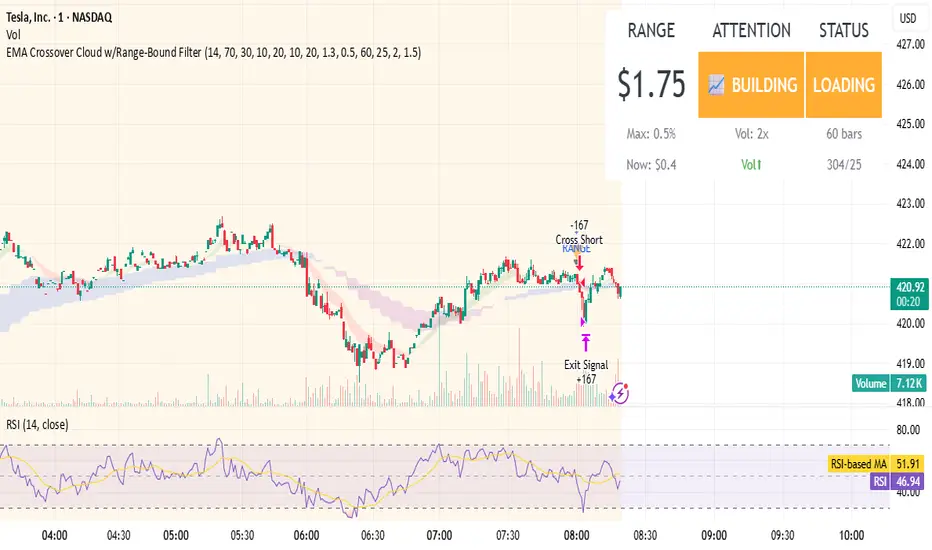
EMA Crossover Cloud w/Range-Bound FilterA focused 1-minute EMA crossover trading strategy designed to identify high-probability momentum trades while filtering out low-volatility consolidation periods that typically result in whipsaw losses. Features intelligent range-bound detection and progressive market attention alerts to help traders manage focus and avoid overtrading during unfavorable conditions.
Key Features:
EMA Crossover Signals: 10/20 EMA crossovers with volume surge confirmation (1.3x 20-bar average)
Range-Bound Filter: Automatically detects when price is consolidating in tight ranges (0.5% threshold) and blocks trading signals during these periods
Progressive Consolidation Stages: Visual alerts progress through Range Bound (red) → Coiling (yellow) → Loading (orange) → Trending (green) to indicate market compression and potential breakout timing
Market Attention Gauge: Helps manage focus between active trading and other activities with states: Active (watch close), Building (check frequently), Quiet (check occasionally), Dead (handle other business)
Smart RSI Exits: Cloud-based and RSI extreme level exits with conservative stop losses
Dual Mode Operation: Separate settings allow full backtesting performance while providing visual stay-out warnings for manual trading
How to Use:
Entry Signals: Trade aqua up-triangles (long) and orange down-triangles (short) when they appear with volume confirmation
Stay-Out Warnings: Ignore gray "RANGE" triangles - these indicate crossovers during range-bound periods that should be avoided
Monitor Top-Right Display:
Range: Current 60-bar dollar range
Attention: Market activity level for focus management
Status: Consolidation stage (trade green/yellow, avoid red, prepare for orange)
Position Sizing: Default 167 shares per signal, optimized for the crossover frequency
Alerts: Enable consolidation stage alerts and market attention alerts for automated notifications
Recommended Settings:
Timeframe: 1-minute charts
Symbol: Optimized for volatile stocks like TSLA
"Apply Filter to Backtest": Keep OFF for realistic backtesting, ON to see filtered results
Risk Management:
The strategy includes built-in overtrading protection by identifying and blocking trades during low-volatility periods. The progressive consolidation alerts help identify when markets are "loading" for significant moves, allowing traders to position appropriately for higher-probability setups.
SMA Cross 5/50 with Trend Filter & Risk Management by JuggiDThe basic SMA (5/50) crossover strategy can be enhanced to improve profitability by adding filters and risk management. For example, a long entry is triggered only when the fast SMA (5) crosses above the slow SMA (50) **and** the price is above the SMA (200), ensuring trades align with the major trend. Similarly, a short entry requires the crossover confirmation plus the price staying below the SMA (200). To reduce false signals and protect capital, stop-loss and take-profit levels can be set automatically (e.g., 2% loss, 5% gain), while additional confirmation tools such as volume spikes, RSI above 50, or MACD momentum can be applied to validate stronger signals. This approach helps avoid whipsaws in sideways markets and allows trades to capture larger moves while minimizing downside risk.

Extremum Range MA Crossover Strategy1. Principle of Work & Strategy Logic ⚙️📈
Main idea: The strategy tries to catch the moment of a breakout from a price consolidation range (flat) and the start of a new trend. It combines two key elements:
Moving Average (MA) 📉: Acts as a dynamic support/resistance level and trend filter.
Range Extremes (Range High/Low) 🔺🔻: Define the borders of the recent price channel or consolidation.
The strategy does not attempt to catch absolute tops and bottoms. Instead, it enters an already formed move after the breakout, expecting continuation.
Type: Trend-following, momentum-based.
Timeframes: Works on different TFs (H1, H4, D), but best suited for H4 and higher, where breakouts are more meaningful.
2. Justification of Indicators & Settings ⚙️
A. Moving Average (MA) 📊
Why used: Core of the strategy. It smooths price fluctuations and helps define the trend. The price (via extremes) must cross the MA → signals a potential trend shift or strengthening.
Parameters:
maLength = 20: Default length (≈ one trading month, 20-21 days). Good balance between sensitivity & smoothing.
Lower TF → reduce (10–14).
Higher TF → increase (50).
maSource: Defines price source (default = Close). Alternatives (HL2, HLC3) → smoother, less noisy MA.
maType: Default = EMA (Exponential MA).
Why EMA? Faster reaction to recent price changes vs SMA → useful for breakout strategies.
Other options:
SMA 🟦 – classic, slowest.
WMA 🟨 – weights recent data stronger.
HMA 🟩 – near-zero lag, but “nervous,” more false signals.
DEMA/TEMA 🟧 – even faster & more sensitive than EMA.
VWMA 🔊 – volume-weighted.
ZLEMA ⏱ – reduced lag.
👉 Choice = tradeoff between speed of reaction & false signals.
B. Range Extremes (Previous High/Low) 📏
Why used: Define borders of recent trading range.
prevHigh = local resistance.
prevLow = local support.
Break of these levels on close = trigger.
Parameters:
lookbackPeriod = 5: Searches for highest high / lowest low of last 5 candles. Very recent range.
Higher value (10–20) → wider, stronger ranges but rarer signals.
3. Entry & Exit Rules 🎯
Long signals (BUY) 🟢📈
Condition (longCondition): Previous Low crosses MA from below upwards.
→ Price bounced from the bottom & strong enough to push range border above MA.
Execution: Auto-close short (if any) → open long.
Short signals (SELL) 🔴📉
Condition (shortCondition): Previous High crosses MA from above downwards.
→ Price rejected from the top, upper border failed above MA.
Execution: Auto-close long (if any) → open short.
Exit conditions 🚪
Exit Long (exitLongCondition): Close below prevLow.
→ Uptrend likely ended, range shifts down.
Exit Short (exitShortCondition): Close above prevHigh.
→ Downtrend likely ended, range shifts up.
⚠️ Important: Exit = only on candle close beyond extremes (not just wick).
4. Trading Settings ⚒️
overlay = true → indicators shown on chart.
initial_capital = 10000 💵.
default_qty_type = strategy.cash, default_qty_value = 100 → trades fixed $100 per order (not lots). Can switch to % of equity.
commission_type = strategy.commission.percent, commission_value = 0.1 → default broker fee = 0.1%. Adjust for your broker!
slippage = 3 → slippage = 3 ticks. Adjust to asset liquidity.
currency = USD.
margin_long = 100, margin_short = 100 → no leverage (100% margin).
5. Visualization on Chart 📊
The strategy draws 3 lines:
🔵 MA line (thickness 2).
🔴 Previous High (last N candles).
🟢 Previous Low (last N candles).
Also: entry/exit arrows & equity curve shown in backtest.
Disclaimer ⚠️📌
Risk Warning: This description & code are for educational purposes only. Not financial advice. Trading (Forex, Stocks, Crypto) carries high risk and may lead to full capital loss. You trade at your own risk.
Testing: Always backtest & demo test first. Past results ≠ future profits.
Responsibility: Author of this strategy & description is not responsible for your trading decisions or losses.

QZ Trend (Crypto Edition) v1.1a: Donchian, EMA, ATR, Liquidity/FThe "QZ Trend (Crypto Edition)" is a rules-based trend-following breakout strategy for crypto spot or perpetual contracts, focusing on following trends, prioritizing risk control, seeking small losses and big wins, and trading only when advantageous.
Key mechanisms include:
- Market filters: Screen favorable conditions via ADX (trend strength), dollar volume (liquidity), funding fee windows, session/weekend restrictions, and spot-long-only settings.
- Signals & entries: Based on price position relative to EMA and EMA trends, combined with breaking Donchian channel extremes (with ATR ratio confirmation), plus single-position rules and post-exit cooldowns.
- Position sizing: Calculate positions by fixed risk percentage; initial stop-loss is ATR-based, complying with exchange min/max lot requirements.
- Exits & risk management: Include initial stop-loss, trailing stop (tightens only), break-even rule (stop moves to entry when target floating profit is hit), time-based exit, and post-exit cooldowns.
- Pyramiding: Add positions only when profitable with favorable momentum, requiring ATR-based spacing; add size is a fraction of the base position, with layers sharing stop logic but having unique order IDs.
Charts display EMA, Donchian channels, current stop lines, and highlight low ADX, avoidable funding windows, and low-liquidity periods.
Recommend starting with 4H or 1D timeframes, with typical parameters varying by cycle. Liquidity settings differ by token; perpetuals should enable funding window filters, while spot requires "long-only" and matching fees. The strategy performs well in trends with quick stop-losses but faces whipsaws in ranges (filters mitigate but don’t eliminate noise). Share your symbol and timeframe for tailored parameters.

LP Sweep / Reclaim & Breakout Grading: Long-onlySignals
1) LP Sweep & Reclaim (mean-reversion entry)
Compute LP bounds from prior-bar window extremes:
lpLL_prev = lowest low of the last N bars (offset 1).
lpHH_prev = highest high of the last N bars (offset 1).
Sweep long trigger: current low dips below lpLL_prev and closes back above it.
Real-time quality grading (A/B/C) for sweep:
Trend filter & slope via EMA(88).
BOS bonus: close > last confirmed swing high.
Body size vs ATR, location above a long EMA, headroom to swing high (penalty if too close), and multi-sweep count bonus.
Sum → score → grade A/B/C; A or B required for sweep entry.
2) Trend Breakout (momentum entry)
Core trigger: close > previous Donchian high (length boLen) + ATR buffer.
Optional filter: close must be above the default EMA.
Breakout grading (A/B/C) in real time combining:
Trend up (price > EMA and EMA rising),
Body/ATR, Gap above breakout level (in ATR),
Volume vs MA,
Upper-wick penalty,
Position-in-Score: headroom to last swing high (penalty if too near) + EMA slope bonus.
Sum → score → A or B required if grading enabled.

Gann Fan Strategy [KedarArc Quant]Description
A single-concept, rule-based strategy that trades around a programmatic Gann Fan.
It anchors to a swing (or a manual point), builds 1×1 and related fan lines numerically, and triggers entries when price interacts with the 1×1 (breakout or bounce). Management is done entirely with the fan structure (next/previous line) plus optional ATR trailing.
What TV indicators are used
* Pivots: `ta.pivothigh/ta.pivotlow` to confirm swing highs/lows for anchor selection.
* ATR: `ta.atr` only to scale the 1×1 slope (optional) and for an optional trailing stop.
* EMA: `ta.ema` as a trend filter (e.g., only long above the EMA, short below).
No RSI/MACD/Stoch/Heikin/etc. The logic is one coherent framework: Gann price–time geometry, with ATR as a scale and EMA as a risk filter.
How it works
1. Anchor
* Auto: chooses the most recent *confirmed* pivot (you control Left/Right).
* Manual: set a price and bar index and the fan will hold that point (no re-anchoring).
* Optional Re-anchor when a newer pivot confirms.
2. 1×1 Slope (numeric, not cosmetic)
* ATR mode: `1×1 = ATR(Length) × Multiplier` (adapts to volatility).
* Fixed mode: `ticks per bar` (constant slope).
Because slope is numeric, it doesn’t change with chart zoom, unlike the drawing tool.
3. Fan Lines
Builds classic ratios around the 1×1: 1/8, 1/4, 1/3, 1/2, 1/1, 2/1, 3/1, 4/1, 8/1.
4. Signals
* Breakout: cross of price over/under the 1×1 in the EMA-aligned direction.
* Bounce (optional): touch + reversal across the 1×1 to reduce whipsaw.
5. Exits & Risk
* Take-profit at the next fan line; Stop at the previous fan line.
* If a level is missing (right after re-anchor), a fallback Risk-Reward (RR) is used.
* Optional ATR trailing stop.
Why this is unique
* True numeric fan: The 1×1 slope is calculated from ATR or fixed ticks—not from screen geometry—so it is scale-invariant and reproducible across users/timeframes.
* Deterministic anchor logic: Uses confirmed pivots (with your L/R settings). No look-ahead; anchors update only when the right bars complete.
* Fan-native trade management: Both entries and exits come from the fan structure itself (with a minimal ATR/EMA assist), keeping the method pure.
* Two entry archetypes: Breakout for momentum days; Bounce for range days—switchable without changing the core model.
* Manual mode: Lock a session’s bias by anchoring to a chosen swing (e.g., day’s first major low/high) and keep the fan constant all day.
Inputs (quick guide)
* Auto Anchor (Left/Right): pivot sensitivity. Higher values = fewer, stronger anchors.
* Re-anchor: refresh to newer pivots as they confirm.
* Manual Anchor Price / Bar Index: fixes the fan (turn Auto off).
* Scale 1×1 by ATR: on = adaptive; off = use ticks per bar.
* ATR Length / ATR Multiplier: controls adaptive slope; start around 14 / 0.25–0.35.
* Ticks per bar: exact fixed slope (match a hand-drawn fan by computing slope ÷ mintick).
* EMA Trend Filter: e.g., 50–100; trades only in EMA direction.
* Use Bounce: require touch + reverse across 1×1 (helps in chop).
* TP/SL at fan lines; Fallback RR for missing levels; ATR Trailing Stop optional.
* Transparency/Plot EMA: visual preferences.
Tips
* Range days: larger pivots (L/R 8–12), Bounce ON, ATR Multiplier \~0.30–0.40, EMA 100.
* Trend days: L/R 5–6, Breakout, Multiplier \~0.20–0.30, EMA 50, ATR trail 1.0–1.5.
* Match the TV Gann Fan drawing: turn ATR scale OFF, set ticks per bar = `(Δprice between anchor and 1×1 target) / (bars) / mintick`.
Repainting & testing notes
* Pivots require Right bars to confirm; anchors are set after confirmation (no look-ahead).
* Signals use the current bar close with TradingView strategy mechanics; real-time vs. bar-close can differ slightly, as with any strategy.
* Re-anchoring legitimately moves the structure when new pivots confirm—by design.
⚠️ Disclaimer
This script is provided for educational purposes only.
Past performance does not guarantee future results.
Trading involves risk, and users should exercise caution and use proper risk management when applying this strategy.

MTF FVG Confluence v6 — JSON Alerts via alert()This strategy combines multi-timeframe confluence with candlestick analysis and fair value gaps (FVGs) to generate structured long/short entries. It aligns Daily and 4H EMA trends with 1H MACD momentum, then confirms with engulfing candles and FVG zones for precision entries. Risk management is built-in, featuring stop-loss, 3R take-profit targets, and optional break-even logic, with dynamic JSON alerts for webhook automation.
Categories:
Candlestick analysis
Chart patterns
Cycles

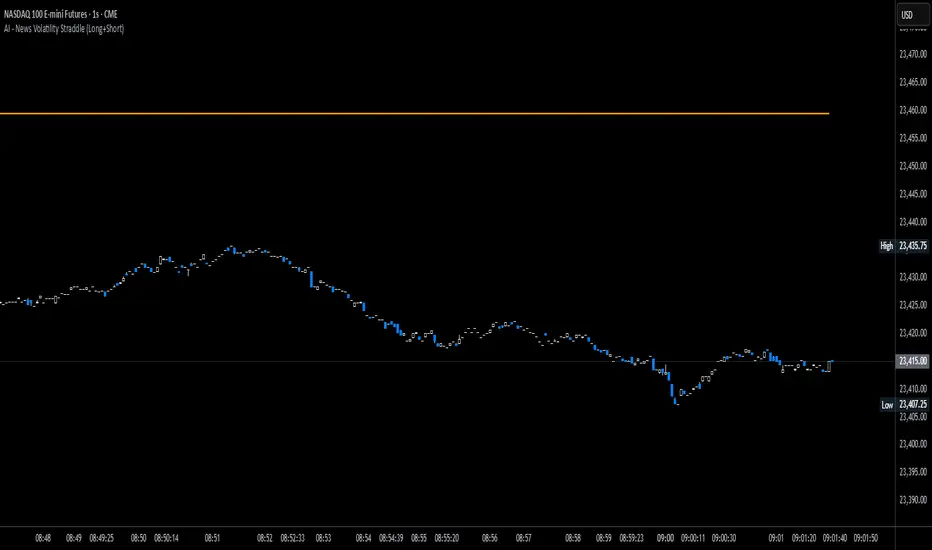
News Volatility Bracketing StrategyThis is a news-volatility bracketing strategy. Five seconds before a scheduled release, the strategy brackets price with a buy-stop above and a sell-stop below (OCO), then converts the untouched side into nothing while the filled side runs with a 1:1 TP/SL set the same distance from entry. Distances are configurable in USD or %, so it scales to the instrument and can run on 1-second data (or higher TF with bar-magnifier). The edge it’s trying to capture is the immediate, one-directional burst and liquidity vacuum that often follows market-moving news—entering on momentum rather than predicting direction. Primary risks are slippage/spread widening and whipsaws right after the print, which can trigger an entry then snap back to the stop.
FlowStateTrader FlowState Trader - Advanced Time-Filtered Strategy
## Overview
FlowState Trader is a sophisticated algorithmic trading strategy that combines precision entry signals with intelligent time-based filtering and adaptive risk management. Built for traders seeking to achieve their optimal performance state, FlowState identifies high-probability trading opportunities within user-defined time windows while employing dynamic trailing stops and partial position management.
## Core Strategy Philosophy
FlowState Trader operates on the principle that peak trading performance occurs when three elements align: **Focus** (precise entry signals), **Flow** (optimal time windows), and **State** (intelligent position management). This strategy excels at finding reversal opportunities at key support and resistance levels while filtering out suboptimal trading periods to keep traders in their optimal flow state.
## Key Features
### 🎯 Focus Entry System
**Support/Resistance Zone Trading**:
- Dynamic identification of key price levels using configurable lookback periods
- Entry signals triggered when price interacts with these critical zones
- Volume confirmation ensures genuine breakout/reversal momentum
- Trend filter alignment prevents counter-trend disasters
**Entry Conditions**:
- **Long Signals**: Price closes above support buffer, touches support level, with above-average volume
- **Short Signals**: Price closes below resistance buffer, touches resistance level, with above-average volume
- Optional trend filter using EMA or SMA for directional bias confirmation
### ⏰ FlowState Time Filtering System
**Comprehensive Time Controls**:
- **12-Hour Format Trading Windows**: User-friendly AM/PM time selection
- **Multi-Timezone Support**: UTC, EST, PST, CST with automatic conversion
- **Day-of-Week Filtering**: Trade only weekdays, weekends, or both
- **Lunch Hour Avoidance**: Automatically skips low-volume lunch periods (12-1 PM)
- **Visual Time Indicators**: Background coloring shows active/inactive trading periods
**Smart Time Features**:
- Handles overnight trading sessions seamlessly
- Prevents trades during historically poor performance periods
- Customizable trading hours for different market sessions
- Real-time trading window status in dashboard
### 🛡️ Adaptive Risk Management
**Multi-Level Take Profit System**:
- **TP1**: First profit target with optional partial position closure
- **TP2**: Final profit target for remaining position
- **Flexible Scaling**: Choose number of contracts to close at each level
**Dynamic Trailing Stop Technology**:
- **Three Operating Modes**:
- **Conservative**: Earlier activation, tighter trailing (protect profits)
- **Balanced**: Optimal risk/reward balance (recommended)
- **Aggressive**: Later activation, wider trailing (let winners run)
- **ATR-Based Calculations**: Adapts to current market volatility
- **Automatic Activation**: Engages when position reaches profitability threshold
### 📊 Intelligent Position Sizing
**Contract-Based Management**:
- Configurable entry quantity (1-1000 contracts)
- Partial close quantities for profit-taking
- Clear position tracking and P&L monitoring
- Real-time position status updates
### 🎨 Professional Visualization
**Enhanced Chart Elements**:
- **Entry Zone Highlighting**: Clear visual identification of trading opportunities
- **Dynamic Risk/Reward Lines**: Real-time TP and SL levels with price labels
- **Trailing Stop Visualization**: Live tracking of adaptive stop levels
- **Support/Resistance Lines**: Key level identification
- **Time Window Background**: Visual confirmation of active trading periods
**Dual Dashboard System**:
- **Strategy Dashboard**: Real-time position info, settings status, and current levels
- **Performance Scorecard**: Live P&L tracking, win rates, and trade statistics
- **Customizable Sizing**: Small, Medium, or Large display options
### ⚙️ Comprehensive Customization
**Core Strategy Settings**:
- **Lookback Period**: Support/resistance calculation period (5-100 bars)
- **ATR Configuration**: Period and multipliers for stops/targets
- **Reward-to-Risk Ratios**: Customizable profit target calculations
- **Trend Filter Options**: EMA/SMA selection with adjustable periods
**Time Filter Controls**:
- **Trading Hours**: Start/end times in 12-hour format
- **Timezone Selection**: Four major timezone options
- **Day Restrictions**: Weekend-only, weekday-only, or unrestricted
- **Session Management**: Lunch hour avoidance and custom periods
**Risk Management Options**:
- **Trailing Stop Modes**: Conservative/Balanced/Aggressive presets
- **Partial Close Settings**: Enable/disable with custom quantities
- **Alert System**: Comprehensive notifications for all trade events
### 📈 Performance Tracking
**Real-Time Metrics**:
- Net profit/loss calculation
- Win rate percentage
- Profit factor analysis
- Maximum drawdown tracking
- Total trade count and breakdown
- Current position P&L
**Trade Analytics**:
- Winner/loser ratio tracking
- Real-time performance scorecard
- Strategy effectiveness monitoring
- Risk-adjusted return metrics
### 🔔 Alert System
**Comprehensive Notifications**:
- Entry signal alerts with price and quantity
- Take profit level hits (TP1 and TP2)
- Stop loss activations
- Trailing stop engagements
- Position closure notifications
## Strategy Logic Deep Dive
### Entry Signal Generation
The strategy identifies high-probability reversal points by combining multiple confirmation factors:
1. **Price Action**: Looks for price interaction with key support/resistance levels
2. **Volume Confirmation**: Ensures sufficient market interest and liquidity
3. **Trend Alignment**: Optional filter prevents counter-trend positions
4. **Time Validation**: Only trades during user-defined optimal periods
5. **Zone Analysis**: Entry occurs within calculated buffer zones around key levels
### Risk Management Philosophy
FlowState Trader employs a three-tier risk management approach:
1. **Initial Protection**: ATR-based stop losses set at strategy entry
2. **Profit Preservation**: Trailing stops activate once position becomes profitable
3. **Scaled Exit**: Partial profit-taking allows for both security and potential
### Time-Based Edge
The time filtering system recognizes that not all trading hours are equal:
- Avoids low-volume, high-spread periods
- Focuses on optimal liquidity windows
- Prevents trading during news events (lunch hours)
- Allows customization for different market sessions
## Best Practices and Optimization
### Recommended Settings
**For Scalping (1-5 minute charts)**:
- Lookback Period: 10-20
- ATR Period: 14
- Trailing Stop: Conservative mode
- Time Filter: Major session hours only
**For Day Trading (15-60 minute charts)**:
- Lookback Period: 20-30
- ATR Period: 14-21
- Trailing Stop: Balanced mode
- Time Filter: Extended trading hours
**For Swing Trading (4H+ charts)**:
- Lookback Period: 30-50
- ATR Period: 21+
- Trailing Stop: Aggressive mode
- Time Filter: Disabled or very broad
### Market Compatibility
- **Forex**: Excellent for major pairs during active sessions
- **Stocks**: Ideal for liquid stocks during market hours
- **Futures**: Perfect for index and commodity futures
- **Crypto**: Effective on major cryptocurrencies (24/7 capability)
### Risk Considerations
- **Market Conditions**: Performance varies with volatility regimes
- **Timeframe Selection**: Lower timeframes require tighter risk management
- **Position Sizing**: Never risk more than 1-2% of account per trade
- **Backtesting**: Always test on historical data before live implementation
## Educational Value
FlowState serves as an excellent learning tool for:
- Understanding support/resistance trading
- Learning proper time-based filtering
- Mastering trailing stop techniques
- Developing systematic trading approaches
- Risk management best practices
## Disclaimer
This strategy is for educational and informational purposes only. Past performance does not guarantee future results. Trading involves substantial risk of loss and is not suitable for all investors. Users should thoroughly backtest the strategy and understand all risks before live trading. Always use proper position sizing and never risk more than you can afford to lose.
---
*FlowState Trader represents the evolution of systematic trading - combining classical technical analysis with modern risk management and intelligent time filtering to help traders achieve their optimal performance state through systematic, disciplined execution.*
