TopTenAlgo 8. Elliottwave Cycle EN: The Elliottwaves Cycle Oscillator is an indicator that allows the detection of impulsive (impulsive / ascend) or corrective (correction / fall) waves, ie each cycle (cycle) in Elliott Waves . The aim is to measure the speed of a real trend and to predict returns. In the uptrend or impulsive movement, Cycle continues its movement in the upper band after the price is set on a certain band, while in the downtrend or corrective move, the Cycle continues its movement in the lower band.
This algorithm is prepared with @Top10Algo ...
TR: Elliottwaves Cycle Osilatörü Elliott Dalgalarında ki impulsive (itkisel/yükseliş) yada corrective (düzeltme/düşüş) dalgaların yani her bir siklus’ un (cycle) önceden tespit edilmesini sağlayan bir göstergedir. Amaç gerçek bir trendin hızını ölçmek ve geri dönüşleri önceden tespit etmektir. Yükseliş trendi içinde yada impulsive bir harekette fiyat belli bir banda oturduktan sonra Cycle üst band’ da hareketine devam ederken, düşüş trendi içinde yada corrective bir harekette fiyat belli bir banda oturduktan sonra Cycle alt bandda hareketine devam eder.
Bu algoritma @Top10Algo ile beraber hazırlanmıştır...
Buscar en scripts para "Cycle"

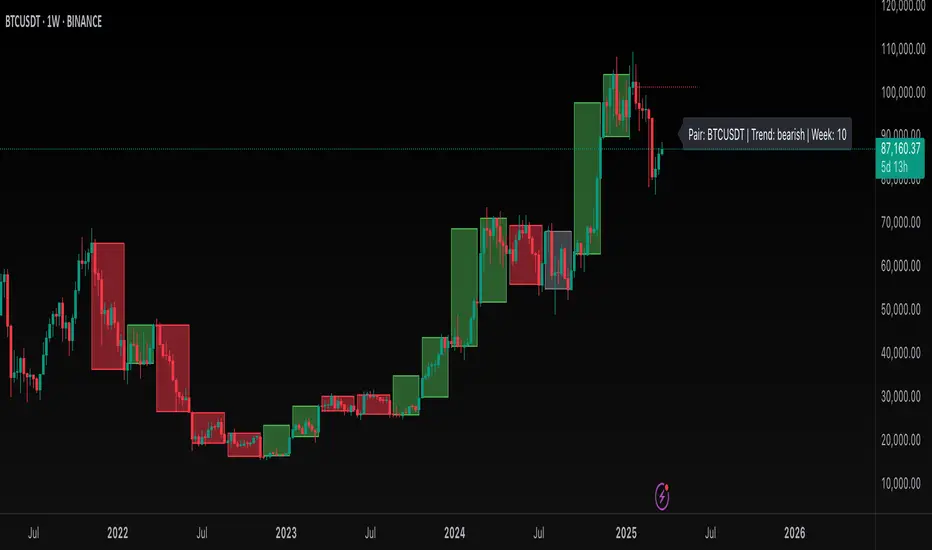
AnarchoEconomy 9-11 Weeks CyclesThis script is, with pleasure, written for the @AnarchoEconomy with his logic and strategy.
TO BE USED ONLY ON 1 WEEK TIMEFRAME!
1. Set the date in the settings to choose the all-time high on your pair.
2. The indicator divides price action into cycles.
3. A bullish cycle lasts 9 weeks.
4. A bearish cycle lasts 11 weeks.
5. A table displays the current symbol, trend, and week count.
For every next closed bullish cycle, you should know that the next two weeks could turn it into the bearish. If not, the new cycle will restart after 9 weeks of bullish close.
Ehlers Cycle Period [CC]The Cycle Period was created by John Ehlers and this is yet another version that shows how to calculate the current cycle period which is the approximate amount of days between a current peak or valley and the next peak or valley. I would not recommend this for trading since it is more for informational use only but I would try experimenting with this output to be used with another indicator as an input length. I have included strong buy and sell signals in addition to normal ones so strong signals are darker in color and normal signals are lighter in color.
Let me know if there are any other scripts you would like to see me publish!

Better RSI with bullish / bearish market cycle indicator This script improves the default RSI. First. it identifies regions of the RSI which are oversold and overbought by changing the color of RSI from white to red. Second, it adds additional reference lines at 20,40,50,60, and 80 to better gauge the RSI value. Finally, the coolest feature, the middle 50 line is used to indicate which cycle the price is currently at. A green color at the 50 line indicates a bullish cycle, a red color indicators a bearish cycle, and a white color indicates a neutral cycle.
The cycles are determined using the RSI as follows:
if RSI is overbought, cycle switches to bullish until RSI falls below 40, at which point it becomes neutral
if RSI is oversold, cycle switches bearish until RSI rises above 60, at which point it becomes neutral
a neutral cycle is exited at either overbought or oversold conditions
Very useful, please give it a try and let me know what you think

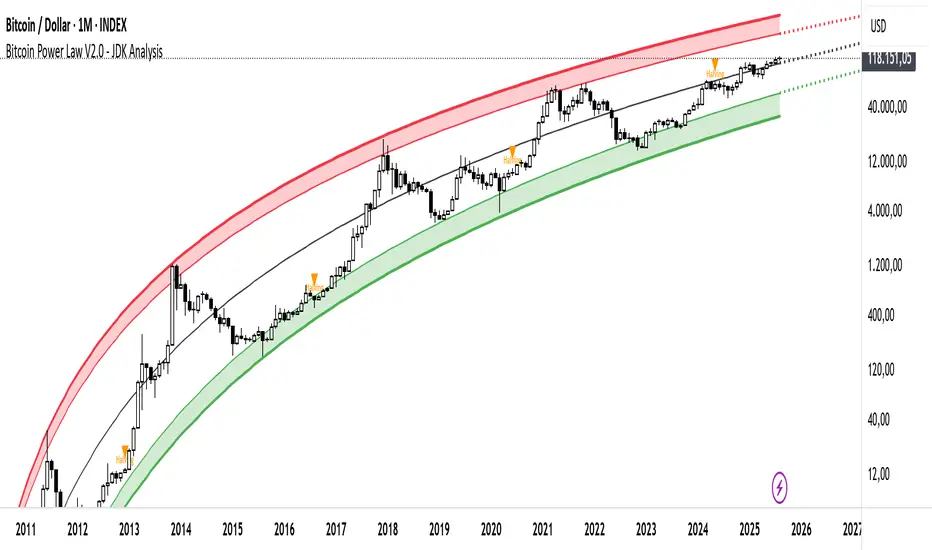
Bitcoin Cycle Log-Curve (JDK-Analysis)Important: The standard parameters provided in the script are specifically tuned for the TradingView Bitcoin Index chart on a monthly timeframe on logarithmic scale, and will yield the most accurate visual alignment when applied to that dataset. (more below)
This very simple script visualizes Bitcoin’s long-term price behavior using a logarithmic regression model designed to reflect the cyclical nature of Bitcoin’s historical market trends. Unlike typical technical indicators that react to recent price movements, this tool is built on the assumption that Bitcoin follows an exponential growth path over time, shaped by its fixed supply structure and four-year halving cycles.
The calculation behind the curved bands:
An upper boundary, a lower boundary, and a central midline, are calculated based on logarithmic functions applied to the bar index (which serves as a proxy for time). The upper and lower bounds are defined using exponential formulas of the type y = exp(constant + coefficient * log(bar_index)), allowing the curves to evolve dynamically over time. These bands serve as a macro-level guide for identifying periods of historical overvaluation (upper red curve) and undervaluation (lower green curve), with a central black curve representing the geometric average of the two.
How to customize the parameters:
The lower1_const and upper1_const values vertically shift the respective lower and upper curves—more negative values push the curve downward, while higher values lift it.
The lower1_coef and upper1_coef control the steepness of the curves over time, with higher values resulting in faster growth relative to time.
The shift_factor allows for uniform vertical adjustment of all curves simultaneously.
Additionally, the channel_width setting determines how far the mirrored bands extend from the original curves, creating a visual “channel” that can highlight more conservative or aggressive valuation zones depending on preference.
How to use this indicator:
This indicator is not intended for short-term trading or intraday signals. Rather, it serves as a contextual framework for long-term investors to identify high-risk zones near the upper curve and potential long-term value opportunities near the lower curve. These areas historically align with cycle tops and bottoms, and the model helps to place current price action within that broader cyclical narrative. While the concept draws inspiration from Bitcoin’s halving-driven market cycles and exponential adoption curve, the implementation is original in its use of time-based logarithmic regression to define dynamic trend boundaries.
It is best used as a strategic tool for cycle analysis, macro positioning, and trend anchoring—rather than as a short-term signal provider.
Schaff Trend Cycle [ChuckBanger]The Schaff Trend Cycle is a method, developed by Doug Schaff and based on the concept that trends also have repeating high and low patterns, or cycles. This is a modified MACD line, run through a modified stochastic algorithm and smoothed with Wilders’ smoothing in order to estimate the final Schaff Trend Cycle (STC) indicator. Its purpose is to identify the direction, in which a trend cycle is moving and possible peaks and bottoms within this cycle.
If this is interesting you should also take a look at MACD Leader:
For more info about Schaff Trend Cycle Indicator:
www.investopedia.com

Ehlers Cyber CycleEhlers Cyber Cycle indicator script.
This indicator was originally developed by John F. Ehlers (see his book `Cybernetic Analysis for Stocks and Futures`, Chapter 4: `Trading the Cycle`).
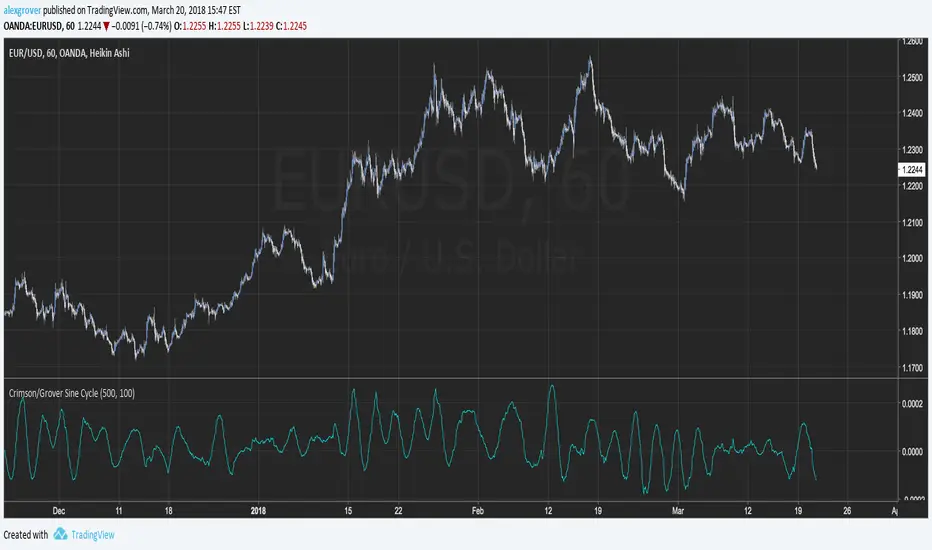
Crimson/Grover Sine CycleThere is plenty of indicators trying to show cycles in price, the majority of them create a stationary version of the price and then smooth it, the Crimson/Grover cycle use as source a pure sine wave of period crimson and then use a best fit line with y = price and x = sine wave.Some final transformations are mades for highlights the cycle of the price.
The length parameter control the regression period and the crimson parameter the period of the sine cycle.If the length is higher than the crimson period then the indicator is more smoother but give more liberty to the sine wave.
The period of sine wave is equal to period/(2*3.14) .
A sine wave of period 100
For any questions regarding the indicator please contact me :)
Ehlers Stochastic Cyber CycleEhlers Stochastic Cyber Cycle indicator script.
This indicator was originally developed by John F. Ehlers (see his book `Cybernetic Analysis for Stocks and Futures`, Chapter 8: `Stochasticization and Fisherization of Indicators`).

[iQ]PRO Dealing Range Cycle & Spectral Regression Histogram+🌟 PRO Dealing Range Cycle & Spectral Regression Histogram+ (DRC/SRH+)
Category: Advanced Market Cycle, Momentum, and Trend Analysis
The PRO Dealing Range Cycle & Spectral Regression Histogram+ is a meticulously engineered analytical tool, designed to provide our members with a superior, proprietary view of market structure, momentum, and mean reversion dynamics. This professional-grade indicator operates on a non-overlay panel, offering a clean and powerful interpretation layer distinct from the main price action.
🔬 Core Mechanism: Dual-Layered Analysis
This indicator combines two distinct, yet complementary, proprietary mathematical frameworks to deliver a holistic market picture:
The Dealing Range Cycle (DRC):
Utilizes a sophisticated, custom-displaced detrending oscillator built upon specialized percentage mathematics, rather than simple raw price differences.
The DRC identifies the latent cyclical forces within the price action, separating short-term noise from dominant swings.
It defines a "Dealing Range" through dynamically calculated High and Low Anchors, which represent the proprietary extremes of the current cycle. This framework provides invaluable context for understanding current price compression and expansion potentials.
The Quant Trend Signal is an integral component of the DRC, employing an adaptive logic to color-code the underlying direction of the core cyclical momentum, offering a robust directional confirmation.
The Spectral Regression Histogram (SRH+):
This component serves as the "Underpin Momentum" layer, a sensitive reading of current market velocity and pressure.
It employs a customized Spectral Regression Model to calculate deviations from an idealized price path. This is then passed through an advanced filtering and smoothing pipeline to extract high-frequency momentum components.
The SRH+ is visually presented as a Heatmap Histogram, dynamically color-graded to reflect the intensity of bullish (Gold/Yellow) or bearish (Bright Fuchsia) pressure. This gives users an immediate, spectral sense of the market's internal kinetic energy.
✨ Distinctive Features & Advantages
Proprietary Math Functions: The indicator relies on internalized custom mathematical functions (including specialized averages and high-precision linear regression) to generate unique, non-standard outputs that cannot be replicated with conventional indicators.
Decoupled Visualization: By operating on a separate panel, the DRC and SRH+ provide a noise-free environment for analysis, allowing for unambiguous interpretation of cyclical turning points and momentum shifts.
Intuitive Configuration: All core parameters, including Cycle Length, Regression Lookback, and Spectral Scale Factor, are meticulously organized into logical groups, allowing advanced users to fine-tune the engine without disrupting its proprietary internal logic.
The PRO DRC/SRH+ is not just an indicator; it is a diagnostic tool for the serious market participant, providing a powerful, proprietary lens to anticipate structural shifts and capitalize on the true rhythm of the market. Access is restricted to our most dedicated members, ensuring its edge remains sharp and exclusive.

AnNam RSI Cycle [PlungerMen] This script improves the default RSI 14
1: it identifies regions of the RSI which are oversold and overbought by changing the color of RSI from white to red.
2: it adds additional reference lines at 20,25.. 75,80 to better gauge the RSI value
Finally, the coolest feature, the middle 50 line is used to indicate which cycle the price is currently at
A green color at the 50 line indicates a bullish cycle, a red color indicators a bearish cycle, and a white color indicates a neutral cycle.
The cycles are determined using the RSI as follows:
if RSI is overbought, cycle switches to bullish until RSI falls below 40 , at which point it becomes neutral
if RSI is oversold, cycle switches bearish until RSI rises above 60, at which point it becomes neutral
a neutral cycle is exited at either overbought or oversold conditions
Thank for TradeCamily!

Ehlers Cycle BandPass Filter [CC]The Cycle BandPass Filter was created by John Ehlers (Cycle Modes and Trend Modes) and this is an alternate to the default BandPass Filter by changing some settings. This will be another series I will be introducing showing some indicators created by Ehlers and that didn't get much attention. This identifies the underlying cycle in the price data and these indicators aren't very common so I want to introduce more of these to tv. Buying and selling with these indicators can be a bit tricky but overall what Ehlers recommends is to buy at the lowest point and sell at the highest point to capture the underlying cycle. I have included strong buy and sell signals as darker colors and normal signals as lighter colors. Buy when the line turns green and sell when it turns red.
Let me know if there are any other scripts you would like to see me publish!

Thiru Time CyclesThiru Time Cycles - Advanced Time-Based Market Analysis System
WHAT IT DOES:
Automatically identifies and visualizes trading sessions, time cycles, and market structure elements. Helps traders identify optimal entry times, track session ranges, and monitor market structure through ICT/SMC methodologies.
KEY FEATURES:
1. SESSION KILLZONES
- Asia, London, NY AM, NY PM, Lunch, Power Hour sessions
- Customizable colors, transparency, and visual styles (Filled, Outline, TopLine, SideBars)
- Real-time high/low tracking within each session
2. 90-MINUTE TIME CYCLES
- Divides major sessions into three 90-minute cycles (A/M/D phases)
- London: LO A, LO M, LO D
- NY AM: AM A, AM M, AM D
- NY PM: PM A, PM M, PM D
3. 30-MINUTE SUB-CYCLES
- Granular 30-minute breakdowns (A1-A3, M1-M3, D1-D3)
- Precise entry timing within larger cycles
4. TOI (TIME OF INTEREST) TRACKER
- London: 2:45-3:15 AM, 3:45-4:15 AM
- NY AM: 9:45-10:15 AM, 10:45-11:15 AM
- NY PM: 1:45-2:15 PM, 2:45-3:15 PM
5. TRADE SETUP TIME WINDOWS
- London: 2:30-4:00 AM
- NY AM: 9:30-10:30 AM
- NY PM: 1:30-2:30 PM
6. TOI VERTICAL LINES
- 90-minute and 30-minute cycle boundary markers
- Customizable opacity, style, and height
7. PIVOT ANALYSIS
- High/Low pivot identification per session
- Pivot midpoints
- Customizable labels with price display
- Extension options (until mitigated/past mitigation)
8. SESSION RANGE TABLE
- Real-time range display
- Average range calculation
- Color-coded active sessions
9. OPENING PRICE LINES
- Daily Chart Open, hourly opens
- Customizable session opens
10. DAY/WEEK/MONTH FILTERS
- Filter by day of week
- Current week/last 4 weeks options
- D/W/M high/low tracking
HOW TO USE:
BASIC SETUP:
1. Add indicator to chart
2. Set timezone (default: America/New_York)
3. Enable desired sessions in Killzones section
4. Customize colors and styles
FOR SESSION TRADING:
- Enable session killzones you trade
- Monitor session boxes for high/low ranges
- Use range table for current/average ranges
FOR TIME CYCLE ANALYSIS:
- Enable 90-min or 30-min cycles
- Watch price action at cycle boundaries
- Use vertical lines for cycle transitions
FOR PIVOT TRADING:
- Enable "Show Pivots" in Killzone Pivots
- Use pivots as support/resistance
- Set alerts for pivot breaks
FOR TOI TRADING:
- Enable TOI Tracker
- Monitor specific time windows
- Use for precise entry timing
UNIQUE FEATURES:
✓ Custom visual system (Filled/Outline/TopLine/SideBars box styles)
✓ Proprietary color processing functions
✓ Dual cycle system (90-min + 30-min simultaneous tracking)
✓ Integrated TOI system with vertical line visualization
✓ Smart label positioning with collision detection
✓ Comprehensive range analysis with averaging
✓ Flexible session management with custom time windows
TECHNICAL:
- Pine Script v6
- 500 max labels/lines/boxes
- Full DST-aware timezone support
- Multi-timeframe compatible
- Customizable timeframe limits
BEST PRACTICES:
- Start with session killzones, add cycles gradually
- Set appropriate timeframe limits to avoid clutter
- Use consistent colors for clarity
- Enable only sessions you actively trade
- Monitor range table for session volatility
- Set pivot break alerts for your trading sessions
Compatible with all instruments (forex, stocks, futures, crypto). Works on all timeframes, optimized for intraday trading.
For support: @thirudinesh on TradingView
© 2025 thirudinesh - Advanced Time Cycle Analysis System
Proprietary Algorithm - All Rights Reserved

Simple CycleIntroduction
A simple and really clean cycle oscillator, in fact its quite precise even if the script use recursion which can sometime produce totally uncorrelated results.
On The Code
The calculations start with a who is a smoothing/averaging constant. Then comes src who is the input and is defined as the sum of the closing price with the output, then the output is high-pass filtered in b , after that the output is just the weighted average of the input change with b .
All those recursions and detrending steps make the indicator able to highlights cycles.

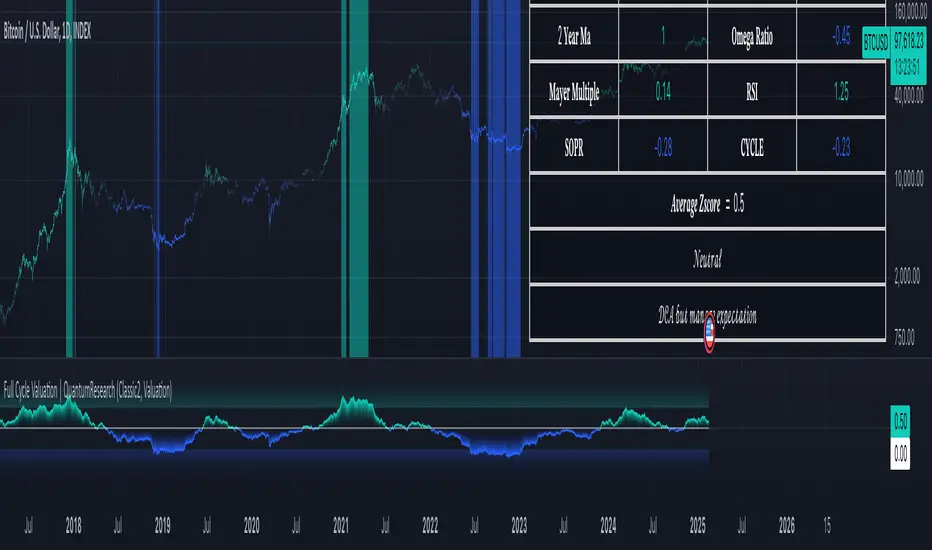
Full Cycle Valuation | QuantumResearchQuantumResearch Full Cycle Valuation Indicator for BTC only!
The Full Cycle Valuation indicator is an advanced on-chain valuation model that synthesizes multiple fundamental Bitcoin metrics into a single, normalized score.
By leveraging Power Law Corridor, Pi Cycle Top, Crosby Ratio, MVRV Z-Score, SOPR Z-Score, NUPL Z-Score, BAERM, and other key valuation signals, this tool provides traders and investors with an intuitive way to assess Bitcoin’s market cycle positioning and identify potential overbought or undervalued conditions. 🚀📊
1. Overview
This indicator helps users:
Identify Market Cycles – Uses a blend of statistical and fundamental models to determine whether Bitcoin is undervalued or overvalued.🔄
Normalize On-Chain & Valuation Metrics – Standardizes multiple valuation indicators through Z-score transformation for clearer insights📉📈
Assess Risk & Reward – Generates an Average Valuation Z-score, offering a high-level overview of current market positioning. ⚖️
Customize Visual Preferences – Dynamic color-coded signals, background fills, and table-based valuation metrics enhance usability. 🎨
2. How It Works
A. Power Law Corridor
The Power Law Model provides a long-term price corridor for Bitcoin based on a logarithmic regression formula. 🔢
The indicator evaluates where the current price sits relative to the Power Law Support & Resistance levels. 📊
Normalized Z-score Calculation: A standardized metric indicating overvaluation or undervaluation. 🎯
B. Pi Cycle Top
Uses the 111-day and 350-day moving averages to identify cyclical market peaks. 🔺
Generates a Z-score that measures deviation from historical overbought conditions. ⚠️
C. Crosby Ratio
Measures market momentum by analyzing Heikin-Ashi candle trends and ATR-based volatility. 📊
Provides a weekly trend strength score that is normalized into a Z-score. 📈
D. MVRV Z-Score
Compares Bitcoin's Market Cap to Realized Cap to assess whether price is above or below fair value. 💰
The higher the MVRV Z-score, the more overvalued Bitcoin is; lower scores indicate undervaluation. 🔻
E. SOPR Z-Score
Spent Output Profit Ratio (SOPR) measures profit-taking behavior in the market. 💵
SOPR is smoothed and standardized to filter out noise and highlight macro trends. 📊
F. NUPL Z-Score
Net Unrealized Profit/Loss (NUPL) calculates the proportion of coins held in profit versus loss. 📉📈
High Z-score values indicate speculative euphoria, while low values suggest capitulation. ⚠️
G. BAERM (Bitcoin AR Model)
BAERM is a statistical model that incorporates Bitcoin's supply, halvings, and historical growth trends to estimate fair value. 📉
This model is adjusted with a damping function to remove excess noise. 🎛️
H. Composite Full Cycle Z-Score
The indicator calculates a weighted average Z-score across all valuation models to generate a final Full Cycle Valuation Score. 📊
The score is used to define five distinct market states:
Very Undervalued (-3 to -2 Z-score): Ideal accumulation zone. 🟢
Undervalued (-2 to -1.5 Z-score): Accumulate Bitcoin at a discount. 🔵
Neutral (-1.5 to +1.5 Z-score): Fair market conditions. ⚪
Overheated (+1.5 to +2 Z-score): Potential distribution phase. 🟠
Very Overheated (>2 Z-score): High risk of market tops. 🔴
3. Visual Representation
This indicator offers multiple dynamic visual elements to improve clarity and ease of use:
Color-Coded Background Fill
Green Background – Indicates undervalued market conditions (Accumulation). 🟢
Blue Background – Signals overheated conditions (Distribution). 🔵
Table Display for Z-Scores
Displays each individual valuation model’s Z-score in a compact, color-coded format. 📊
The final average Z-score is highlighted, along with a corresponding market action recommendation. 🎯
4. Customization & Parameters
Traders and analysts can fine-tune the Full Cycle Valuation indicator to match their specific strategies:
On-Chain Valuation Metrics MVRV, SOPR, and NUPL Z-score lengths can be adjusted for different market perspectives.
Market Cycle Models Power Law Corridor: Adjustable regression parameters to modify long-term projections.
Pi Cycle & Crosby Ratio: Customizable smoothing lengths.
Threshold Adjustments Modify overvaluation and undervaluation thresholds to fine-tune signal sensitivity.
Visual Settings
Valuation Mode: Allows traders to switch between default mode and valuation-focused color themes. 🎨
5. Trading Applications
This indicator is not just for trading—it serves as a powerful macro analysis tool:
Long-Term Investing – Helps Bitcoin investors identify key accumulation and distribution phases. 📈
Market Timing – Guides traders in recognizing overbought and oversold conditions based on fundamental valuation. ⏳
Risk Management – Provides a systematic way to assess whether Bitcoin is fundamentally cheap or expensive. ⚠️
Cyclical Trend Analysis – Helps long-term investors compare past market cycles and spot repeating patterns. 🔄
6. Final Thoughts
The Full Cycle Valuation Indicator is a comprehensive macro valuation tool that combines multiple on-chain, statistical, and fundamental models into one easy-to-interpret score.
Whether you are a long-term investor looking to time Bitcoin cycles or a trader searching for additional confluence, this tool offers invaluable insights.
Important Disclaimer: No indicator can predict future price action with certainty. Always perform additional research and use proper risk management when making investment decisions. ⚠️📊
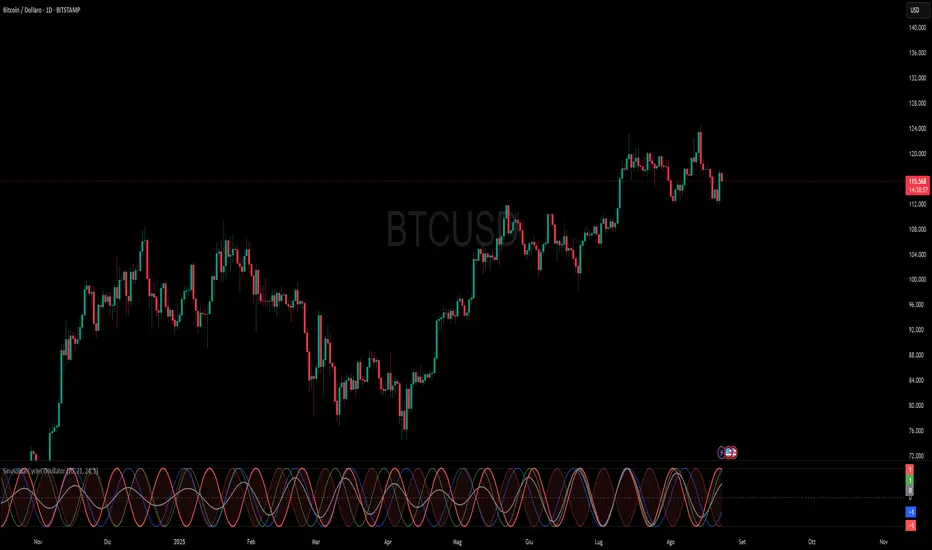
Sinusoidal Cycles OscillatorTitle: Sinusoidal Cycles Oscillator – Multi-Cycle Market Indicator
Description:
Discover market rhythm with the Sinusoidal Cycles Oscillator, a powerful tool for technical analysis and cyclical trading.
Three customizable cycles track short, medium, and long-term market oscillations.
Cycle 1 serves as the main reference wave with an optional mirror envelope.
Cycles 2 & 3 provide supporting harmonics for deeper insight.
Composite wave averages all cycles to reveal overall market phase.
Features:
Fully adjustable periods and amplitude.
Visualize tops, bottoms, and turning points at a glance.
Oscillator ranges from -1 to +1 with clear threshold guides.
Ideal for traders using cycle analysis, harmonic trading, or market timing.
Easy-to-read visual overlay and separate panel option.
Use it to:
Identify potential price reversals.
Compare market cycles across multiple timeframes.
Enhance timing and entry/exit decisions.
Bitcoin Bull Runs Mid Cycle Aligned This script plots 2 lines which are the 2013 and 2016 bull run. The plots are aligned on their mid cycles to the 2021 mid cycle.
Settings:
You can move the plots on the x and y axis in the settings for the Daily, Weekly and Monthly TFs.
The plot is weird on the Monthly TF, best to use the Daily and Weekly.
If it doesn't load at first you have to zoom out fully and go back to 2013 for it to load. Then it will load.

Ehlers Instantaneous Phase Dominant Cycle [CC]The Instantaneous Phase Dominant Cycle was created by John Ehlers (Stocks & Commodities V. 18:3 (16-27)) and this is one of many similar indicators that I will be publishing from Ehlers in the next few months that calculate the current dominant cycle period. The cycle period can be used in multiple ways but generally this means that if the stock is currently at a low then the current cycle period will tell you when the next lowest low will get hit or vice versa. This is also useful for using this cycle period as an input for other indicators to provide a very good adaptive length. Let me know how you wind up using these indicators in your daily trading. I have included the same buy and sell signals from my recent Hilbert Transform and so buy when the line turns green and sell when it turns red.
Let me know if there are any other indicators you would like to see me publish!

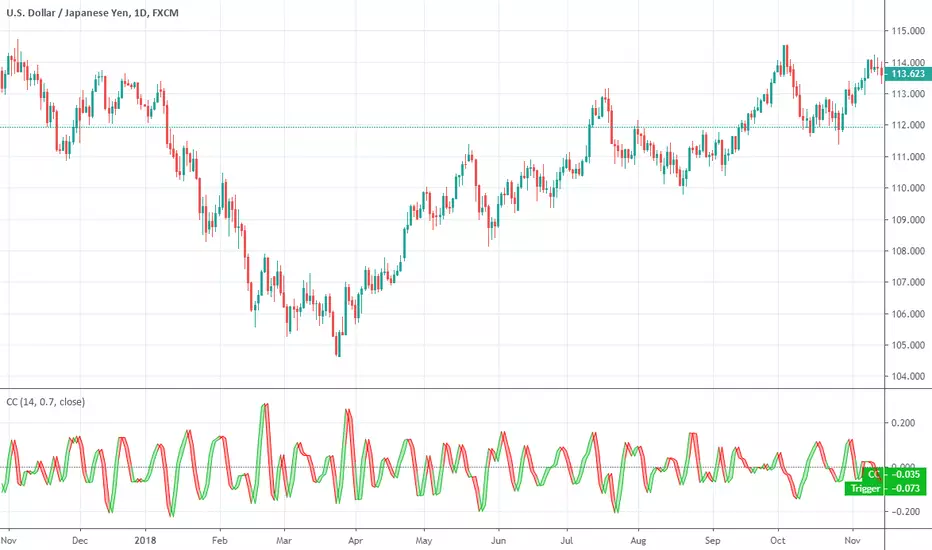
CCI Cycle (Modified Schaff Trend Cycle)This is a modified Schaff Trend Cycle (STC), which is designed to provide quicker entries and exits.
I've been a huge fan of the STC for a long time, but being based on the MACD means its signals often lag by a bar or two (especially in fast moving markets). All I've done here is take the base STC script (all credit to user @LazyBear), and change the source to a modified CCI.
The CCI Cycle provides more timely entries and exits, often by 1-2 bars. The flip side of the increased responsiveness is a prevalence for more false signals (a perfect example is the 17th August on the above chart). It's the nature of the beast! Still, I've been using this for a few months now and it's (in my opinion) an upgrade on the standard STC.
As always, you will need to pair this with another indicator or method of technical analysis to provide a trade bias, as the CCI Cycle (and STC) aren't designed to trade every signal. In my experience, either divergence identification, or using one or more moving averages works particularly well.
The indicator is also MTF capable, so you can get some interesting results from that.
Any queries let me know.
DD

Goertzel Cycle Period Adaptive Fisher Transform [Loxx]Goertzel Cycle Period Adaptive Fisher Transform is an adaptive Fisher Transform using the Goertzel Cycle Algorithm to derive length inputs.
What is Goertzel Cycle Algorithm?
Read here:
What is Fisher Transform?
The Fisher Transform is a technical indicator created by John F. Ehlers that converts prices into a Gaussian normal distribution.
The indicator highlights when prices have moved to an extreme, based on recent prices. This may help in spotting turning points in the price of an asset. It also helps show the trend and isolate the price waves within a trend.
Included:
Zero-line and signal cross options for bar coloring
Customizable overbought/oversold thresh-holds
Alerts
Signals
***Please note, the Goertzel Cycle Algorithm is processor heavy, so this indicator will take some time to load.

Ehlers Mesa Spectrum Dominant Cycle [CC]The Mesa Spectrum Dominant Cycle was created by John Ehlers and this is the foundation for many indicators he created that would later follow. This is his updated version of his original Mesa algorithm and I do not recommend this indicator as a stand alone for trading. This is more of an informational indicator that will tell you the current dominant cycle period which is the approximate period between peaks and valleys in the underlying data. I have color coded buy signals just in case with both strong and normal signals. Darker colors are strong and lighter colors are normal. Buy when the line is green and sell when it is red.
Let me know if there are any other indicators you would like to see me publish!

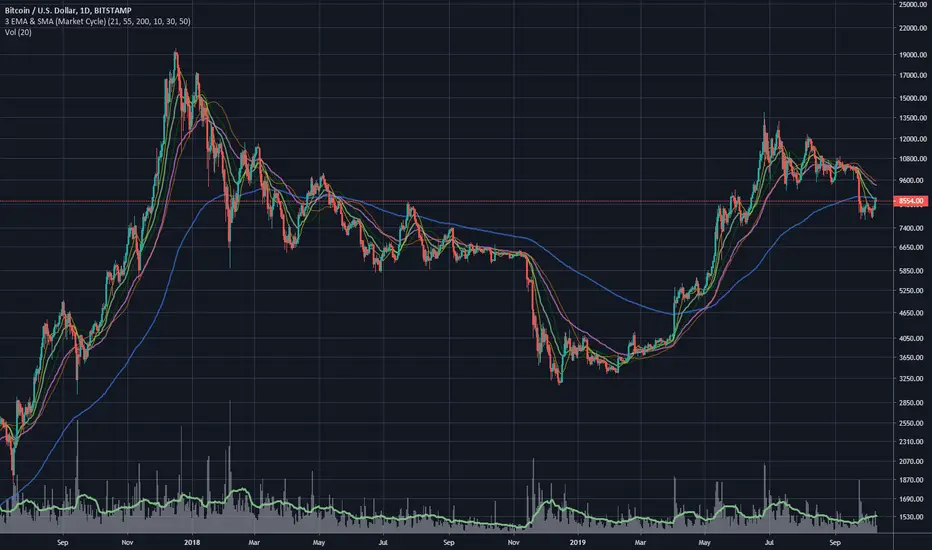
3 EMA & SMA (Market Cycle)Simple Indicator based on 3 Simple and 3 Exponential Moving Averages. Used to indicate Market Cycles.
Definition of Bull Market: 10 SMA is above 21 EMA . 30 SMA slope is up. 55 EMA is trending above 200 EMA .
Definition of Bear Market: 10 SMA is below 21 EMA . 30 SMA slope is down. 55 EMA is trending below 200 EMA .
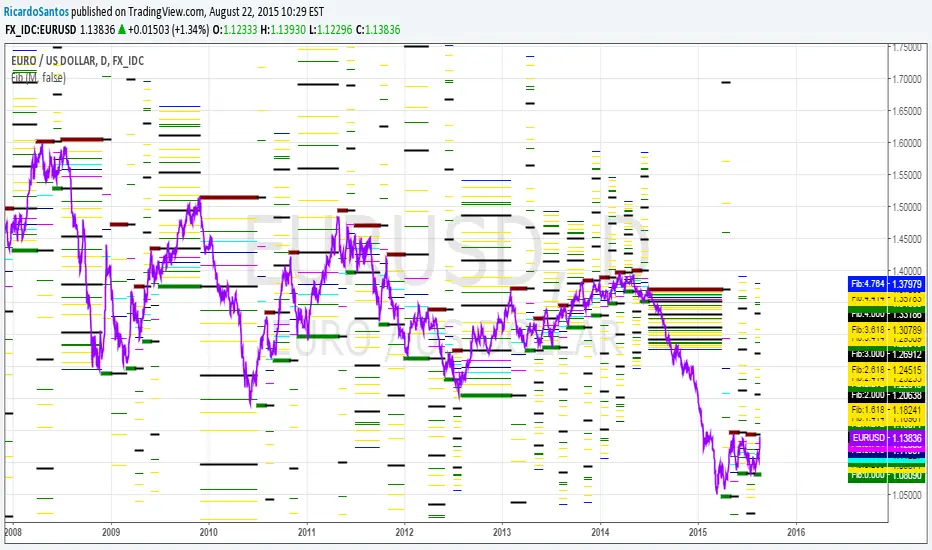
[RS]MTF Fibonacci Cycles V0EXPERIMENTAL:
Fibonacci rate levels based on price advance/decline, can be used to make visualizations of fib clusters or for cycles.