Financial Astrology Neptune LongitudeNeptune energy influence the charity, confusion, imagination, waste, crime, intuition, occult, scandal, illusion and dreams. It rules the industries related to chemicals, gas and oil, drugs and alcoholic beverages, scams, non profit organisations, spirituality. The last decade Neptune have been traveling through Piscis sign which caused humanity to have an illusion that economical growth don't have limits, as consequence we saw US indexes growth toward new all time highs. However, Neptune is close to leave Piscis, in 7 more degrees as per July 2021 and new cycle is going to start. It will be interesting to see what happens as Neptune moves into Aries sign.
This longitude indicator show a zodiac signs horizontal line boundaries that identify the start of the sign marked in the corresponding horizontal line label in the Y axis, this simplify the analysis of a planet effect within specific zodiac sign.
Note: The Neptune longitude indicator is based on an ephemeris array that covers years 2010 to 2030, prior or after this years the data is not available, this daily ephemeris are based on UTC time so in order to align properly with the price bars times you should set UTC as your chart timezone.
Buscar en scripts para "Cycle"

Bull Momentum GaugeBull Momentum Gauge
The Bull Momentum Gauge is a powerful momentum oscillator designed to identify the underlying strength and sustainability of major market trends. Instead of trying to predict tops and bottoms, this indicator helps traders and investors ride long-term bull markets by signaling when momentum is building and when it is starting to fade.
What it Does
At its core, this tool measures how statistically "stretched" or "compressed" an asset's price is relative to its long-term (1-year) trend. It does this by:
Calculating the price's deviation from its 365-day moving average.
Normalizing this deviation into a Z-score to measure its statistical significance.
Comparing the inverted Z-score to its own 200-day moving average to gauge the momentum of the trend itself.
The result is a single, smooth line that oscillates around a zero value.
How to Use It
The signals are simple and based on the indicator's relationship to the zero line:
Green Line (Gauge below 0): This indicates that the price has been compressed relative to its long-term trend and is now showing signs of building upward momentum. A cross into the green zone can be interpreted as a potential entry signal for a new bull run.
Red Line (Gauge above 0): This suggests that the price has become over-extended or "stretched" and the upward momentum is beginning to weaken. A cross into the red zone can be used as a potential exit signal, indicating it may be time to take profits and wait for the next cycle.
This indicator is designed to work across multiple timeframes (Daily, Weekly, Monthly) and provides a clear, data-driven framework for navigating major market cycles.

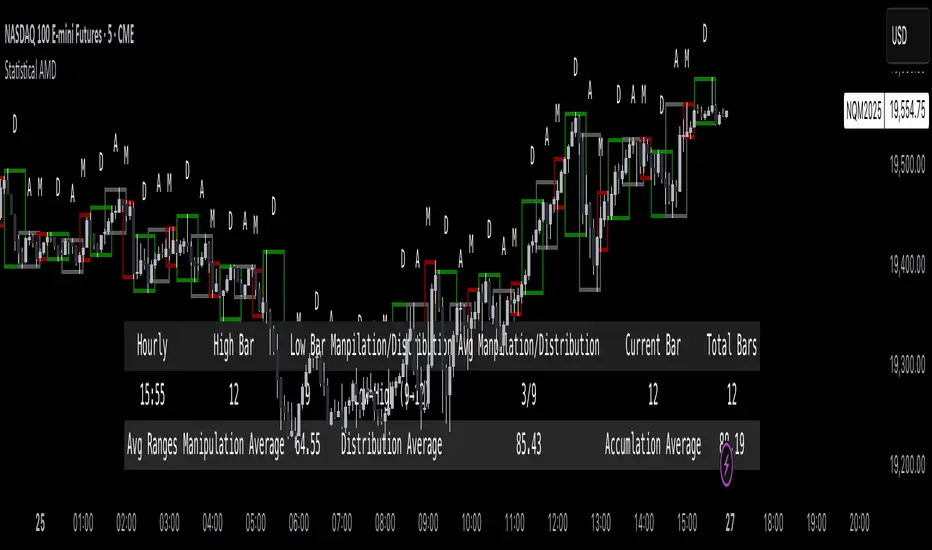
Statistical AMDOverview
The Statistical AMD ("Accumulation, Manipulation, Distribution") is a real-time statistical analyzer and visual segmentation tool for price action.
It identifies and tracks the structure of major movements within higher timeframe candles — breaking them into three key phases:
Manipulation (M): Early-stage liquidity sweeps.
Distribution (D): Mid-phase trending moves.
Accumulation (A): Late-stage compression zones.
The tool records and visualizes where highs and lows form relative to the open of a larger candle (e.g., 1-hour) and aggregates statistical behavior across sessions.
This is not a predictive indicator — it is a segmentation and statistical probability builder for real-time and historical analysis.
What It Does
Tracks High/Low Timing:
Identifies when the high and low occur during each higher timeframe candle (like hourly).
Plots Box Structures:
Color-coded boxes for each phase:
Red = Manipulation
Green = Distribution
White = Accumulation
Displays Statistical Table:
Average timing of highs and lows
Current vs historical bar position tracking
Average ranges for each phase
Historical Aggregation:
Aggregates hundreds of candles' data to build probabilistic expectations.
Live Updates:
Boxes dynamically expand as price evolves within each phase.
Key Settings
HTF Reference:
Select the higher timeframe to analyze (Default: 1 Hour).
Manually Input Legs:
Customize leg sizes for manipulation, distribution, and no-trade zones.
Defaults:
Manipulation Leg = 3 bars
Distribution Leg = 6 bars
No Trade Zone = 6 bars
Ideal For
Liquidity and Manipulation Traders:
Those analyzing sweep behaviors, fakeouts, and structural rotations.
Time-based Statistical Analysts:
Users who build mean-reversion or breakout models based on timing patterns.
ICT, Smart Money Concept (SMC) Traders:
Traders who track sweep → displacement → compression cycles.
Scalpers and Intraday Traders:
Anyone needing microstructural framing inside large candles.
Important Notes
Higher timeframe anchoring is critical.
Make sure you align the "HTF Reference" with your intended analysis frame (e.g., if you scalp on 1-min, set HTF to 1H or 4H).
The tool doesn’t predict future moves directly — it helps build a contextual, statistically-backed map of where you are inside the cycle.
Manual input flexibility allows tailoring for different asset volatility.
Final Thought
If you're trading without understanding the internal phases of a candle — you're navigating blind.
Statistical AMD arms you with objective, historical data about how and when price tends to expand, manipulate, and compress — so you can act with probability on your side.
Volume Difference Delta Cycle OscillatorVolume Difference Delta Cycle Oscillator indicator:
Using the power of my Volume Difference Indicator and standard deviations based on Bollinger Bands and more, we present this wonderful indicator with the following features:
Price Action Histogram: This is the bread and butter of this graph, if the PAH is above 0, this is considered a BULL cycle, and if below 0, this is considered a BEAR cycle. The histogram will move up and down based on the Histagram settings you set in the properties field. Be careful, we advise using default settings.
Custom Overbought & Oversold Lines:mean
These lines can be used to identify when to buy and sell the security, and help you make sense of the action of the histogram. Change the color, size, and linewidth!
These lines are what are used to perform the trades with the strategy as well, so if you change them, they will make an impact on the strategy itself.
EzSpot Background:
Do you want to turn your brain off and just trade when you you're inside an Overbought or Oversold line? Awesome! Turn on EzSpot backgrounds, and when it's green, go long, when it's red go short! Simple as that!
How it works:
By taking the Delta of the Volume Difference Indicator we're able to find the rate of change of the amount of change of volume, allowing us to see changes in volume before price changes. To add onto these, we supercharge it by taking the output of this line as the input source of bollinger bands which we use to output the %B of the Delta of the Volume Difference Indicator.
Separately, we calculate the %B of the current close to use later.
The final step is taking the second %B (which is an indication of where price lies on the curve of historical price data), and from it subtract the first %B, which allows us to visualize the standard deviation of the closing price, minus the standard deviation of Delta of the Volume Difference , which in essence allows us to see when volume changes but price does not and vice versa.
This final output is then plotted along with an over bought and over sold line, which we use to perform our trades on.
Simplified: This indicator shows the cycles of price action - volume based on the rate of the rate of volume changes based on price and the closing price.
Super Simple: Notice when volume increases but price hasn't, and vice versa with this indicator.

Financial Astrology Crypto ML Daily TrendThis daily trend indicator is based on financial astrology cycles detected with advanced machine learning techniques for the crypto-currencies research portfolio: ADA, BAT, BNB, BTC, DASH, EOS, ETC, ETH, LINK, LTC, XLM, XMR, XRP, ZEC and ZRX. The daily price trend is forecasted through this planets cycles (angular aspects, speed, declination), fast ones are based on Moon, Mercury, Venus and Sun and Mid term cycles are based on Mars, Vesta and Ceres. The combination of all this cycles produce a daily price trend prediction that is encoded into a PineScript array using binary format "0 or 1" that represent sell and buy signals respectively. The indicator provides signals since 2021-01-01 to 2022-12-31, the past months signals purpose is to support backtesting of the indicator combined with other technical indicator entries like MAs, RSI or Stochastic. For future predictions besides 2022 a machine learning models re-train phase will be required.
The resolution of this indicator is 1D, you can tune a parameter where you can determine how many future bars of daily trend are plotted and adjust an hours shift to anticipate future signals into current bar in order to produce a leading indicator effect to anticipate the trend changes with some hours of anticipation. Combined with technical analysis indicators this daily trend is very powerful because can help to produce approximately 60% of profitable signals based on the backtesting results. You can look at our open source Github repositories to validate accuracy using the backtesting strategies we have implemented in Jesse Crypto Trading Framework as proof of concept of the predictive potential of this indicator. Alternatively, we have implemented a PineScript strategy that use this indicator, just consider that we are pending to do signals update to the period July 2021 to December 2022: This strategy have accumulated more than 110 likes and many traders have validated the predictive power of Financial Astrology.
DISCLAIMER: This indicator is experimental and don’t provide financial or investment advice, the main purpose is to demonstrate the predictive power of financial astrology. Any allocation of funds following the documented machine learning model prediction is a high-risk endeavour and it’s the users responsibility to practice healthy risk management according to your situation.

Fed Balance Sheet vs GDP RatioThis indicator tracks the size of the Federal Reserve’s Balance Sheet relative to the total US Economy (Nominal GDP). It serves as a primary gauge for systemic liquidity and the extent of monetary intervention in the markets.
How it Works: The script calculates the ratio between:
Fed Total Assets (FRED:WALCL) - The total amount of bonds and assets held by the Fed.
US Nominal GDP (FRED:GDP) - The annualized economic output of the US.
How to Read the Levels: I have plotted historical reference lines to help contextualize the current cycle:
🔴 35% (Pandemic Peak): The absolute high of monetary stimulus (2020–2022). This represents maximum liquidity, where the Fed "printed" massive amounts of money to support the economy.
🟠 ~20% (The "Danger Zone"): This was the range established after the 2008 Financial Crisis (2014–2019). Watch this level closely. In late 2019, when the Fed tried to push the ratio below ~18%, the banking plumbing broke (the Repo Crisis), forcing them to restart QE. We are currently approaching this level again.
⚪ 6% (Pre-2008 Normal): The historical baseline before the era of Quantitative Easing (QE) began.
Why This Matters:
Rising Ratio: Suggests the Fed is expanding liquidity (QE) faster than the economy is growing. Historically, this is a tailwind for risk assets (Stocks, Crypto).
Falling Ratio: Suggests the Fed is tightening (QT) or the economy is outgrowing the money supply. This represents a headwind for liquidity and risk assets.
Methodology Note:
Data Source: Federal Reserve Economic Data (FRED).
Calculation: No manual annualization is applied to GDP, as FRED:GDP is already reported as a Seasonally Adjusted Annual Rate (SAAR).

RSI cyclic smoothed ProCyclic Smoothed Relative Strength Indicator - Pro Version
The cyclic smoothed RSI indicator is an enhancement of the classic RSI, adding
additional smoothing according to the market vibration,
adaptive upper and lower bands according to the cyclic memory and
using the current dominant cycle length as input for the indicator.
The cRSI is used like a standard indicator. The chart highlights trading signals where the signal line crosses above or below the adaptive lower/upper bands. It is much more responsive to market moves than the basic RSI.
The indicator uses the dominant cycle as input to optimize signal, smoothing and cyclic memory. To get more in-depth information on the cyclic-smoothed RSI indicator, please read Chapter 4 "Fine tuning technical indicators" of the book "Decoding the Hidden Market Rhythm, Part 1" available at your favorite book store.
Info: Pro Version
This is the actively maintained and continuously enhanced edition of my free, open-source indicator “RSI Cyclic Smoothed v2” which was recognized with a TradingView Editors’ Pick. The Pro Version will remain fully up to date with the latest Pine Script standards and will receive ongoing refinements and feature improvements, all while preserving the core logic and intent of the original tool. The legacy version will continue to be available for code review and educational purposes, but it will no longer receive updates. The legacy open-source version is here
Pro Features V1:
1) Leveraging multi-timeframe analysis
Indicator can be used on one chart by using different time frames at the same time. Read more on TradingView here .
2) Scoring feature added for scanning and filtering
This indicator now provides four distinct scoring states for both bullish and bearish conditions, making it fully compatible with the TradingView Screener .
Each score reflects a specific market phase based on RSI behavior, slope, and crossover signals.
Bullish States (Positive Scores)
+1 – Bull Exhaustion: Price is above the upper threshold and still rising (upsloping).
+2 – Bull Fatigue: Price is above the upper threshold but losing momentum (downsloping).
+3 – Bull Exit: A fresh downward crossover has occurred.
+4 – Recent Bull Exit: A downward crossover occurred within the recent lookback window.
Bearish States (Negative Scores)
–1 – Bear Exhaustion: Price is below the lower threshold and still declining (downsloping).
–2 – Bear Fatigue: Price is below the lower threshold but starting to turn upward (upsloping).
–3 – Bear Exit: A fresh upward crossover has occurred.
–4 – Recent Bear Exit: An upward crossover occurred within the recent lookback window.
The scoring states are shown in the indicator status panel when plotting the indicator on the chart. For a Screener run, use a generic cycle length setting.
How to determine the current active cycle length?
You can use the following additional tools to fine-tune the current dominant cycle length:
1. The advanced dyanmic Cycle Spectrum Scanner
2. The free Detremded Market Rhythm Oscillator
Script de pago

Continuous Accumulation Strategy [DCA] v9🇬🇧 English: Continuous Accumulation Strategy v9.4
This script is a full-featured strategy designed to backtest the "Buy the Dip" or "Dollar Cost Averaging" (DCA) philosophy. Its core feature is the Dynamic Peak Detection logic, which solves the "lock-in" problem of previous versions. Instead of getting stuck on an old high, the strategy constantly adapts to the market by referencing the most recent peak.
Key Features
* Dynamic Peak Detection: You define the "Peak Lookback Period." For example, on a Daily chart, setting it to `5` references the peak of the last business week.
* Stable Order Management: The strategy consistently uses a fixed cash amount (e.g., $100) for each entry, which prevents any runtime errors related to negative equity.
* Publishing-Ready: To meet TradingView's requirement for a backtest report, this strategy executes a symbolic, one-time "dummy trade" (one buy and one sell) at the very beginning of the test period. This first trade should be ignored when analyzing performance , as its only purpose is to enable publication.
How It Works
The main logic follows an adaptive cycle: Find Dynamic Peak -> Wait for a Drop -> Buy on Crossover -> Repeat.
1. Finds the Dynamic Peak: On every bar, it identifies the highest price within your defined lookback period.
2. Calculates the Drop: It constantly calculates the percentage drop from this moving peak.
3. Executes an Entry: The moment the price crosses below a target drop percentage, it executes a buy order.
4. Continuously Adapts: As the price moves, the dynamic peak is constantly updated, meaning the strategy never gets locked and is always ready for the next opportunity.
How to Use This Strategy
* Focus on the Strategy Tester: After adding it to the chart, analyze the Equity Curve, Net Profit, and Max Drawdown to see how this accumulation philosophy would have performed on your favorite asset.
* Optimize Parameters: Adjust the "Peak Lookback Period" and "Drop Percentages" to fit the volatility of the asset you are testing.
This is a tool for testing and analyzing a "buy and accumulate" philosophy. Its main logic does not generate sell signals.

Long-Term Trend & Valuation Model [Backquant]Long-Term Trend & Valuation Model
Invite-only. A universal long-term valuation strategy and trend model built to work across markets, with an emphasis on crypto where cycles and volatility are large. Intended primarily for the 1D timeframe. Inputs should be adjusted per asset to reflect its structure and volatility.
If you would like to checkout the simplified and open source valuation, check out:
What this is
A two-layer framework that answers two different questions.
• The Valuation Engine asks “how extended is price relative to its own long-term regime” and outputs a centered oscillator that moves positive in supportive conditions and negative in deteriorating conditions.
• The Trend Model asks “is the market actually trending in a sustained direction” and converts several independent subsystems into a single composite score.
The combination lets you separate “where we are in the cycle” from “what to do about it” so allocation and timing can be handled with fewer conflicts.
Design philosophy
Crypto and many risk assets move in multi-month expansions and contractions. Short tools flip often and can be misleading near regime boundaries. This model favors slower, high-confidence information, then summarizes it in simple visuals and alerts. It is not trying to catch every swing. It is built to help you participate in the meat of long uptrends, de-risk during deteriorations, and identify stretched conditions that deserve caution or patience.
Valuation Engine, high level
The Valuation Engine blends several slow signals into one measure. Exact transforms, windows, and weights are private, but the categories below describe the intent. Each input is standardized so unlike units can be combined without one dominating.
Momentum quality — favors persistent, orderly advances over erratic spikes. Helps distinguish trend continuation from noise.
Mean-reversion pressure — detects when price is far from a long anchor or when oscillators are pulling back toward equilibrium.
Risk-adjusted return — long-window reward to variability. Encourages time in market when advances are efficient rather than merely fast.
Volume imbalance — summarizes whether activity is expanding with advances or with declines, using a slow envelope to avoid day-to-day churn.
Trend distance — expresses how stretched price is from a structural baseline rather than from a short moving average.
Price normalization — a long z-score of price to keep extremes comparable across cycles and symbols.
How the Valuation Engine is shaped
Standardization — components are put on comparable scales over long windows.
Composite blend — standardized parts are combined into one reading with protective weighting. No single family can override the rest on its own.
Smoothing — optional moving average smoothing to reduce whipsaw around zero or around the bands.
Bounded scaling — the composite is compressed into a stable, interpretable range so the mid zone and extremes are visually consistent. This reduces the effect of outliers without hiding genuine stress.
Volatility-aware re-expansion — after compression, the series is allowed to swing wider in high-volatility regimes so “overbought” and “oversold” remain meaningful when conditions change.
Thresholds — fixed OB/OS levels or dynamic bands that float with recent dispersion. Dynamic bands use k times a rolling standard deviation. Fixed bands are simple and comparable across charts.
How to read the Valuation Oscillator
Above zero suggests a supportive backdrop. Rising and positive often aligns with uptrends that are gaining participation.
Below zero suggests deterioration or risk aversion. Falling and negative often aligns with distribution or with trend exhaustion.
Touches of the upper band show stretch on the optimistic side. Repeated tags without breakdown often occur late in cycles, especially in crypto.
Touches of the lower band show stretch on the pessimistic side. They are common in washouts and early bases.
Visual elements
Valuation Oscillator — colored by sign for instant context.
OB/OS guides — fixed or dynamic bands.
Background and bar colors — optional, tied to the sign of valuation for quick scans.
Summary table — optional, shows the standardized contribution of the major categories and the final composite score with a simple status icon.
Trend Model, composite scoring
The trend side aggregates several independent subsystems. Each subsystem issues a vote: long, short, or neutral. Votes are averaged into a composite score. The exact logic of each subsystem is intentionally abstracted. The families below describe roles, not formulas.
Long-horizon price state — checks where price sits relative to multiple structural baselines and whether those baselines are aligned.
Macro regime checks — favors sustained risk-on behavior and penalizes persistent deterioration in breadth or volatility structure.
Ultimate confirmation — a conservative filter that only votes when directional evidence is persistent.
Minimalist sanity checks — keep the model responsive to obvious extremes and prevent “stuck neutral” states.
Higher timeframe or overlay inputs — optional votes that consider slower contexts or relative strength to stabilize borderline periods.
You define two cutoffs for the composite: above the long threshold the state is Long , below the short threshold the state is Short , in between is Cash/Neutral . The script paints a signal line on price for an at-a-glance view and provides alerts when the composite crosses your thresholds.
How it can be used
Cycle framing in crypto — use deep negative valuation as accumulation context, then look for the composite trend to move through your long threshold. Late in cycles, extended positive valuation with weakening composite votes is a caution cue for de-risking or tighter management.
Regime-based allocation — increase risk or loosen take-profits when the composite is firmly Long and valuation is rising. Decrease risk or rotate to stable holdings when the composite is Short and valuation is falling.
Signal gating — run shorter-term entry systems only in the direction of the composite. This reduces counter-trend trades and improves holding discipline during strong uptrends.
Sizing overlay — scale position sizes by the magnitude of the valuation reading. Smaller sizes near the upper band during aging advances, larger sizes near zero after strong resets.
DCA context — for long-only accumulation, schedule heavier adds when valuation is negative and stabilizing, then lighten or pause adds when valuation is very positive and flattening.
Cross-asset rotation — compare symbols on 1D with the same fixed bands. Favor assets with positive valuation that are also in a Long composite state.
Interpreting common patterns
Early build-out — valuation rises from below zero, but the composite is still neutral. This is often the base-building phase. Patience and staged entries can make sense.
Healthy advance — valuation positive and trending up, composite firmly Long. Pullbacks that keep valuation above zero are usually opportunities rather than trend breaks.
Late-cycle stretch — valuation pinned near the upper band while the composite starts to weaken toward neutral. Consider trimming, tightening risk, or shifting to a “let the market prove it” stance.
Distribution and unwind — valuation negative and falling, composite Short. Rallies are treated as counter-trend until both turn.
Settings that matter
Timeframe
This model is intended for 1D as the primary view. It can be inspected on higher or lower frames, but the design choices assume daily bars for crypto and other risk assets.
Asset-specific tuning
Inputs should be adjusted per asset. Coins with high variability benefit from longer lookbacks and slightly wider dynamic bands. Lower-volatility instruments can use shorter windows and tighter bands.
Valuation side
Lookback lengths — longer values make the oscillator steadier and more cycle-aware. Shorter values increase sensitivity but create more mid-zone noise.
Smoothing — enable to reduce flicker around zero and around the bands. Disable if you want faster warnings of regime change.
Dynamic vs fixed thresholds — dynamic bands float with recent dispersion and keep OB/OS comparable across regimes. Fixed bands are simple and make inter-asset comparison easy.
Scaling and re-expansion — keep this enabled if you want extremes to remain interpretable when volatility rises.
Trend side
Composite thresholds — widen the neutral zone if you want fewer flips. Tighten thresholds if you want earlier signals at the cost of more transitions.
Visibility — use the price-pane signal line and bar coloring to keep the regime in view while you focus on structure.
Alerts
Valuation OB/OS enter and exit — the oscillator entering or leaving stretched zones.
Zero-line crosses — valuation turning positive or negative.
Trend flips — composite crossing your long or short threshold.
Strengths
Separates “valuation context” from “trend state,” which improves decisions about when to add, reduce, or stand aside.
Composite voting reduces reliance on any single indicator family and improves robustness across regimes.
Volatility-aware scaling keeps signals interpretable during quiet and wild markets.
Clear, configurable visuals and alerts that support long-horizon discipline rather than frequent toggling.
Final thoughts
This is a universal long-term valuation strategy and trend model that aims to keep you aligned with the dominant regime while giving transparent context for stretch and risk. For crypto on 1D, it helps map accumulation, expansion, distribution, and unwind phases with a single, consistent language. Tune lookbacks, smoothing, and thresholds to the asset you trade, let the valuation side tell you where you are in the cycle, and let the composite trend side tell you what stance to hold until the market meaningfully changes.

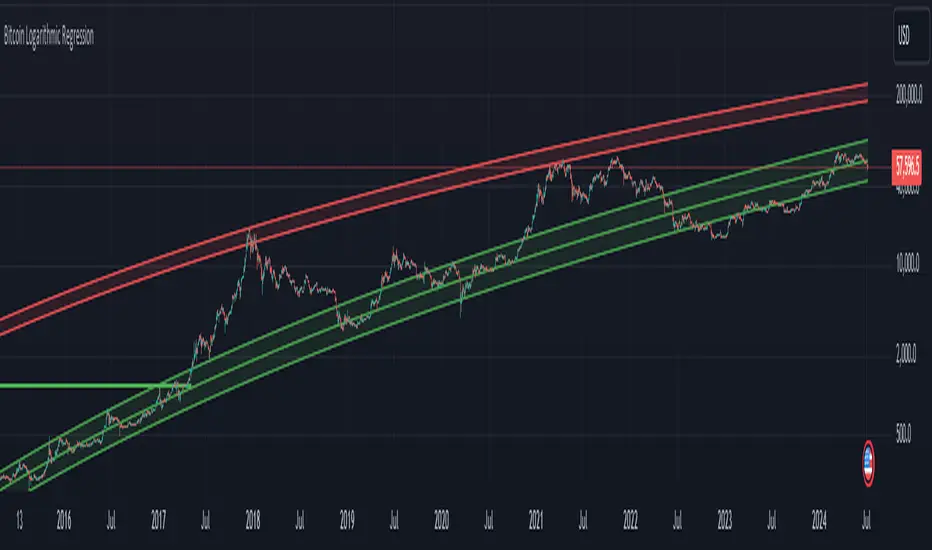
Bitcoin Logarithmic Regression
This indicator displays logarithmic regression channels for Bitcoin. A logarithmic regression is a function that increases or decreases rapidly at first, but then steadily slows as time moves. The original version of this indicator/model was created as an open source script by a user called Owain but is not available on TradingView anymore. So I decided to update the code to the latest version of pinescript and fine tune some of the parameters.
How to read and use the logarithmic regression:
There are 3 different regression lines or channels visible:
Green Channel: These lines represent different levels of support derived from the logarithmic regression model.
Purpose: The green channel is used to identify potential support levels where the price might find a bottom or bounce back upwards.
Interpretation:
If the price is approaching or touching the lower green lines, it might indicate a buying opportunity or an area where the price is considered undervalued.
------------------------------------------------
Red Channel: These lines represent different levels of resistance derived from the logarithmic regression model.
Purpose: The red channel is used to identify potential resistance levels where the price might encounter selling pressure or face difficulty moving higher.
Interpretation:
If the price is approaching or touching the upper red lines, it might indicate a selling opportunity or an area where the price is considered overvalued.
-------------------------------------------------
Purple Line This line represents to so-called "fair price" of Bitcoin according to the regression model.
Purpose: The purple line can be used to identify if the current price of Bitcoin is under- or overvalued.
Interpretation: A simple interpretation here would be that over time the price will have the tendency to always return to its "fair price", so starting to DCA more when price is under the line and less when it is over the line could be a suitable investment strategy.
----------------------------------------------------
Practical Application:
You can use this regression channel to build your own, long term, trading strategies. Notice how Bitcoin seems to always act in kind of the same 4 year cycle:
- Price likes to trade around the purple line at the time of the halvings
- After the halvings we see an extended sideways range for up to 300 days
- After the sideways range Bitcoin goes into a bull market frenzy (the area between the green and red channel)
- The price tops out at the upper red channel and then enters a prolonged bear market.
Buying around the purple line or lower line of the green channel and selling once the price reaches the red channel can be a suitable and very profitable strategy.
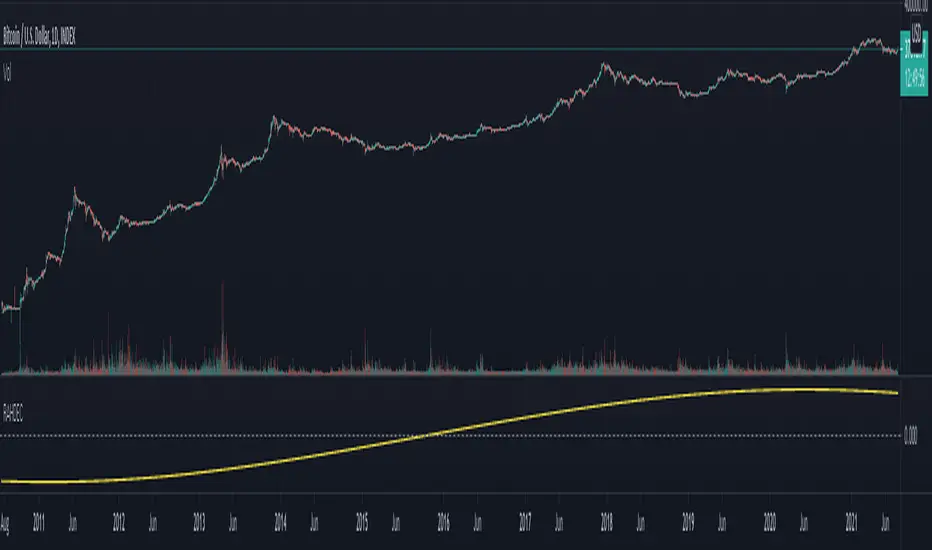
Bitcoin Market Cap wave model weeklyThis Bitcoin Market Cap wave model indicator is rooted in the foundation of my previously developed tool, the : Bitcoin wave model
To derive the Total Market Cap from the Bitcoin wave price model, I employed a straightforward estimation for the Total Market Supply (TMS). This estimation relies on the formula:
TMS <= (1 - 2^(-h)) for any h.This equation holds true for any value of h, which will be elaborated upon shortly. It is important to note that this inequality becomes the equality at the dates of halvings, diverging only slightly during other periods.
Bitcoin wave model is based on the logarithmic regression model and the sinusoidal waves, induced by the halving events.
This chart presents the outcome of an in-depth analysis of the complete set of Bitcoin price data available from October 2009 to August 2023.
The central concept is that the logarithm of the Bitcoin price closely adheres to the logarithmic regression model. If we plot the logarithm of the price against the logarithm of time, it forms a nearly straight line.
The parameters of this model are provided in the script as follows: log(BTCUSD) = 1.48 + 5.44log(h).
The secondary concept involves employing the inherent time unit of Bitcoin instead of days:
'h' denotes a slightly adjusted time measurement intrinsic to the Bitcoin blockchain. It can be approximated as (days since the genesis block) * 0.0007. Precisely, 'h' is defined as follows: h = 0 at the genesis block, h = 1 at the first halving block, and so forth. In general, h = block height / 210,000.
Adjustments are made to account for variations in block creation time.
The third concept revolves around investigating halving waves triggered by supply shock events resulting from the halvings. These halvings occur at regular intervals in Bitcoin's native time 'h'. All halvings transpire when 'h' is an integer. These events induce waves with intervals denoted as h = 1.
Consequently, we can model these waves using a sin(2pih - a) function. The parameter determining the time shift is assessed as 'a = 0.4', aligning with earlier expectations for halving events and their subsequent outcomes.
The fourth concept introduces the notion that the waves gradually diminish in amplitude over the progression of "time h," diminishing at a rate of 0.7^h.
Lastly, we can create bands around the modeled sinusoidal waves. The upper band is derived by multiplying the sine wave by a factor of 3.1*(1-0.16)^h, while the lower band is obtained by dividing the sine wave by the same factor, 3.1*(1-0.16)^h.
The current bandwidth is 2.5x. That means that the upper band is 2.5 times the lower band. These bands are forming an exceptionally narrow predictive channel for Bitcoin. Consequently, a highly accurate estimation of the peak of the next cycle can be derived.
The prediction indicates that the zenith past the fourth halving, expected around the summer of 2025, could result in Total Bitcoin Market Cap ranging between 4B and 5B USD.
The projections to the future works well only for weekly timeframe.
Enjoy the mathematical insights!

Bitcoin wave modelBitcoin wave model is based on the logarithmic regression model and the sinusoidal waves, induced by the halving events.
This chart presents the outcome of an in-depth analysis of the complete set of Bitcoin price data available from October 2009 to August 2023.
The central concept is that the logarithm of the Bitcoin price closely adheres to the logarithmic regression model. If we plot the logarithm of the price against the logarithm of time, it forms a nearly straight line.
The parameters of this model are provided in the script as follows: log (BTCUSD) = 1.48 + 5.44log(h).
The secondary concept involves employing the inherent time unit of Bitcoin instead of days:
'h' denotes a slightly adjusted time measurement intrinsic to the Bitcoin blockchain. It can be approximated as (days since the genesis block) * 0.0007. Precisely, 'h' is defined as follows: h = 0 at the genesis block, h = 1 at the first halving block, and so forth. In general, h = block height / 210,000.
Adjustments are made to account for variations in block creation time.
The third concept revolves around investigating halving waves triggered by supply shock events resulting from the halvings. These halvings occur at regular intervals in Bitcoin's native time 'h'. All halvings transpire when 'h' is an integer. These events induce waves with intervals denoted as h = 1.
Consequently, we can model these waves using a sin(2pih - a) function. The parameter determining the time shift is assessed as 'a = 0.4', aligning with earlier expectations for halving events and their subsequent outcomes.
The fourth concept introduces the notion that the waves gradually diminish in amplitude over the progression of "time h," diminishing at a rate of 0.7^h.
Lastly, we can create bands around the modeled sinusoidal waves. The upper band is derived by multiplying the sine wave by a factor of 3.1*(1-0.16)^h, while the lower band is obtained by dividing the sine wave by the same factor, 3.1*(1-0.16)^h.
The current bandwidth is 2.5x. That means that the upper band is 2.5 times the lower band. These bands are forming an exceptionally narrow predictive channel for Bitcoin. Consequently, a highly accurate estimation of the peak of the next cycle can be derived.
The prediction indicates that the zenith past the fourth halving, expected around the summer of 2025, could result in prices ranging between 200,000 and 240,000 USD.
Enjoy the mathematical insights!

Financial Astrology Vesta LongitudeVesta is one of the largest objects in the asteroid belt between Mars and Jupiter, the orbit duration is 3.63 years and seems to be very relevant celestial object in financial astrology. The experienced financial astrologer "Bill Meridian" indicates that this asteroid rules the security business, and paper securities such as bonds and stocks. We have confirmed through statistical research that adding this asteroid to astrology machine learning models provides an increase in daily trend predictions accuracy for crypto-currencies sector.
Our statistical analysis of Vesta zodiac sign location concluded that when is transiting the signs of Aries, Gemini, Cancer, Leo and Libra the daily trend is 59% or more of the days bullish. When Vesta is located at Capricorn is very bearish with 60% of the daily trend going in downward direction. In the other zodiac signs the daily trend was neutral showing most of the time a sideways pattern.
Is very interesting to note that the exact date July 21, 2021, when Vesta entered in Libra BTCUSD started the last bullish wave that finally broke the congestion zone of the 30K-35K and started a new bullish optimism. Pay attention on what happened in the previous cycle when Vesta was located in Libra and do your conclusions.
Note: Vesta longitude indicator is based on an ephemeris array that covers years 2010 to 2030, prior or after this years the data is not available, this daily ephemeris are based on UTC time so in order to align properly with the price bars times you should set UTC as your chart timezone.

Financial Astrology North Node (Rahu) DeclinationThe North Node (Rahu) declination is a long term cycle so don't seem to provide useful pattern for short/mid term trading, however is interesting to note that when the declination was within -6 to +6 degrees the price was congested within narrow price zone. As observed in all planets declinations indicators the boundary of moving from North to South or viceversa is critical to determine trend change but in the case of the Moon Nodes it seems to show that the planets energy becomes in equilibrium which causes that price are more stable.
Note: The North Node (Rahu) declination indicator is based on an ephemeris array that covers years 2010 to 2030, prior or after this years the data is not available, this daily ephemeris are based on UTC time so in order to align properly with the price bars times you should set UTC as your chart timezone.
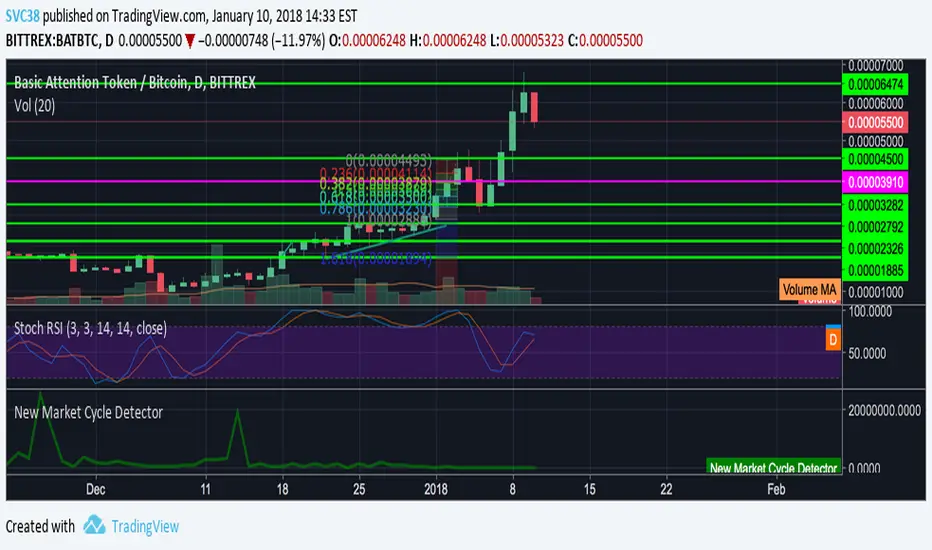
New Market Cycle DetectorIndicator that detects the end and beginning of the major market cycles. Designed and coded for crypto's. Best result on daily chart.
Use:
Major peak indicates end and beginning of a new major market cycle. This means that the market is at it's bottom and will almost certainly go up after that.
Normalized EMA Cycle (NEC)Normalized EMA Cycle (NEC)
The Normalized EMA Cycle (NEC) is a versatile momentum and trend reversal tool designed to detect high-probability turning points and gauge the strength of price cycles.
It combines fast and slow Exponential Moving Averages (EMAs), dynamic normalization, and adaptive transparency to create clear, intuitive reversal signals on the chart.
🔹 How It Works
EMA Differencing
The NEC calculates the difference between a fast EMA and a slower EMA:
Fast EMA Length (default 6) captures short-term momentum.
Slow EMA Length (default 16) tracks broader trends.
The slope of this difference identifies accelerating or decelerating momentum.
Normalization to 0–100 Scale
The raw EMA difference is scaled relative to the recent Alpha Period range (default 6 bars).
This transforms the value into a normalized oscillator ranging between 0 and 100.
A 3-period Hull Moving Average (HMA) smooths this series to reduce noise.
Overbought and Oversold Thresholds
By default:
Overbought Level: 75
Oversold Level: 25
Crossovers of these levels are used to detect potential reversals.
Adaptive Alpha Adjustment
The normalized value is transformed into an “Alpha Schaff” line, dynamically shifting between price and normalized cycles.
This helps the model adjust to different volatility regimes.
Trend Reversal Logic
Bullish Reversal:
Normalized oscillator crosses above the Oversold Level.
EMA difference slope is positive.
Bearish Reversal:
Normalized oscillator crosses below the Overbought Level.
EMA difference slope is negative.
Additional confirmation comes when price crosses the Alpha Schaff line in the direction of momentum.
Dynamic Confidence Visualization
The indicator calculates a trend confidence score based on the normalized separation of the EMAs.
The transparency of reversal markers dynamically adjusts:
Strong trends = more opaque signals
Weak trends = more transparent signals
🔹 How to Use
✅ Entries
Long Signal: Aqua upward label appears below a bar.
Conditions:
Bullish reversal or price crossing above Alpha Schaff
Normalized slope is rising
Short Signal: Fuchsia downward label appears above a bar.
Conditions:
Bearish reversal or price crossing below Alpha Schaff
Normalized slope is falling
✅ Trend Strength
The less transparent the signal marker, the more significant the trend.
✅ Customization
Use the inputs to fine-tune sensitivity:
Shorter EMAs: Faster signals
Longer EMAs: Smoother trends
Alpha Period: Adjusts the lookback range for normalization
🟢 Best Practices
NEC is best used in combination with other trend confirmation tools (e.g., price structure, volume, or higher timeframe EMAs).
Avoid relying on signals in extremely low-volume or choppy ranges.
⚠️ Disclaimer
This script is intended for educational purposes only and does not constitute financial advice. Trading involves substantial risk, and you should consult your financial advisor before making any investment decisions.

2 Bar Master Pattern Indicator ( MTF Inside Bars ) THE 2 BAR MASTER PATTERN IS A PRICE ACTION INDICATOR
It is based off of the master pattern concepts which explains the market moving through a 3 phase cycle.
Phase 1 - Contraction
Phase 2 - Expansion
Phase 3 - Trending
THESE 3 PHASES ARE HAPPENING ON EVERY TIME FRAME AND ON EVERY ASSET CLASS.
The first phase of the cycle is the contraction phase, this is where price goes
into contraction which is measure by a simultaneous lower high / higher low.
The contraction phase can be measured with many forms of contraction methods, such as 2 bar / 3 bar and multi bar contraction detection.
The 2 bar master pattern detects inside bars, based off 2 bar candle detection, when detected it will color the candle and a value line will project out of the center.
When it identifies an inside bar it will bring a line through the centre of the inside bar which is known as a value line, these are key levels that price can either find support or resistance on these levels, or a level when broken price can breakout and take off.
MTF FUNCTIONALITY
We have coded into the logic a Multi Time Frame function so that you can have it identify any inside bar on any time frame. 2 bar inside bars work best on higher time frames such as the 4hr and above therefore with the multi time frame functionality you can set it to a higher time frame of choice and be on a lower chart timeframe where you will take your entries off of.
SHORT ENTRY EXAMPLE
LONG ENTRY EXAMPLE
In the example above its set to the weekly chart as the time frame to detect the 2 bar master patterns, and the timeframe for entry is the 4hr time frame, this will change depending on your trading style and timeframes you like to trade on.
2 BAR MASTER PATTERNS CAN BE USED FOR REVERSALS AND CONTINUATION TRADING.
CONTINUATION INSIDE BAR TRADING
When you have a inside bar formed on a higher time frame, you mark the high and low of the inside bar, and depending on the direction of the trend - if on a up trend and it breaks the high of the inside bar is an long entry - and if its on a downtrend and the low of the inside bar is broken thats the set up for a short entry.
REVERSAL INSIDE BAR TRADING
When you have an inside bar forming at the bottom or top of a range or key level, this can be a sign of weakness and a potential area where price will reverse in the opposite direction.
2 BAR MASTER PATTERN INSIDE BARS EITHER SHOW STRENGHTH OR WEAKNESS OF A TREND
If combined in combination with the higher time frame trend direction and the master patten concepts principles, you can find amazing entries.
Best place to look for long entries on a confirmed uptrend is when price is under the value lines
Best place to look for short entries on a confirmed downtrend is when price is above the value lines
Once you understand that the market is moving in this 3 phase cycle and become adept and identifying the 1st phase which is the contraction phase, it can open the door to a new way of percieving the market and making sense of the seemingly randomness of how it moves.

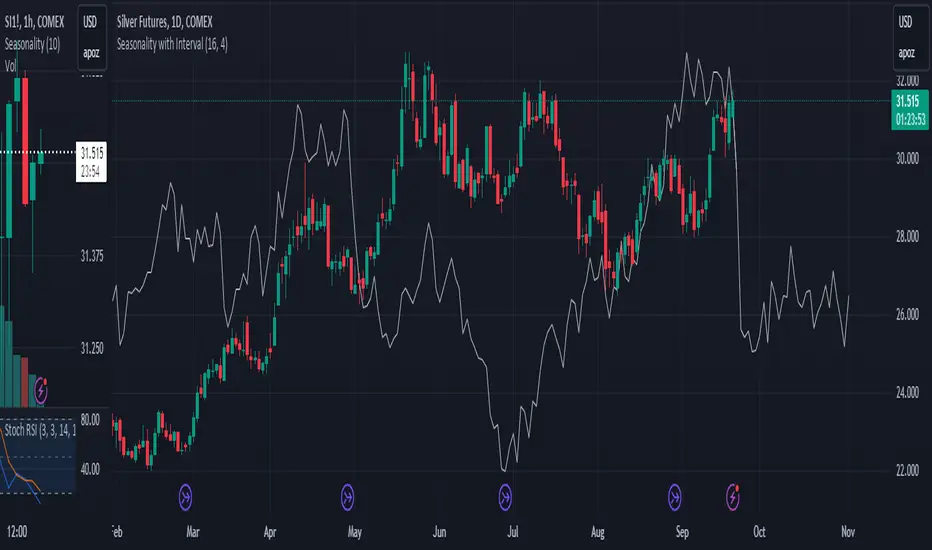
Seasonality with Custom IntervalSeasonality with Custom Interval Lookback
by TradersPod
Description:
This script is a modified version of Kaschko's original Seasonal Trend with Interval Lookback indicator, designed to help traders analyze seasonal trends over customizable intervals. The modifications in this version provide enhanced flexibility and improved visualization, making it a valuable tool for analyzing seasonal patterns in various markets.
Key Features:
1. Custom Lookback Multiplier: The script allows users to adjust the lookback period with a multiplier, giving more control over the number of years analyzed for seasonality. This feature is especially useful for traders looking to tailor the analysis based on different market cycles or election cycles.
2. Enhanced Visualization: Users can customize the color and line width of the plotted seasonality line for better readability. The smoothing parameter has been added to allow for flexible moving averages, reducing noise in the trend visualization.
3 Detailed Chart Plotting: The script plots the trading week of the year (TWOY), trading day of the month (TDOM), and trading day of the year (TDOY) on the status line, providing users with additional insights into how seasonal trends affect price movements.
How to Use:
1. Lookback Period: Set the number of years to look back. For example, if you set it to 16 years, the script will gather data from the last 16 years.
2. Interval Years: You can set an interval (e.g., 4 years for U.S. elections) to focus on specific years:
Interval = 0: This setting will use all years within the lookback period.
Interval > 0: This setting will use only every nth year, based on the interval you set (e.g., 4 for U.S. elections, 10 for decennial years).
3 Future Projections: You can specify how many bars into the future the script should project the seasonal trend.
Example Settings:
>Lookback Period: 16 years.
>Interval: 4 years (this would focus on U.S. election years).
>]Future Projections: 30 bars (the seasonal trend is projected 30 bars into the future).
Intended Use : This indicator is ideal for traders who:
>Want to analyze how market prices react to seasonal cycles.
>Need flexible, customizable tools for tracking longer-term trends.
>Prefer visual clarity in their seasonal trend analysis with adjustable settings for better readability.
How It Works:
>The script calculates the average price change for each trading day, week, or month, using a lookback period of up to 30 years. It then smooths the seasonal trend using a customizable moving average and projects the trend into the future, allowing users to forecast potential price movements based on historical seasonal patterns.
>The script also offers a projection of future seasonality by plotting the seasonal trend up to 252 bars into the future, with options to offset the start of the seasonality.
Notes:
>This script is open-source under the Mozilla Public License 2.0.
>Original script by Kaschko. Modifications by TradersPod.
[Excalibur][Pandora][Mosaic] Ultra Spectrum Analyzer@veryfid, you will always be remembered eternally...
ANCIENT MYTHOS AND LORE:
The retellings of "Pandora's Box" serve as a cautionary metaphor depicting an opened container (pithos - jar) that once held profound perils and evils — sufferings that are experienced around the world in various forms. The known and vague mythical box contents actually represent manifestation of evils, situational adversities, and human disparities that have been encountered throughout life for aeons. In contemporary times, a meager list of ordeals would include incidents of deceit, betrayal, corruption, oppression, greed, envy, depravity, conflict, mania, affliction, plague, and mortality. However, as the tale is told, kept and remaining inside the box was the essence of expectant hope (elpis), which may represent the optimism and resilience to overcome immense hardships.
There are other versions of the classic story where Pandora isn't actually the culprit, being her husband Epimetheus was the lid lifting perpetrator and the one who always and actually received the gift(s). Curiously, the interpreted Greek word ‘Pandora’ translated to English, can mean either "all-endowed" or "all-gifting". Much like Pandora herself, who was formed from clay of the earth, the jar also would have been most likely crafted from clay. Conceived as a made-to-order maiden for an arranged marriage, Pandora was given qualities of exquisite beauty, persuasive charm, all while being adorned with jewelry and fine clothing. Olympian premeditated preparations in the didactic fable of 'Works and Days' by Hesiod had blamable intent and would be later used for centuries as denigration of women/mothers. The rest of Hesiod's tale is even worse.
In reality, the entire contrived exploit of incarnating Pandora as a trojan temptress was solely intended as an instrument of infiltration and entrapment for delivery to Epimetheus as an arranged seductive snare. Being a man myself, I find it appalling how the antiquated writings of ancient morphological men have repeatedly ostracized women for many of the ailments of mankind. When in truth, it is far more often that despicable men are the recorded all time winning historical harbingers of global abysmal darkness by means of ideological treachery. Vast historical chronicles since antiquity have frequently recorded who the typical real-world villains truly are and are not. As the stories are told in the first place, it was dictator Zeus along with his Olympian conspirators, who intently implanted malicious spirits into a gifted receptacle to orchestrate planetary suffering and carnage on humankind.
PROLOGUE:
I believe, it is way past overdue to restore Pandora's name to a place of better standing. As I have been peaking into a theoretical pitcher of mathematic mysteria for years now, where no one else dares to look. Once upon a time, I pondered an opposite notion: What if Pandora was originally conceived to solve global problems instead of creating them? Maybe Pandora could have been wielded into existence to wage unrelenting and avenging retribution on every dominance hierarchy and each diabolical enemy intently hostile to humankind. My hypothetical version of Pandora would take the notion of "mors omnibus tyrannis" to a whole other fearsome magnitude. She would cause evil arrogant men to tremble with sheer horror... the kind of fear ALL false gods, despotic kings, tyrannical dictators, controligarchies, and criminal syndicates truly worry about at night. In my opinion, that would be a better fictional story worthy of retelling for aeons.
One unique goliath 21st century adversary is LAG and it must be subdued or minimized. This unyielding nemesis is also known as group delay, processing delay, and algorithmic latency. My eyes are locked onto this opponent with fixation that will never surrender a staring contest. The formidable creature lag is my daily arch enemy destined for defeat in battle. It's losing time after time and bar by bar during the past year of 2023. In my attempts to peer through the murky darkness of useless and deceptive information, I am confident that I have found more suitable answers to many current dilemmas of algorithmic lag.
The internet, using mathematics and the speed of light as a planetary beneficial advantage, has already performed wonders by drastically reducing the delay of dissemination of knowledge. This has garnered a mostly positive rapid acceleration of economic evolution. However, hierarchies of dark forces of chaos and subversion by the thousands lurking in the global shadows are not thrilled about well informed populations. In the present era, new spectrums of strife within planetary societies are being waged, one of the worst forms taking the hideous form of censorship. Other nefarious tactics are hindering economic progress with substantial negativity using heavily funded penetration and infiltration operations. Those sinister operational varieties are spanning psychological, cultural, educational, digital, financial, electoral, scientific, medical, biological, commercial, infrastructural, institutional, and organizational domains.
They are mistakenly meddling with the entire primordial order of planetary natural dynamics. The miscalculations from these malevolent CAUSES will be countered with EFFECTS of immense retaliatory primal veracity having equal or exceedingly more powerful opposition with overwhelming numbers in mass. It is a law embedded within the universe that supersedes ALL laws, known as 'causality'. Everyone, especially programmers, know exactly what to do with predatory infiltrating cockroaches... When tyranny becomes enforced law by agendized policies in any land, order = abs(DUTY) * pow(RIGHT) * exp(PEOPLE).
FUTURE ECONOMIC ADVERSARIAL CHALLENGES:
Just as programmers have to critically analyze our code for BUGS, a scrutinized analysis of the current world around us is at times necessary. It is an empirical statistical fact that a few percent of captains at the helm of industry, commerce, institutes, and governance are monetarily psychopathic. They are often hidden bugs operating within national systems. The subsequent economic consequences result in effects that aren't always clearly obvious to all. Here are a few global economic security issues...
Corrupted immoral code in national operation is an inevitable breakdown waiting to happen. In the harsh future to follow, old degenerate interdependent control systems will need to be dismantled and discarded, eventually succeeded by having resilient parallel arrangements with robust independent fidelity. The coming successive paradigm shifts would include future hardware and the hefty novel algorithms that will run on them afterwards. Evolution is inevitable! The internet must be upgraded and continually programmed securely to the near hardness of diamonds at multiple layers within the operational code to retain peaceful global integrity between international collaborations.
DigitalID is never going to fix an insecure vulnerable titanic network of devices full of holes taking in megatons of water from every direction. Weaponized digital mucking ID dead on arrival is certainly NOT a one size fits all solution and it still doesn't do diddly-squat to secure the internet's DNA as executable code. DigID's real purpose is to manage servitude digitally and keep citizens right where they want them, as subservient slaves.
There is a very specific reason why we have key chain rings in OUR pockets with numerous private keys evolving technologically over time to robustly safeguard individual locks we use every day, duh. AI becoming an artificial sentient hyper intelligence may sooner or later become a potential hazard, especially if it breaks AES192 into a thousand shards of glass. Perilous aspects from artilects will emerge and are coming swiftly. AI is already being weaponized and tasked to mind muzzle expressions of human consciousness.
Also, EMPs from the sun ARE an imminent planetary threat, and no amount of carbon taxation schemes inciting anthropomorphic climate hysteria originating from falsified modeling hocus-pocus is going to protect against extreme solar cycle related X-class phenomena. Our solar system candle called the sun, is not consistently energy irradiation stable if you just glance at SOHO images/video. There are very obvious cyclical frequencies within the dynamics of the sun's energetic activity that affect planets far beyond earth. The earth already has a built-in natural thermometer indicating that oceans have been rising very linearly for thousands of years since the last ice age, submerging entire ancient cities under coastal water dozens of meters.
BEAR with me and pardon my French translation, but I have the option to call major league climate BULLshite. There is no hardcore "anthropomorphic climate crisis" proof. It is a crisis in failed modeling that is insufficient to properly estimate colossal computations with dircet limited empirical data with enough accuracy to anticipate higly probable future outcomes. People deserve solid science instead of slanderous smackdowns and slighted statistics. 400ppm of atmospheric CO2 is nothing compared to previously existing 1600ppm concentrations acquired from ancient indirect historical observations at a time when early humans were hunter gatherers driving gas guzzlers.
Western climate-monger fortune tellers are scamming every nation on earth, betraying the collective human species worldwide by climate hype strangulation. Wait until the sheeple with dinner forks turn on the rabid wolves in shepherds's clothing; it has already begun. What these predatory profiteering fraudsters are not telling you is WATER (H2O) in earth's atmosphere is the all time dominating and potent greenhouse gas, always has been, not CO2. Dr. Willie Soon has explained it in the best of ways with clarity. Misleaders, banksterCorpses, and mediaPresstitutes are immensely involved in this hot model scheme and like keeping people right where they want them, force fed with mental filth with regularly scheduled socially engineered programming.
Beware of agendas and isms. The ESGovernanceAgenda is ready made economic coffin nails. I'll explain this very simply, a future green war on carbon is a silent war on carbon lifeforms and economies. Many of the smiling faces you can actually see on the world stage pulling levers are often the coldest blooded deceivers beyond anything you can ever imagine. In truth, corporate agents and policies are the greatest devastators to ecologies, while in concert, they are incessantly waging blame campaign agendas with subversive narratives by targeting consumers as the wrongdoers.
Why am I mentioning all these adversarial difficulties? Well, the intertangling myriads of tomorrow's "bundle of burdens" in a future box ALL have to be thoroughly analyzed, sifted through, and dealt with tenaciously now and in the future by generations to come in every nation state. Some days I wonder if Hesiod's fiction was taken from reality over 2000 years ago to WARN future world inhabitants. In the scope of economics, the series of incidents that have or will lead up to major world events, will need to have the frequency of related occurrences examined that lead up to crucial points in time historically. In order to prevent future disparities, our progeny will look backwards into history with ultra clarity and vigilance to see how corrupted society once was by hordes of overlords twisted by obsessive delusions of absolute power over the entire human species. There is no human race, only diverse genetic multiformity expressed from the DNA code of humankind exists.
We can't simply put the lid back on low entropy hydroCarbons and a broadband globalNet without having an implemented proven replacement or upgrade. It's far too late, leaving only wiser security chess moves forward as the only viable options. Nikola Tesla was dreaming of this daily in order to build every foundation of modern civilization that we now enjoy today and take for granted. Humanity still has to evolve by unlocking hidden secrets of mother nature. For instance, nations powered by endless geothermal electricity and deuterium fusion WILL solve a lot of the world's problems. Imagine our world dominantly powered by extreme abundant amounts of heavy water... Lady destiny awaits and begs for the future to be built securely, by eventual abandonment of antiquated wheelworks that eventually deserve to be hurled into the annihilatory dustbin of history.
SPECTRAL BURDENS:
Ephemeral 'spectral contents' are extremely difficult to decipher with the least amount of lag, especially while they reside within a noise ridden non-stationary environment. When 'lifting the lid off' of series analysis to peek with quick discernment, distinguishing between real-time relevant signals differing from intertwining undesirable randomness in a crowded information space, requires special kinds of intricate extraction. Due to the nature of fractal chaos, any novel spectral method is better than the scanty few we have now. Firstly, let's comprehend agilities of interpreting a spectrum's structure...
SPECTRAL ANALYSIS PURPOSE AND INTENTION:
Frequency Analysis - Spectral analysis serves a crucial purpose in unraveling the frequency composition of a signal. Its primary intention is to explore the intricacies of a dataset by identifying dominant frequencies and unveiling inherent cyclical patterns. This foundational understanding forms the basis for improving analyses.
Power Spectrum Visualization - The visualization of a signal's power spectrum is a key objective in spectral analysis. By portraying how power is distributed across different frequencies, the goal is to provide a visual representation of the signal's energy landscape. This insight aids with grasping the significance of various frequency components obtained from a larger whole.
Signal Characteristics - Understanding the traits of a signal is another vital goal. Spectral analysis seeks to characterize the nature of the signal, unveiling its periodicity, trends, or irregularities. This knowledge is instrumental in deciphering the behavior of the signal over time, fostering a deeper comprehension.
Algorithmic Adaptation - Spectral analyzer estimation can play a pivotal role in algorithmic development. By assisting with the creation of algorithms sensitive to specific frequency ranges, one possible advantage is to enable real-time adaptability. This adaptability approach may allow algorithms to respond dynamically to variations in different spectral components, potentially enhancing their efficacy.
Market Analysis - In the realm of trading systems and financial markets, spectral analysis methods can serve as applicable functions when studying market dynamics. By 'uncovering' trends, cycles, and anomalies within financial instruments, this analytical proficiency can aid traders and algorithm developers with making better informed decisions based on the spectral attributes of market data.
Noise/Interference Detection - Another purpose of spectral analysis is to identify and scrutinize undesirable elements within a signal, such as noise or interference. One benefit would be to facilitate the development of strategies to mitigate or eliminate these unwanted components, ultimately refining the quality of a given signal with filtration.
INTRODUCTION:
Allow me to introduce Pandora! What you see in the demonstration above, I've named it "Pandora Periodogram", which is also referred to as 'Ultra Spectrum Analyzer' (USA) for technical minds. Firstly, this is NOT technically speaking an indicator like most others. I would describe it as an avant-garde cycle period detector obtaining accurate spectral estimates on market data with Pine Script v5.0. USA is a spectral analysis cryptid that I can only describe as being an alien saber in nature. It is my rendering of spectral wrath unleashed. With time and history to come, my HOPE is this instrument will reveal Excalibur like aspects capable of slicing up a spectrum craftily, traits long thought to be a mythical enigma.
It is not modified forms of either Autocorrelation Periodogram (ACP) or MESA. Pandora's Periodogram embodies an entirely distinct design, adorned with glamourous color, by incorporating several of my most profound, highly refined technological innovations that I have poetically composed into being. What I have forged in Pine, has essentially manifested as a zero lag spectrum analyzer. Pandora easily peeks inside a single signal source more effectively to inspect for hidden spectres, revealing invisible apparitions inside data with improved clarity...
My 'Ultra Spectrum Analyzer' bears an eerie likeness to Autocorrelation Periodogram, but it possesses no autocorrelation and the other small hindrances of ACP that I formerly encountered. While ACP does have a few shortcomings, a few bars of lag, and high frequency bias, it is still phenomenal code. ACP is one answer to spectral enigmas, but not the only one. Developers can utilize this detector by creating scripts that employ a "Dominant Cycle Source" input to adaptively govern algorithms. If you are capable of building suitable algorithms for direct tethering to Autocorrelation Periodogram, then this is your next step in evolutionary application to tether to when you are ready. ACP is a good place to start building upon as an exploratory vessel, before you might ponder using USA. Once you do obtain dynamic ACP sweetness with only a few pesky bars of dominant cycle induced lag, USA may be your tool chest choice without the burden of subtle ACP lag.
USA is possibly the end of my quest for spectral bliss, for the time being. However, I still suspect there is more room for upgrades to Pandora in the future. I must mention, as an overture, this won't be the last of Pandora tech that you will witness, as my literal "out of the box thinking" will unleash many additional creations upon this Earth. The "Power of Pine" merely serves as the beginning foundational phase... Some of my futuristic dreams and daydreams of TradingView are droplets in a wavy ocean of economic providence and potential.
What I am crafting in poetic form is born out of raw curiosity. Future creations are probably best kept private for now, but I will present my future tech with beauty and elegance as it should rightfully be. There's one catch, I have absolutely no idea what this and my future marvels may do to the future of digital signal processing (DSP) and markets. I do fear any insane AI or MALEficent entity ever seeing this code. My innermost hopes and ambitions are always focused on achieving the best result obtainable. What the future can hold, may be absolutely exquisite to gaze upon, maybe even monstrous, or possibly a combination of both.
Notice: Unfortunately, I will not provide any integration support into member's projects at all. My own projects demand too much of my day to day time. I hope you understand. Meanwhile, I'll be applying this on future indication until Mr. Mortality sneaks up behind me.
FEATURES AND CHARACTERISTICS:
I have included as much ultra adjustability as I can humanly muster. Those features being the following and more...
Color Preferences - Four vivid color schemes are available in the original release. The "Ultra Violet" color scheme, in particular, contributes to the indicator's technical title, as it seems to me to reveal the greatest detail of my various spectral color schemes. Color inversion of the four color schemes is also possible, yielding eight schemes in total with predator style visuals. Heatmap transparency control is also provided.
Lag Control - Pandora achieves zero lag spectral approximations, with the added capability to control lag using an input for selectable delay. Note, however, that testing less than zero lag has not been assessed thoroughly due to potential unforeseen instability concerns. Adjustments are provided in either direction for further testing.
Spectral Bias Mitigation - Options for mitigating high OR low-frequency spectral biases are present. One interesting tweak made during development was a subtle form of spectral manipulation, involving a partial reduction of frequency amplitudes influencing either the highest or lowest periodicities. This slightly reduces the impact on the upper and lower portions of the spectrogram and the dominant cycle measurement. What initially surfaced as an unexpected discovery, may now be considered worthy of experimental utility.
Adjustable Periodogram Window Size - The periodogram is adjustable for various window sizes of periodic operation. Exploration up to a periodicity of 59 is obtainable for curiosity's sake. This flexibility challenges the notion that curiosity isn't always a negative trait, contrasting with Hesiod's ancient perspective.
Dominant Cycle Filtration - Filtration of the dominant cycle is achieved with a novel smoother having reduced lag, easily surpassing SuperSmoother's performance. However, defeating lag completely on that one plot() function was elusive.
Tooltips for Control Intention - The settings commonly include handy and informative tooltips that provide information eluding to the intention behind the various controls provided.
Initialization Advantages - Initialization of USA accomplishes what Autocorrelation Periodogram (ACP) didn't. Spectral analysis begins on the earliest visible bars, starting at period 2. Users need to ensure their algorithm's integrity from period 2 upwards to beyond 40ish, establishing a viable operational range for dynamically governing those algorithms. It's notable that stochastics and correlations have a minimum operable critical period of 2, distinct from most low-pass filters that can actually achieve a period of 1 (which is the raw signal itself). Proper initialization of complex IIR filters is particularly effective, especially with smaller initialization periods.
Remaining options and features are comparable to my Enhanced Autocorrelation Periodogram in terms of comprehension, and other upgrades may be added in the future upon discovery.
PERIODOGRAM INTERPRETATION:
The periodogram heatmap renders a power spectrum of a signal visually by color, where the y-axis represents periodicity (frequencies/wavelengths) and the x-axis is delineating time. The y-axis is divided into periods, with each elevation portraying demarcation of periodicity. In this periodogram, the y-axis ranges from 4 at the very bottom to 49 (or greater) at the top, with intermediary values in between, all conveying power of the corresponding frequency component by color. The higher the position ascends on the y-axis, the longer the cycle period or lower the frequency. The x-axis of the periodogram signifies time and is partitioned into equal chart intervals, where each vertical column corresponds to the time interval when the signal was measured. Most recent values/colors are on the right side of the periodogram.
Intensity of the colors on the periodogram signify the power level of the corresponding frequency or cycle period. For example, the "Fiery Embers" color scheme is distinctly like heat intensity from any casual flame witnessed in a small fire from a lighter, match, or campfire. The most intense power exhibited would be represented by the brightest of yellow, while the lowest power would be indicated by the darkest shade of red or just black. By analyzing the pattern of colors across different periods, one may gain insights into the dominant frequency components of the signal and visually identify recurring cycles/patterns of periodicity.

Market SniperV1: Introducing Market Sniper indicator! In this indicator, you can take advantage of the following features:
- 3 ema lines, 2 which intersect to form gold and death crossings and an extra line that can be adjusted in value (particularly useful for the 200 ema)
- 2 out of 20 possible tickers that can be selected based on rank (one being the richest and the other being the weakest performing ticker, out of the rest)
- Dema and Tema clouds for tracking green bullish cycles and red bearish cycles
- Crossing labels with emojis for both gold and death crossings
- Gap percentage between each closing bar and the extra ema line, for guidance and turnaround
- Chart up and Chart down emojis to better keep track of trend, based on last 2 closed bars
- ... and much much more depending on what you want to see!! All fully customizable!

Ichimoku PourSamadi Signal [TradingFinder] KijunSen Magic Number🔵 Introduction
The Ichimoku Kinko Hyo system is one of the most comprehensive market analysis tools ever created. Developed by Goichi Hosoda, a Japanese journalist in the 1930s, its purpose was to allow traders to recognize the balance between price, time, and momentum at a single glance. (In Japanese, Ichimoku literally means “one look.”)
At the core of the system lie five key components: Tenkan-sen (Conversion Line), Kijun-sen (Baseline), Chikou Span (Lagging Line), and the two leading spans, Senkou Span A and Senkou Span B, which together form the well-known Kumo or cloud representing both temporal structure and equilibrium zones in the market.
Although Ichimoku is commonly used to identify trends and support/resistance levels, a deeper layer of time philosophy exists within it. Ichimoku was not designed solely for price analysis but equally for time analysis.
In the classical model, the numerical cycles 9, 26, 52 reflect the natural rhythm of the market originally based on the Tokyo Stock Exchange’s trading schedule in the 1930s.
These values repeat across the system’s calculations, forming the foundation of Ichimoku’s time symmetry where price and time ultimately seek equilibrium.
In recent years, modern analysts have explored new approaches to extract time-based turning points from Ichimoku’s structure. One such approach is the analysis of flat segments on the Kijun-sen and Senkou B lines.
Whenever one of these lines remains flat for a period, it signals temporary balance between buyers and sellers; when the flat breaks, the market exits equilibrium and a new cycle begins.
This indicator is built precisely upon that philosophy. Following the timing methodology introduced by M.A. Poursamadi, the focus shifts away from price signals and line crossovers toward identifying flat periods on Kijun-sen (period 52) as time anchors.
From the first candle that changes the line’s slope, the tool begins a temporal count using a fixed sequence of key numbers: 5, 9, 13, 17, 26, 35, 43, 52, 63, 72, 81, 90.
Derived from both classical Ichimoku cycles and empirical testing, these numbers mark potential timing nodes where a market wave may end, a correction may begin, or a new leg may form.
Thus, this method serves not merely as another Ichimoku tool but as a temporal metronome for market structure a way to visualize moments when the market is ready to change rhythm, often before candles reveal it.
🔵 How to Use
The Kijun Timing BoX is built entirely on Ichimoku’s concept of time analysis.
Its core idea is that within every flat segment of the Kijun-sen, the market enters a temporary balance between opposing forces.
When that flat breaks, a new time cycle begins. From that first breakout candle, the indicator starts counting forward through the predefined time sequence(5, 9, 13, 17, 26, 35, 43, 52, 63, 72, 81, 90).
This counting framework creates a temporal map of market behavior, where each number represents an area where meaningful price fluctuations often occur.
A “meaningful fluctuation” does not necessarily imply reversal or continuation; rather, it marks a moment when the market’s internal energy balance shifts, typically visible as noticeable reactions on lower timeframes.
🟣 Identifying the Anchor Point
The first step is recognizing a valid flat zone on the Kijun-sen.
When this line remains flat for several candles and then changes slope, the indicator marks that bar as the Anchor, initiating the time count.
From that point onward, vertical gray lines appear at each interval in the key-number sequence, visualizing the time nodes ahead.
🟣 Reading the Timing Lines
Each numbered line represents a timing node a temporal point where a change in price rhythm is statistically more likely to occur.
At these nodes, the market may :
Enter a consolidation or minor correction phase.
Develop range-bound movement.
Or simply alter the speed and intensity of its move.
These behaviors do not imply a specific direction; they only highlight zones where time-based activity tends to cluster, giving traders a clearer view of cyclical rhythm.
🟣 Applying Time Analysis
The indicator’s primary use is to observe temporal order, not to predict price direction.
By tracking the distance between Anchors and the reactions that appear near major timing lines, traders can empirically identify each market’s characteristic rhythm—its own time DNA.
For example, one asset may consistently show significant fluctuations around the 13- and 26-bar marks,while another might react closer to 9 or 52. Recognizing such patterns helps traders understand how long typical cycles last before new phases of volatility emerge.
🟣 Combining with Other Tools
The indicator does not generate buy/sell signals on its own.
Its best use is in combination with price- or structure-based methods, to see whether meaningful price reactions occur around the same timing nodes.
In practice, it helps distinguish structured time-based fluctuations from random, noise-driven moves an insight often overlooked in conventional market analysis.
🔵 Settings
🟣 Logical Settings
KijunSen Period : Defines the baseline period used for timing analysis. Default = 52. It is the main line for detecting flats and generating time anchors.
Flat Event Filter : Controls how flat segments are validated before triggering a new timing event.
All : Every flat triggers a new Timing Box.
Automatic : Only flats longer than the historical average are used (recommended).
Custom : User manually defines the minimum flat length via Custom Count.
Update Timing Analysis BoX Per Event : If enabled, a new Timing Box is drawn each time a new flat event occurs. If disabled, the box completes its 90-bar window before refreshing.
🟣 Ichimoku Settings
TenkanSen Period : Defines the period for the Conversion Line (Tenkan-sen). Default = 9.
KijunSen Period : Sets the standard Ichimoku baseline (not the timing line). Default = 26.
Span B Period : Defines the period for Senkou Span B, the slower cloud boundary. Default = 52.
Shift Lines : Offsets cloud projection into the future. Default = 26.
🟣 Display Settings
Users can show or hide all Ichimoku lines Tenkan-sen, Kijun-sen, Chikou Span, Span A, and Span B as well as the Ichimoku Cloud.
They can also customize the color of each element to match personal chart preferences and improve visibility.
🔵 Conclusion
This analytical approach transforms Ichimoku’s time philosophy into a visual and measurable framework. A flat Kijun-sen represents a moment of market equilibrium; when its slope shifts, a new temporal cycle begins.
The purpose is not to forecast price direction but to highlight periods when meaningful fluctuations are more likely to develop.
Through this perspective, traders can observe the hidden rhythm of market time and expand their analysis beyond price into a broader time-cycle dimension.
Ultimately, the method revives Ichimoku’s original principle: the market can only be truly understood through the simultaneous harmony of price, time, and balance.

Ethereum Logarithmic Regression BandsOverview
This indicator displays logarithmic regression bands for Ethereum. Logarithmic regression is a statistical method used to model data where growth slows down over time. I initially created these bands in 2021 using a spreadsheet, and later coded them in TradingView in 2022. Over time, the bands proved effective at capturing bull market peaks and bear market lows. In 2025, I decided to share this indicator because I believe these logarithmic regression bands offer the best fit for the Ethereum chart.
How It Works
The logarithmic regression lines are fitted to the Ethereum (ETHUSD) chart using two key factors: the 'a' factor (slope) and the 'b' factor (intercept). The formula for logarithmic regression is 10^((a * ln) - b).
How to Use the Logarithmic Regression Bands
1. Lower Band:
The lower (blue) band forms a potential support area for Ethereum’s price. Historically, Ethereum has found its lows within this band during past market cycles. When the price is within the lower band, it suggests that Ethereum is undervalued.
2. Upper Band:
The upper (red) band forms a potential resistance area for Ethereum’s price. The logarithmic band is fitted to the past two market cycle peaks; therefore, there is not enough historical data to be sure it will reach the upper band again. However, the chance is certainly there! If the price is within the upper band, it indicates that Ethereum is overvalued and that a potential price correction may be imminent.

Correlated asset and Daye's Quarterly TheoryThis indicator is based on the Quarterly Theory concepts from Daye. You can find him mainly on X as traderdaye.
It works on a new panel and the quarters will be drawn over the chart of the correlated that you set on its settings.
You can use every asset to compare with the main one to make easier to find divergences between days, sessions and 90 minutes cycles.
In different timeframes, the indicator could show more or less information about quarters, but will always show the compared asset one. This is due to limitations of the candles start (for example, the Session's Q2 open won't be shown on an hourly chart because it starts after 30 minutes of candle's open).
What can this indicator do for you?
- Show the correlated asset chart.
- Show daily, session and 90 minutes cycle boxes.
- Show Midnight and every session's Q2 open.
- Make easier for the trained eye to determine if the model is AMDX or XAMD, find PO3, turtle soups, SMT divergences, etc.
Do you have any suggestion? Please, leave it on the comments. I'll try to improve this indicator regularly.
