👑Relative Strength Index Beast Mode👑 Relative Strength Index – Beast Mode
Key Features:
- Smooth, bold purple RSI line (14-period by default, fully customizable)
- Unique 8-level octave grid (0 to 100) with permanent side labels:
→ bottom (0) • strong oversold (12.5) • oversold (30)
→ middle (50) • overbought (70) • strong overbought (87.5) • top (100)
- Color-coded zones:
• Green zone = Strong buying pressure building
• Red zone = Extreme selling pressure / distribution
• Thick black midline at 50
- Extra reference lines: 80 (strong momentum), dashed 70/30 levels
- Clean, always-visible labels that stay fixed on the right side
Ideal for traders who:
- Want deeper insight than basic overbought/oversold
- Trade RSI divergence, failure swings, or hidden zones
- Love clean, professional, and informative charts
This isn’t just an RSI plot.
This is the King of RSI indicators.
Coded in Pine Script™ v6 | Super lightweight & fast | Made by KULDEEP157
Indicadores y estrategias

DAF Climax Vol「DAF Poker Model」 In trading, only two things never lie: extreme price rejection and abnormal volume expansion.
Climax Vol is designed specifically to capture key reversal points within the Dealer Action Flow (smart money / dealer behavior flow). It’s not a typical MACD or RSI — it directly monitors capital divergence.
Its working principle is simple and brutal:
When the market drops to the bottom, the candle prints a long lower wick, and suddenly the volume explodes (for example, 3× the normal level). What does this mean? It means someone is aggressively absorbing panic selling — Stopping Volume.
The same logic applies at the top.
✨ Indicator Features:
Noise rejection: Only monitors major tops and bottoms; ignores mid-trend volume spikes.
Data visualization: Displays the real-time volume multiplier directly on the candle (e.g., Vol: 2.7x), letting you instantly see the strength of smart money.
Clean interface: No flashy arrows — only candle color changes and key data. Zero chart clutter.
👉 Best for: Major cryptocurrencies like BTC / ETH
👉 Best for: Catching wicks, validating support & resistance, identifying fake breakouts
👉 Best for: Higher timeframes — 4H and 1D recommended for best accuracy
DAF Strategy Telegram Group: @daf_one
DAF Strategy Telegram Channel: @daf_signal
在交易中,只有两样东西不会骗人:价格的极致拒绝和成交量的异常放大。
Climax Vol ,专门用来抓 Dealer Action Flow(庄家行为流) 中的关键反转点。它不是普通的 MACD 或 RSI,它是直接监控资金分歧的。
它的工作原理很简单粗暴: 当市场跌到底部,K线收出长下影,同时成交量突然爆炸(比如平时的 3 倍),这意味着什么?意味着有人在恐慌盘中疯狂接货(Stopping Volume)。顶部同理。
✨ 指标特点:
拒绝噪音: 只监控阶段性顶底,半山腰的放量不看。
数据可视化: 可以在K线上直接看到当前的量能倍数(例如 Vol: 2.7x),一眼看穿主力力度。
界面清爽: 去掉了花里胡哨的箭头,只保留K线变色和关键数据,不干扰盘面。
👉 适用: 主流加密货币BTC/ETH
👉 适用: 抓针、验证支撑压力位、识别假突破。
👉 适用: 时间级别越高越有效,推荐4小时和1天K线图表。

RSI Volume Order BlocksOverview
This script builds structured order blocks using a combination of RSI pivots, price structure, and optional volume/ATR-based scaling.
It is designed to create a clean, explainable map of support/resistance levels that respond only to meaningful momentum shifts rather than small, insignificant oscillations.
Core Idea
Traditional order blocks rely solely on price highs/lows, which often produces excessive or noisy zones.
This model instead:
Detects pivot highs/lows on the RSI (controlled by RSI Length and Sensitivity).
Generates bearish order blocks from RSI pivot highs and bullish order blocks from RSI pivot lows.
Allows the user to choose whether blocks are based on candle bodies or the full candle range.
Optionally filters blocks so that:
bearish OBs form only when RSI is above an overbought threshold,
bullish OBs form only when RSI is below an oversold threshold.
The resulting zones represent areas of momentum exhaustion and imbalance rather than random price fluctuations.
Volume–ATR Height Mode
The script offers two approaches for block height:
1. Price Candle Mode
Block height equals either:
the candle body, or
the full high–low range of the pivot bar.
2. Volume–ATR Mode
Block height is adaptively scaled using:
ATR (ATR Length for Height),
relative volume compared to a baseline (Volume Baseline Length),
a global height multiplier.
This makes zones thicker when the pivot candle had both higher volatility and above-average volume, and thinner when market participation was lower.
Lifespan and Mitigation
Each block extends forward in time until price mitigates it.
Mitigation Method: Close
Bearish OB is removed when a candle closes above its top.
Bullish OB is removed when a candle closes below its bottom.
Mitigation Method: Wick
Bearish OB is removed when a wick breaks above the top.
Bullish OB is removed when a wick breaks below the bottom.
Additional controls:
Maximum number of stored OBs per side.
Maximum number of displayed OBs per side.
Overlap filtering to avoid redundant zone stacking.
Main Inputs (Summary)
RSI Length – standard RSI lookback.
RSI OB Sensitivity – pivot aggressiveness (higher = fewer, stronger pivots).
Overbought/Oversold Levels – thresholds for optional filters.
RSI Filter –
bearish OB only if RSI > overbought,
bullish OB only if RSI < oversold.
Order Block Style – candle body or full range.
Mitigation Method – close-based or wick-based.
OB Height Mode – price candle or volume–ATR scaling.
Volume Baseline Length, ATR Length for Height, Height Scale – parameters for adaptive height mode.
Show Bullish / Bearish OBs – toggles for each side.
Color settings for zone visualization.
How to Use
Typical workflows include:
Using higher-timeframe OB zones as structural support/resistance, then refining entries on lower timeframes.
Watching for price reactions inside thick Volume–ATR zones, which may indicate areas of strong participation.
Combining this tool with trend filters, volume metrics, or price action confirmation (e.g., rejection wicks or engulfing patterns).
This script does not generate automated entries/exits; it is a contextual mapping tool designed to highlight where meaningful imbalance likely originated and where reactions may occur.
Notes
Works on any symbol and timeframe available on TradingView.
Most effective when combined with disciplined risk management and a defined trading plan.
Provided for research, chart analysis, and backtesting.
Disclaimer
This tool is for educational and informational purposes only.
It does not constitute financial advice or a recommendation to buy or sell any asset.
Always perform your own analysis and manage risk appropriately.

Vegas Pro_邀請版Vegas Pro
Access Requirements To access this script, please follow these steps:
Register on MEXC using the link below.
Deposit at least 200 USDT.
Provide your email address to receive access.
Sign up link: www.mexc.com

Next Candle Probability (EB, EWMA, Regime)Purpose
This indicator provides a quantitative assist to day traders by estimating the probability that the next candle will close green or red.
It analyzes recent red/green sequences across pattern depths N = 1…7 and produces a unified probability score.
By understanding which side has statistically higher likelihood, traders can align their decision-making with dominant directional bias rather than emotion.
Methodology
Strict no-lookahead logic (no repaint, doji filtered out)
Hierarchical smoothing across depths (1 → 7) using empirical-frequency regularization
Optional exponential decay (EWMA) for adaptive weighting toward recent market behavior
Higher-timeframe EMA regime filter (trend-aligned / countertrend-blocked / off)
ALL / SELECTED scope modes with a single, consolidated decision per bar
On-chart informational tags showing raw frequency (“R”) and smoothed estimate (“E”)
Full alert support for directional probability shifts
How it helps day traders
The indicator highlights whether the next bar’s probability distribution favors the bullish or bearish side.
This supports decision-making that is aligned with:
recent statistical behavior,
trend direction,
and adaptive weighting of market conditions.
It is designed for traders who want a structured, probability-based confirmation rather than relying on subjective interpretation.
Research & Theory
This script is based on:
empirical pattern-frequency modeling,
hierarchical Bayesian-style smoothing,
and regime filtering through higher-timeframe trend structure.

Weekly & Monthly Thresholds + VIX-Based Dynamic Targets copyWeekly & Monthly Thresholds + Targets copy backup in case of issue with the previous " Weekly & Monthly Thresholds + VIX-Based Dynamic Targets "

Katik EMA BUY SELLThis strategy uses EMA 9, EMA 20, and EMA 200 to generate Buy and Sell signals.
BUY Conditions
EMA 9 crosses above EMA 20
Stoploss: Recent Swing Low
Target: EMA 9 touches or crosses EMA 200
SELL Conditions
EMA 9 crosses below EMA 20
Stoploss: Recent Swing High
Target: EMA 9 touches or crosses EMA 200
Features
Automatic Long & Short entries
Dynamic swing-based stoploss
Clear EMA plots with line width 3
Works on all timeframes

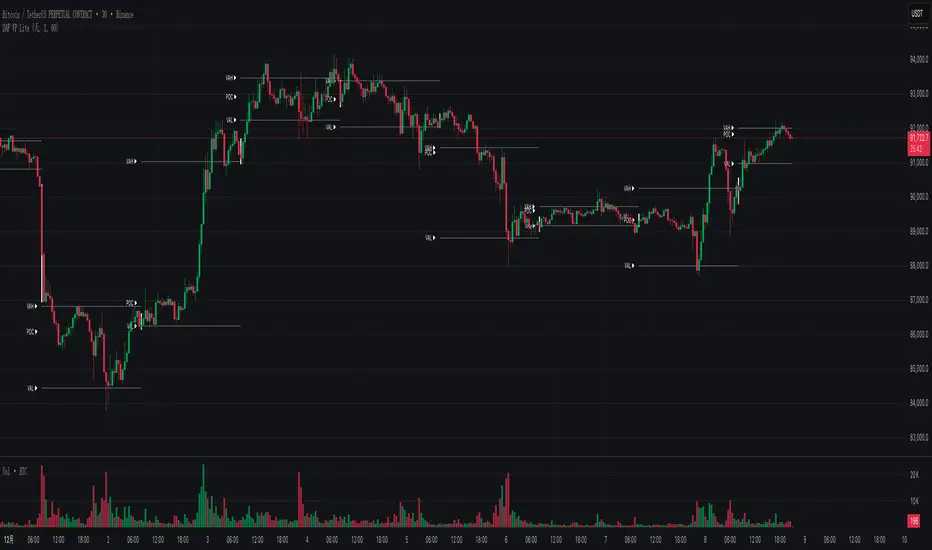
DAF VP Lite 「DAF Poker Model」🎁 Volume Profile Indicator – Provided for free by DAF Poker Model
DAF VP Lite is a lightweight volume profile indicator that helps you identify key price levels where significant trading activity occurred.
📍 Core Features:
• POC (Point of Control) – The price level with the highest volume
• VAH/VAL (Value Area High/Low) – Boundaries of 70% of total volume
• IB (Initial Balance) – Opening range reference
📊 Multi-Timeframe Support:
Day / Week / Month / Quarter / Half-Year / Year
━━━━━━━━━━━━━━━━━━━━━━━━━━━━━━━━━━━━━━━━━━━
🎁 由 DAF Poker Model 免费提供的成交量分布指标
DAF VP Lite 是一款轻量级成交量分布指标,帮助你识别主力成交密集的关键价格区域。
📍 核心功能:
• POC(成交量控制点)- 成交量最集中的价格
• VAH/VAL(价值区间)- 覆盖 70% 成交量的上下边界
• IB(初始平衡区间)- 开盘博弈区参考
📊 多周期支持:
天 / 周 / 月 / 季度 / 半年 / 年
NoProcess • PAX Opening RangeAll credit & honor goes to Matt Kenah (Pax)
PAX-OR is a high-precision, automated Opening Range indicator designed specifically for Futures Traders. Unlike standard OR indicators that require manual time inputs, PAX-OR automatically detects the asset class (Indices, Metals, Energies) and configures the correct Opening Time, Point Value, and Volatility "Rungs" without manual intervention.
It utilizes 30-second granularity to capture the exact opening wick/body mechanics, providing a distinct advantage over standard 1-minute or 5-minute calculations.
🎯 Key Features
1. Intelligent Asset Detection The indicator automatically recognizes the ticker symbol and adjusts its logic for:
Indices: ES, MES, NQ, MNQ, YM, RTY (Opens @ 9:30 AM ET)
Energies: CL, MCL, NG, QG (Opens @ 9:00 AM ET)
Metals: GC, MGC, SI, HG (Opens @ 8:20 AM ET)
2. Dynamic "Paylines" (Dollar-Based Targets) A unique feature of PAX-OR is the Payline. Instead of arbitrary ticks, you define a dollar amount (default: $200). The indicator calculates exactly how many points the market must move from the Opening Range High/Low to achieve that profit, based on the contract's point value (e.g., $50 for ES, $20 for NQ).
Use Case: Great for setting automated "Break Even" or "First Take Profit" levels.
3. Volatility "Rungs" The indicator projects fixed-interval targets (Rungs) above and below the range. These rung sizes are hardcoded to optimized values for each specific asset (e.g., 15 points for ES, 65 points for NQ) but can be overridden in the settings.
4. Overnight Context Automatically plots the Overnight High (ONH) and Overnight Low (ONL) relative to the current session, providing immediate context on whether the market is opening within or outside of the prior global session range.
5. Live Info Dashboard A clean data table in the top-right corner displays:
Current Symbol & Root
Rung Size (in points)
Payline Offset (in points)
Current Opening Range size
Dollar Value per Point
Minimum Tick Size
⚙️ How It Works
The Open: When the session begins (based on the asset class specific time), the indicator scans the first 30 seconds of data to establish the High, Low, and Open (Pit Open).
The Range: It draws the High and Low of that opening period, along with the Equilibrium (EQ/Midpoint).
The Extension:
Paylines: Dashed lines appear at the calculated dollar-target distance.
Rungs: Solid lines appear at fixed intervals to act as trend targets.
History: You can configure the indicator to show the OR levels for the current day only, or extend them for 2-3 days to see how price reacts to previous session levels.
🛠 Settings Overview
Opening Range: Toggle the visibility of the range, background shading, and the specific Pit Open price line.
Paylines & Rungs: Toggle specific lines (Short/Long) and customize colors/styles.
Config:
Payline $ Value: Set your target dollar amount (default $200).
Rung Override: Enter a custom point value if you disagree with the auto-detected volatility size.
Number of Rungs: How many levels to draw (default 15).
Extend Lines: Choose between "Current OR Only", "2 Day", "3 Day", or "All".
Note: This indicator is optimized for the assets listed above. If used on an unsupported ticker, it defaults to standard settings (9:30 Open, $50/point).
Disclaimer: Trading futures involves significant risk. This tool is for educational and technical analysis purposes only.

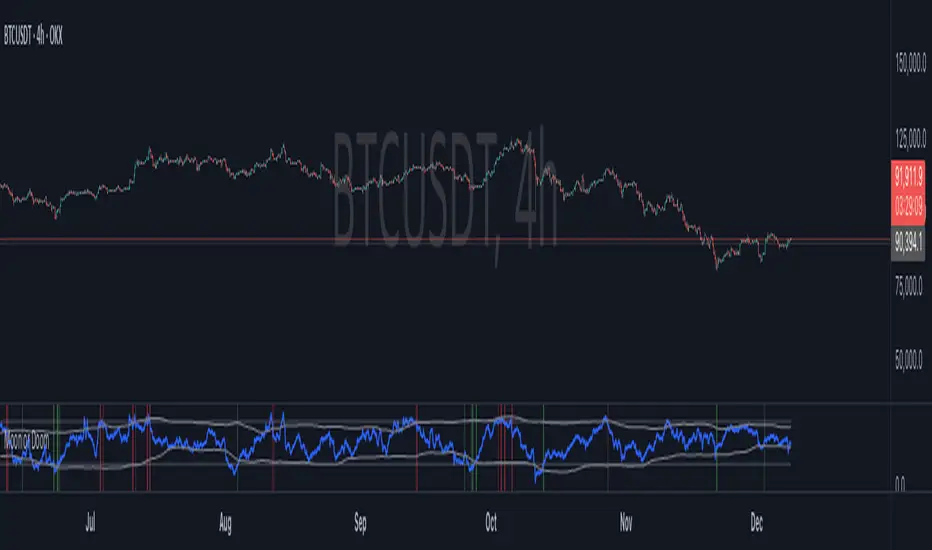
Moon or Doom — Crypto Market Sentiment IndexMoon or Doom — Crypto Market Sentiment Index
(Inspired by the classic Crypto Fear & Greed Index)
⚪ Overview
Moon or Doom indicator identifies crypto market sentiment using six normalized components: RSI, ATR volatility, price deviation, BTC dominance, open interest, and funding-rate behavior.
Each factor is standardized, weighted, and blended into a unified 0–100 score that reflects overall fear, equilibrium, or greed.
The indicator includes adjustable weights, static/dynamic thresholds, and potential reversal spot signaling with ADX filtering for higher-quality signals.
⚪ Score Components
RSI (Momentum) — default 20%
Short-term momentum input based on 14-period RSI, scaled to a 0–100 range.
ATR Volatility Z-Score (Volatility Stress) — default 15%
ATR is standardized over a 90-period Z-score to detect abnormally high volatility associated with emotional market phases.
Price vs MA Z-Score (Mean Deviation) — default 20%
Measures mean deviation from the 50-period SMA and identifies extended overbought or oversold regions.
BTC Dominance Z-Score (Risk Rotation) — default 10%
Reflects macro risk-on vs risk-off behavior through normalized BTC dominance shifts.
Open Interest Z-Score (Leverage Load) — default 20%
Reveals leverage pressure and speculative extremes by comparing OI relative to its historical volatility.
Funding Rate Normalization (Positioning Bias) — default 15%
TWAP-based normalized funding metric capturing derivative positioning bias.
⚪ Extreme Condition Detection
Static Levels
• Extreme Fear: 25
• Extreme Greed: 75
Dynamic Levels
Adaptive bands using Z-score of the sentiment series for regime-aware thresholds.
Hybrid Mode
Reversal zones activate when either static or dynamic levels are breached.
⚪ Signal Conditions
Bullish Signal
Triggered when the sentiment score exits extreme-fear territory or crosses above the ultra-low band (20).
Bearish Signal
Triggered when the score exits extreme-greed territory or crosses below an ultra-high band (80).
ADX Filter
Applied to avoid signals during low-strength market conditions.
⚪ Use Cases
• Identify fear → greed cycles
• Spot early reversal environments
• Market-wide regime detection across all timeframes
⚪ Alerts
The indicator provides three built-in alerts:
MD Bullish Spot
Triggered when the sentiment score exits an extreme fear zone or passes above an ultra-low band.
MD Bearish Spot
Triggered when the score exits extreme greed or passes below an ultra-high band.
MD Bullish/Bearish Spot
Fires for either direction — useful for automation or unified scripts.
⚪ Disclaimer
This script is for educational and informational purposes only and does not constitute financial advice or investment recommendations. Trading cryptocurrencies involves significant risk and you are solely responsible for your own investment decisions, based on your financial situation, objectives, and risk tolerance. The author assumes no liability for losses arising from the use of this indicator.
Mirpapa_Lib_LineLibrary "Mirpapa_Lib_Line"
CreateLine(_breachMode, _isBull, _leftTime, _rightTime, _price, _lineColor, _lineWidth, _lineStyle, _text)
CreateLine
@description 라인 생성 (값 전달 방식 - 모든 좌표 직접 지정).\
호출자가 모든 좌표와 시간을 계산하여 전달.\
breachMode: "price"(고가/저가 돌파) 또는 "close"(종가 돌파).\
Parameters:
_breachMode (string) : 돌파 처리 방식: "price" 또는 "close"
_isBull (bool) : 상승(true) 또는 하락(false)
_leftTime (int) : 라인 시작 시간
_rightTime (int) : 라인 종료 시간
_price (float) : 라인 가격
_lineColor (color) : 라인 색상
_lineWidth (int) : 라인 두께
_lineStyle (string) : 라인 스타일 (line.style_solid, line.style_dashed 등)
_text (string) : 라인 텍스트
Returns: 성공 여부와 라인 데이터
ProcessLineDatas(_openLines, _closedLines, _closeCount, _colorClose, _currentBarIndex, _currentLow, _currentHigh, _currentTime)
ProcessLineDatas
@description 라인 확장 및 돌파 처리.\
열린 라인들을 현재 bar까지 확장하고, 돌파 조건 체크.\
_closeCount: 돌파 횟수 (이 횟수만큼 돌파 시 라인 종료).\
breachMode에 따라 돌파 체크 방식 다름 (price/close).\
종료된 라인은 _closedLines로 이동하고 _colorClose 색상 적용.\
barstate.islast와 barstate.isconfirmed에서 호출 권장.
Parameters:
_openLines (array) : 열린 라인 배열
_closedLines (array) : 닫힌 라인 배열
_closeCount (int) : 돌파 카운트 (이 횟수만큼 돌파 시 종료)
_colorClose (color) : 종료된 라인 색상
_currentBarIndex (int) : 현재 bar_index
_currentLow (float) : 현재 low
_currentHigh (float) : 현재 high
_currentTime (int) : 현재 time
Returns: bool 항상 true
BreachMode
BreachMode
Fields:
PRICE (series string)
CLOSE (series string)
LineData
LineData
Fields:
_breachMode (series string) : 돌파 처리 방식
_isBull (series bool) : 상승(true) 또는 하락(false) 방향
_line (series line) : 라인 객체
_price (series float) : 라인 가격
_text (series string) : 라인 텍스트
_breached (series bool) : 돌파 여부
_breakCount (series int) : 돌파 카운트

AR-Volume ProfileAR-Volume Profile plots two volume profiles on your chart at the same time:
• Daily Volume Profiles (multiple days back, always visible)
• Hourly Volume Profiles (last N hours, designed for ≤ 15m timeframes)
It’s built to stay clean, readable, and performance-safe, while still letting you see where volume built up across recent structure.
________________________________________
What You See On Chart
- Daily Profiles (Multi-day) Increased using Polylines
• Shows Volume Profile histograms for the last X days back (you choose).
• Each day is drawn as a horizontal histogram inside that day’s session.
• Color logic:
o Base (all volume)
o Value Area (VA)
o POC (Point of Control)
- Daily Levels (POC / VAH / VAL)
• Adds optional horizontal levels:
o POC
o VAH
o VAL
• You can choose whether to draw these:
o Today only, or
o Past days too (if enabled in your version)
• Levels can optionally extend to the right to act like HTF references.
- Hourly Profiles (Intraday context)
• Shows profiles for the last N hours (you choose).
• Meant to be used on 15m and below for clean intraday mapping.
• Optional hourly level lines are available too.
________________________________________
How It Calculates Volume
This is a bar-based approximation of a volume profile:
• Each candle’s volume is distributed across its price range based on overlap with bins.
• Flat candles (very small range) are placed into the nearest bin.
• This gives a reliable “where volume accumulated” view without needing exchange order-by-order data.
________________________________________
Key Inputs Explained
Daily Profile (Always Visible)
• Days back to show (Daily)
How many previous daily profiles you want displayed.
• Daily bins
Higher bins = more detail (but higher object usage).
• Daily Value Area %
Default 70% like traditional VP.
• Daily profile width (% of day)
Controls how wide the histogram is inside the day.
• Daily profile side
Left or Right inside each day.
• Show Daily POC/VAH/VAL lines
Enable level lines.
• Extend Daily levels to the right
Makes daily levels act like forward HTF liquidity/targets.
Hourly Profile (15m and below)
• How many hours
Number of hourly profiles to display.
• Hourly bins
• Hourly profile width (% of hour)
• Hourly profile side
• Show Hourly POC/VAH/VAL lines
________________________________________
Best Use Cases
- Intraday trading (scalping + day trading)
- Mapping premium/discount volume build-ups
- Pairing with:
• liquidity sweeps
• order blocks
• HTF levels
• session ranges
• breaker / mitigation concepts
________________________________________
Recommended Settings (Practical)
If you want more daily history, you must balance line budget.
Example setups:
“Clean Daily Focus” (more days)
• Daily bins: 60–80
• Days back: 10–20
• Hours: 0–4 (or lower)
• Budget mode: Daily First
“Intraday Heavy” (more hourly detail)
• Hourly bins: 30–50
• Hours: 8–12
• Days back: 3–7
• Budget mode: Hourly First
________________________________________
Notes / Limitations
• Hourly profiles are designed for ≤ 15m timeframes.
• This uses approximate volume distribution from candle ranges (not exchange tick VP).
• If volume data is missing on the symbol/broker, results will be less meaningful.
• Visual output depends on instrument liquidity + chart zoom.

M20M60_win10_libLibrary "M20M60_win10_lib"
f_m20m60_win10_features(srcOpen, srcHigh, srcLow, srcClose, bandCenter, bandWidth)
Parameters:
srcOpen (float)
srcHigh (float)
srcLow (float)
srcClose (float)
bandCenter (float)
bandWidth (float)
f_m20m60_win10_is_cluster5(bodyMean, rangeMean, cBandDiff, insideRatio, maxAbove)
Parameters:
bodyMean (float)
rangeMean (float)
cBandDiff (float)
insideRatio (float)
maxAbove (float)
f_m20m60_win10_is_cluster1(bodyMean, rangeMean, cBandDiff, insideRatio, maxAbove)
Parameters:
bodyMean (float)
rangeMean (float)
cBandDiff (float)
insideRatio (float)
maxAbove (float)
AR-LiquidityAR-Liquidity is a clean, “chart-first” liquidity mapping tool built to automatically identify and maintain Buy-Side Liquidity (BSL) and Sell-Side Liquidity (SSL) levels, classify them as IRL / ERL using a dealing range filter, and mark sweeps/raids with an optional raid zone box—while keeping drawings stable using a fixed object bank (no random disappearing lines).
________________________________________
What it detects
1) BSL & SSL (Liquidity Pools)
• BSL (Buy-Side Liquidity): swing highs clustered into meaningful levels (areas where stops tend to rest above price).
• SSL (Sell-Side Liquidity): swing lows clustered into meaningful levels (areas where stops tend to rest below price).
Instead of plotting every single pivot, the script clusters nearby pivots using an ATR-based margin so you get clean, actionable liquidity levels, not noise.
2) IRL / ERL (Dealing Range Context)
Each liquidity level is labeled as:
• IRL (Internal Range Liquidity): inside the dealing range
• ERL (External Range Liquidity): outside the dealing range
By default, the dealing range uses:
• PDH / PDL (Previous Day High / Previous Day Low) as the IRL boundaries.
This helps you instantly understand whether a level is “internal” (often targeted during consolidation/mean reversion) or “external” (often targeted during expansion/displacement).
3) Sweeps / Raids (Liquidity Taken)
A sweep is flagged when price:
• Wicks through a confirmed level
• Then closes back inside (classic raid behavior)
The script marks swept levels with a ✓ check mark in the label.
Optionally, it can draw a raid zone box showing the wick-extreme to the level.
________________________________________
How it draws (stable & clean)
This indicator uses banked objects for lines/labels/boxes. That means:
• No flickering
• No unstable rendering
• No “objects disappearing” when new levels are created
Lines will extend to the right, and can be configured to stop when invalidated (depending on your build/settings).
________________________________________
Inputs (what each one actually means)
Detection
• Swing length (pivot L=R): controls pivot sensitivity (higher = fewer, stronger swings).
• ATR length: ATR basis for clustering margin.
• Cluster margin × ATR: how close pivots must be to merge into one liquidity level.
• Min touches to confirm: how many pivot touches are required before a level is considered valid.
• Max clusters to scan (perf): performance cap for how many stored levels the script checks.
Show / Filters
• Mode (Present/Historical):
o Present focuses on most relevant/active levels.
o Historical can show deeper history depending on your scan/visibility limits.
• Max visible levels per side: maximum number of BSL lines + SSL lines drawn at once.
• Extend levels right: keeps levels projected forward.
• Only above / only below: filter BSL above price and SSL below price (cleaner “current context” view).
• Hide swept levels: removes already-raided levels from view (if you want only “untouched” liquidity).
IRL / ERL (Dealing Range)
• Use PDH/PDL as dealing range: defines IRL boundaries using previous day high/low.
• Show PDH/PDL lines: plots those boundaries as dotted reference lines.
Sweeps / Raid Zones
• Mark sweeps: enables raid detection + check mark labeling.
• Show raid zone box: displays a box from level to wick extreme.
• Raid box extend (bars): how far the box projects to the right.
Style
Full control over:
• IRL vs ERL colors for BSL/SSL
• Line width
• Label size
• Raid box colors
________________________________________
How to use it (practical)
• Use BSL above price as likely upside draw / where liquidity may be taken.
• Use SSL below price as likely downside draw / where liquidity may be taken.
• Use IRL/ERL to decide whether the market is targeting internals (range) or externals (expansion).
• Use the ✓ sweep mark to identify “liquidity already taken” vs “still resting.”
• Pair it with structure (MSS/BOS), sessions, and displacement to time entries after raids.
________________________________________
Pro tips
• If you want more lines, increase:
o Max visible levels per side
o Max clusters to scan (perf)
• If the chart is too busy, increase:
o Swing length
o Min touches
o Or reduce Max visible levels per side

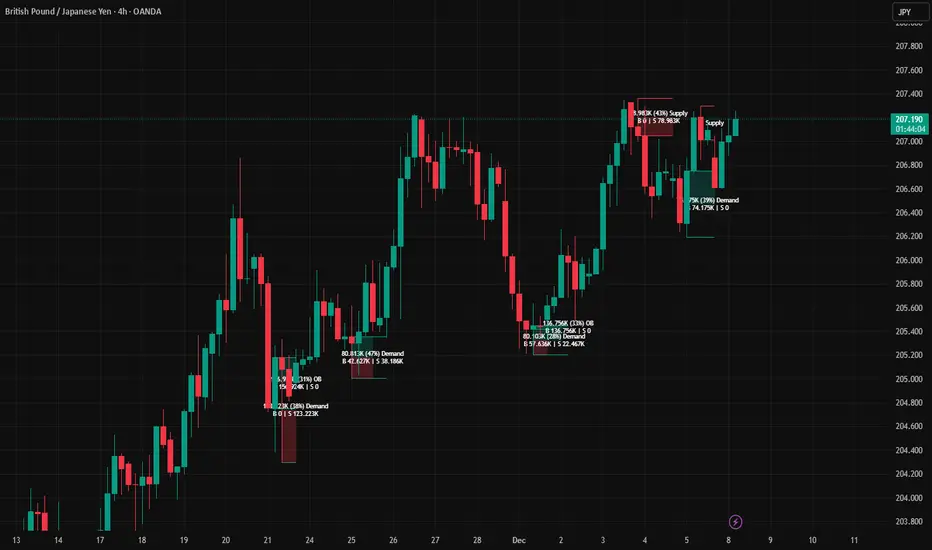
AR–Volumized Blocks & S&DAR–Volumized Blocks & S&D is a clean, price-action order-block tool that automatically detects Bullish & Bearish Order Blocks (OB), tracks their evolving state into Mitigation Blocks (MB) and Breaker Blocks (BB), and adds a volumetric overlay showing an estimated split between buyers vs sellers inside each zone. It also includes a lightweight Supply & Demand (S&D) module with the same buy/sell visualization.
This indicator is designed to keep the chart readable: zones are drawn with thin boundaries, optional breaker fill, short reference lines, centered labels, and shortened volumetric bars (instead of huge full-width blocks).
________________________________________
What it draws
1) Order Blocks with State Tracking
Each detected Order Block is shown with:
• Top/Bottom boundaries (thin lines)
• A zone container (mostly invisible for OB/MB, semi-filled for BB)
• A label that updates live with:
o Total zone volume
o Volumetric balance %
o Current state: OB / MB / BB
o Optional extra line: Buy vs Sell estimate
States
• OB (Order Block): Newly detected zone, still valid.
• MB (Mitigation Block): Zone has been touched by price (mitigated) but not broken.
• BB (Breaker Block): Zone has been invalidated (broken through) and becomes a breaker.
Optional BB cleanup
• “Hide invalidated BB” can auto-remove breaker blocks that become invalid again (to keep the chart clean and only show active breakers).
________________________________________
2) Supply & Demand Zones
Supply & Demand zones are detected using pivot logic:
• Supply: pivot highs → zone from pivot high down to pivot candle body area
• Demand: pivot lows → zone from pivot low up to pivot candle body area
They are drawn as:
• A zone holder + thin lines
• A label (“Supply” / “Demand”), with optional volumetric text
• Optional buy/sell volumetric bars, same style as OB/BB/MB
S&D zones are removed completely once broken (clean and decisive behavior).
________________________________________
Volumetric Buy/Sell (the mini bars + text)
This script adds an extra layer called Volumetric (Buy/Sell):
-Volumetric Bars (short + clean)
Inside each zone, it can draw two small stacked bars:
• Top half: Buy volume (green)
• Bottom half: Sell volume (red)
You can choose:
• Display side (Left or Right of the zone)
• Bar length in bars (shortened by design)
• Transparency
-Volumetric Text (buyers vs sellers)
The label can optionally show:
• B 123K | S 98K
So you instantly see who dominated in that block.
Important Note (Very Honest)
These buy/sell numbers are NOT real bid/ask delta.
They are an estimate based on candle direction:
• If a candle closes green (close ≥ open) → its volume is counted as “buy”
• If it closes red (close < open) → its volume is counted as “sell”
This is still extremely useful for visual confirmation, but it is not a broker-level footprint.
________________________________________
Detection Logic Summary (simple + effective)
Order Block detection (swing-based)
• Uses a swing finder to identify relevant turning points.
• Confirms OB creation on a breakout beyond the swing level.
• Builds the OB range by walking backward to capture the strongest base candle area.
• Filters out oversized zones using ATR × Max OB height filter.
Zone lifetime handling
• Zones extend forward automatically.
• OB becomes MB on first meaningful touch.
• OB becomes BB if violated in the opposite direction.
• BB can optionally be hidden if it becomes invalid (depending on your settings).
________________________________________
Inputs & Customization
Detection
• Swing length (OB): controls sensitivity. Lower = more zones, higher = fewer stronger zones.
• Use candle body for extremes: reduces wick noise by using candle bodies for boundaries.
• ATR filter: avoids huge messy blocks (keeps zones tradable).
• Max zones to keep: keeps chart lightweight.
Visual
• Bull/Bear colors
• Label size
• Forward extension
• Short line length
• Label offset
Supply & Demand
• Enable/disable S&D
• Pivot swing length
• Forward extension, line length
• Label offset X and Y (ticks)
• Max S&D zones
Volumetric Buy/Sell
• Turn bars on/off
• Turn text on/off
• Bars side (left/right)
• Bar length (short, by bars)
• Bar transparency
________________________________________
How to use (practical workflow)
For Entries
• Use Bullish OB / Demand as a potential buy zone after a displacement up.
• Use Bearish OB / Supply as a potential sell zone after a displacement down.
• Look for confluence:
o market structure shift / BOS + displacement candle + return to OB/MB
For Bias Filtering
• The buy/sell split helps you quickly sanity-check:
o A “bullish OB” that shows heavy sell dominance might be weaker (and vice versa)
o Strong imbalance zones often show a clear dominance split
For Risk Management
• BB zones are great “line in the sand” areas.
• Use zone boundaries for invalidation, with your own model rules.
________________________________________
Performance Notes
This script is built with object limits in mind and includes:
• max_boxes_count, max_lines_count, max_labels_count
• Cleanup logic when max zones are exceeded
• Optional hiding of invalid breakers to reduce clutter
________________________________________
Disclaimer
This tool provides technical visualization and estimated volumetric info based on candle direction. It does not represent true order flow, bid/ask delta, or broker tape. Always risk-manage properly and confirm with your trading plan.
AR–CISD-Market Shift-FVGAR–CISD-Market Shift-FVG is a precision price-action indicator that combines three core ideas in one tool:
• Shift → market structure breaks (internal + major) using a wick→body confirmation model.
• CISD → Change in State of Delivery, where one-sided orderflow is decisively wiped out.
• FVG → cleaned-up, ATR-filtered Fair Value Gaps that only highlight meaningful imbalances.
It’s built to give you structure, delivery and imbalance on a single chart without turning everything into spaghetti.
________________________________________
What it plots
1. Shift (structure breaks)
• Detects both internal and major structural breaks from user-defined pivots.
• Uses a wick→body close (no zigzags, no candle-by-candle stepping).
• Optional displacement gating (ATR-aware): the break candle must have
o a minimum body size vs ATR,
o decent body/range ratio,
o close near the bar’s extreme,
o and close beyond the broken level by a fraction of ATR.
• Internal and major breaks that occur at (almost) the same price are merged into a single “Shift” line, so you see one clean level instead of two overlapping labels.
2. CISD (Change in State of Delivery)
• Looks for a run of one-sided candles (e.g. a series of reds) that is taken out by the opposite side.
• Uses strict validation to avoid random noise:
o Opposite run must be longer / more meaningful than the wipe run (Opp ÷ Cur ratio).
o Wipe bar must show real displacement (body vs ATR + body/range).
o Opposite run must span a minimum price range vs ATR and contain at least one non-doji candle.
o Optional EMA baseline and de-dup (time + ATR-scaled price radius) to prevent spam.
• When valid, it draws a wick→body horizontal line with inline CISD text, rendered as
---- CISD ---- in bull or bear color.
3. FVG (Fair Value Gaps)
• Detects 3-bar FVGs only when the gap exceeds a minimum ATR-scaled size, so tiny micro-gaps are ignored.
• Boxes project forward for N bars and are automatically removed on fill.
• Labels are small and slightly dim, so they support structure/CISD rather than overpower them.
(If you enabled it in the inputs, you’ll also see optional VI (Volume Imbalance) hints as tiny horizontal tags when a body gap clears the prior body band with elevated volume.)
________________________________________
Inputs & usage tips
• Shift block – control pivot sensitivity (L/R & Li/Ri), displacement rules, equality tolerance, and whether to extend lines right.
• CISD block – adjust min opposite bars, max wipers, strict filters (ATR, body/range, range vs ATR), EMA context, and de-dup radius.
• FVG block – set the minimum FVG size (×ATR), right extension, how many to track, and label style.
• If you see too many lines, first tighten CISD strictness and Shift displacement, or increase pivot lengths, before touching anything else.
• On your execution timeframe, look for Shift + CISD + FVG lining up in the same leg or zone – that’s where the indicator is telling a strong, consistent story about structure, delivery, and imbalance.
________________________________________
Disclaimer
For educational and chart-marking purposes only. Not financial advice. Always forward-test and adapt parameters to your instrument, timeframe, and personal risk tolerance.

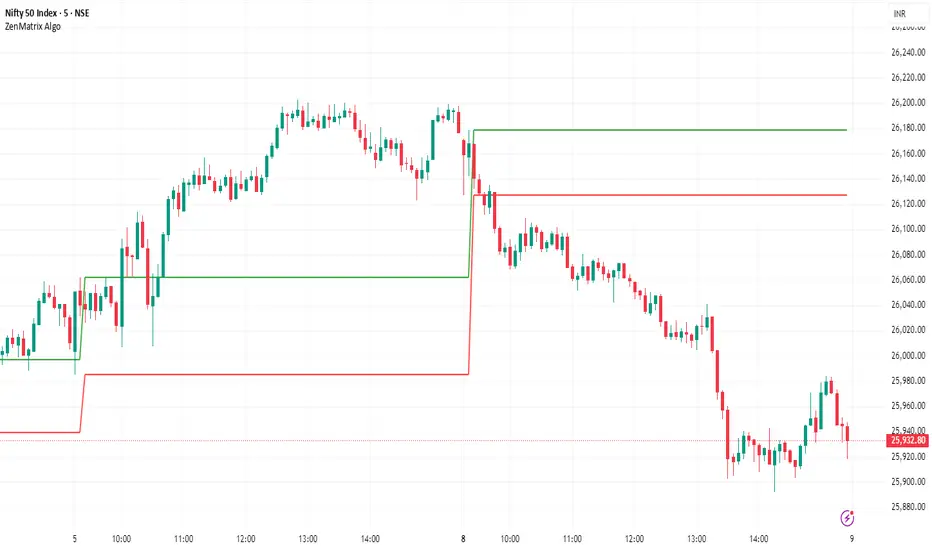
ZenMatrix AlgoZenMatrix Algo – Matrix Range Levels
ZenMatrix Algo automatically identifies the early market range for each trading day and plots clean horizontal support and resistance levels based on that range designed by Finovatech Solutions.
These levels often become important price reaction zones throughout the session.
✔ Features :--
Automatically detects the opening range each day
Plots dynamic support & resistance zones
Helps identify breakout areas and intraday structure
Works on any market: Crypto, Forex, Stocks & Indices
Multiple timeframe compatibility
🎯 Best For :--
Intraday scalping
Swing trading confirmations
index traders
anyone who uses early-session ranges as part of their market analysis
How to Use :--
Price breaking above the upper level may indicate bullish momentum
Price dropping below the lower level may indicate bearish continuation
Combine these levels with price action, volume, trend indicators, or your own strategy
Disclaimer :--
This script is for educational purposes only and is not financial advice.
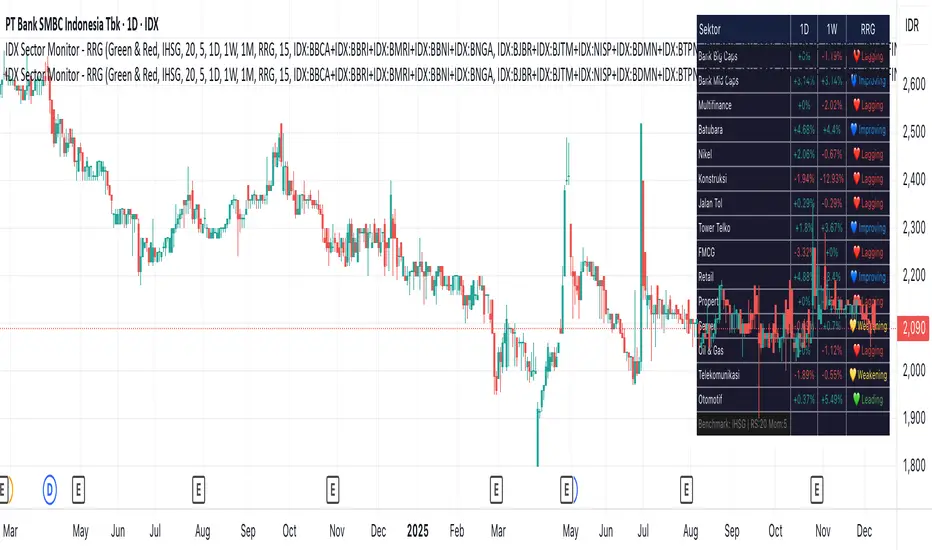
IDX Sector Monitor - RRG
// ═══════════════════════════════════════════════════════════════════════════════
// IDX SECTOR MONITOR - RRG EDITION
// ═══════════════════════════════════════════════════════════════════════════════
// Track Indonesian stock sectors with Relative Rotation Graph (RRG) analysis.
//
// Features:
// • Custom sector indices (equal-weighted)
// • Multi-timeframe performance (1D, 1W, 1M, etc.)
// • RRG status vs IHSG/LQ45 benchmark
//
// RRG Quadrants:
// 💚 Leading - Outperforming, strong momentum (BUY zone)
// 💛 Weakening - Still strong but slowing down (TAKE PROFIT)
// 💙 Improving - Weak but gaining momentum (WATCHLIST)
// ❤️ Lagging - Underperforming, avoid (SELL zone)
//
// ═══════════════════════════════════════════════════════════════════════════════
SMC Pro: Real-Time (English)Title: SMC Pro: Real-Time Sessions & Daily Cycle
Description:
SMC Pro: Real-Time Sessions & Daily Cycle is a comprehensive tool designed for Smart Money Concepts (SMC) and ICT traders. This indicator automatically plots key trading sessions and identifies market structure manipulations in real-time.
Unlike standard session indicators that wait for the session to close, this tool draws boxes and lines dynamically from the very first candle, allowing you to see the range developing live.
🚀 Key Features
1. Real-Time Session Drawing
Asia, London, and New York sessions are drawn candle-by-candle.
Boxes expand automatically as price creates new highs or lows during the session.
50% Midline for the Asian range to help identify premium/discount pricing.
2. The Daily Cycle & "Type 3" Detection
Based on the "Daily Cycle" logic, the indicator monitors the Asian Range after it closes.
Type 3 Whipsaw Alert: Automatically detects and labels a "Type 3" scenario where price sweeps BOTH the Asian High and Asian Low (manipulation).
Lines extend automatically to help you trade the breakout or reversal (Sweep).
3. PDH / PDL (Previous Day High/Low)
Displays the Previous Day High and Low levels.
Logic is strictly locked to the last completed day to keep your chart clean (no clutter from historical days).
4. Entry Helper (SCOB)
Color-coded candles: Highlights potential entry candles based on engulfing patterns after a liquidity sweep.
Fully customizable colors for Buy and Sell setups.
⚙️ Settings
Customizable Times: Adjust session hours to fit your broker's time zone or your specific strategy.
Visual Styles: Choose between Solid, Dashed, or Dotted lines for the Asian range.
Clean Chart: Toggle any feature (text, fills, lines) on or off to suit your visual preference.
💡 How to Use
Wait for the Asian Range to complete.
Watch for a "Sweep" of the Asian High or Low during the London/NY session.
If price sweeps BOTH sides, the indicator will tag it as "Type 3: Whipsaw", signaling a potential reversal or high-volatility expansion.
Use the PDH/PDL levels as major liquidity targets.

HTF Candle Overlay
This custom indicator is designed to help traders see *Higher Timeframe (HTF)* price action without leaving their current (lower timeframe) chart. It overlays the body and wicks of a larger candle (e.g., 4-hour or Daily) directly onto your 5-minute or 15-minute chart.
Key Functions
1. *Multi-Timeframe Visualization:* It draws the Open, High, Low, and Close of a higher timeframe candle (like the 4-hour) on top of your current chart.
2. *Live Projection:* As the live market moves, the indicator projects the expected width of the current HTF candle, allowing you to see it forming in real-time.
3. *Custom Styling:* You can toggle the background fill on/off and customize colors for bullish/bearish borders and backgrounds separately.
Practical Trading Uses
* Trend Alignment: Traders often use this to ensure they are trading in the direction of the higher timeframe trend. For example, if the 4-hour candle is green (Bullish), you might only look for buy setups on the 5-minute chart.
* Support & Resistance: The High and Low of the previous HTF candle often act as strong support or resistance levels. This indicator makes those levels immediately visible.
* Engulfing Patterns: You can easily spot if the current price action is "engulfing" the previous HTF candle, which can be a powerful reversal signal.
* Context for Scalping: Scalpers use this to avoid shorting into a strong bullish HTF candle or buying into a bearish one. It keeps you aware of the "bigger picture."."

Global Market Scanner [Armi Goldman]Concept
This indicator is designed to provide a comprehensive "Bird's Eye View" of the global financial economy. Instead of focusing on a single chart, this dashboard allows traders to monitor capital rotation across every major asset class simultaneously. By tracking the Money Flux (daily percentage change) of these markets, users can instantly identify if the market environment is "Risk-On" (flowing into assets) or "Risk-Off" (fleeing to cash/bonds).
Features
The dashboard displays a real-time table in the top-right corner tracking 9 key sectors:
US M2 Money Supply: The broad measure of liquidity availability.
US Dollar (DXY): The global currency baseline.
Global Stocks (VT): World equities performance.
Crypto Market: Total cryptocurrency market capitalization.
Commodities: Gold, Silver, and Crude Oil (WTI).
Real Estate: Vanguard Real Estate ETF (VNQ).
Bonds: US Aggregate Bond Market.
How it Works
The script utilizes request.security() to fetch data from multiple asset classes regardless of the chart you are currently viewing.
Flux Calculation: The "Flux" column calculates the daily percentage change (Close - Open) / Open. This reveals the immediate direction of capital flow for the current session.
M2 Trend: For the Money Supply, the script calculates a 30-day rate of change to determine if the Fed is effectively "Inflating" (adding liquidity) or "Tightening" (removing liquidity).
Status Logic: The status column uses conditional logic to assign readable labels (e.g., "INFLOW" vs "OUTFLOW" or "STRONGER" vs "WEAKER") based on the positive or negative value of the Flux.
How to Use
Risk-On Signal: If Stocks, Crypto, and Real Estate show green "INFLOW" status while the Dollar (DXY) is red, capital is deploying into risk assets.
Flight to Safety: If Gold and Bonds are green while Equities are red, investors may be hedging against fear.
Cash is King: If DXY is strong (Green) and almost all other assets are red, liquidity is drying up and moving into Cash.
Liquidity Watch: Monitor the US M2 Supply. A simplified view is that when M2 is "Inflating," it provides a long-term tailwind for asset prices.
Tickers Used
Liquidity: ECONOMICS:USM2
Currency: TVC:DXY
Equities: AMEX:VT (Total World Stock ETF)
Real Estate: AMEX:VNQ (Vanguard Real Estate)
Bonds: AMEX:AGG
Commodities: TVC:GOLD, TVC:SILVER, TVC:USOIL
Crypto: CRYPTOCAP:TOTAL
Disclaimer This tool is for informational purposes only and does not constitute financial advice.

4HR JRSX Algo4HR JRSX Algo
The 4HR JRSX Algo is built for users who monitor swing conditions on the four hour chart. It uses a JRSX-based structure combined with candle confirmation rules to highlight moments where momentum rotation and exhaustion patterns align. This tool is designed exclusively for GBPUSD and EURUSD on the 4-hour timeframe.
Intended Usage
• Timeframe: 4-hour
• Pairs: GBPUSD and EURUSD
• Style: Swing trading
• Frequency: Roughly 10 to 15 setups per year per pair
• Alerts: Available for all potential signals
• Not intended for use during Asia session
Technical Methodology
JRSX Strength and Rotation
The script evaluates JRSX behavior to identify shifts in directional strength. It marks conditions where rotation or exhaustion aligns with predefined parameters. It does not forecast future outcomes and is not optimized for any other instruments.
Candle Confirmation Requirements
Signals only confirm after the bar closes, ensuring no intrabar repainting.
• Buy Conditions: Bullish close or a pinbar showing clear rejection from the downside
• Sell Conditions: Bearish close or a pinbar showing rejection from the upside
Only fully closed candles can confirm a setup.
Stop Loss and 4R Target Plotting
For each valid setup, the algo automatically plots:
• A suggested stop reference below (for buys) or above (for sells) the signal candle zone
• A corresponding projected target level based on a 4R multiple
These levels are provided as visual planning tools. They are not performance projections and should be used within each user’s own risk framework.
Session Guidance
The tool is not intended for Asia session trading. Signals forming in low-liquidity hours may not reflect the conditions the algorithm is built around. Users should focus on sessions with higher participation such as London and New York.
Swing-Focused Structure
Because this tool evaluates higher-timeframe momentum and exhaustion conditions, setups are selective. Users can expect around 10–15 signals per year per pair.
Alerts
Alerts can be enabled for buy conditions, sell conditions, and rotation events so users can monitor the pairs without remaining at their screens.
Important Notes
This script analyzes historical price and JRSX behavior. It does not predict future price movement or guarantee results. All trading carries risk. Users should test and review the tool on the intended pairs and ensure the approach suits their strategy before using it in live conditions.

SMC Pro: Real-Time Final**Description:**
This comprehensive SMC indicator is designed to automatically visualize major **Trading Sessions** and **Killzones**, alongside Fair Value Gaps (FVG). It helps traders identify high-probability setups by correlating time and price, specifically during key market hours (London, New York, Asia).
**Key Features:**
1. **Trading Sessions & Killzones:** The indicator clearly highlights the open and duration of major sessions (Asia, London, New York), allowing traders to spot volatility injections and "Judas Swings."
2. **Automated FVG Detection:** Scans price action to locate valid Fair Value Gaps and Imbalances within these sessions.
3. **Entry Logic:** Marks potential entry zones at the 50% retracement level of the identified FVG.
4. **Risk Management:** Projects a fixed Risk-to-Reward ratio (e.g., 1:3) with automatic Stop Loss and Take Profit levels.
5. **Clean Visualization:** Color-coded boxes for sessions and gaps keep the chart organized.
**How to Use:**
* **Time Analysis:** Watch for price action as the London or NY session opens (highlighted by the indicator).
* **Signal:** Wait for an Imbalance/FVG to form during these high-volume times.
* **Entry:** Set a limit order at the 50% mark of the gap.
* **Exit:** Use the projected TP levels.
**Disclaimer:**
This tool is for educational purposes and technical analysis assistance only. Past performance does not guarantee future results.
