MACD-v Bullish/Bearish DivergenceMACD-v Bullish/Bearish Divergence
Overview This indicator is a specialized divergence detector based on the MACD-v (Volatility Normalized Momentum) concept. Unlike standard MACD which uses absolute price differences, MACD-v normalizes values against volatility (ATR), allowing for fixed, universal Overbought/Oversold thresholds across all assets and timeframes.
Recommendation: This script is highly effective when paired with the original MACD-v by Alex Spiroglou. While this indicator focuses on identifying and visualizing divergence entries, using the original oscillator alongside it provides the best visual context for the overall momentum structure.
How It Works
This tool uses a dual-signal mechanism (Raw Line + Signal Smooth) to identify specific divergence setups:
Setup (Yellow/Blue Dots): Identifies when price momentum has extended significantly into extreme zones (Overbought/Oversold).
Trigger (Red/Green Dots): Fires when price fails to make a new momentum extreme despite price action (classic divergence/failure swing).
Active State (Background Color): Once a trigger fires, the background highlights (Red for Bearish, Green for Bullish) to indicate an active divergence play.
Reset (Exit): The signal state clears when momentum returns to the neutral "safe zone."
Important Note: Momentum Washout
The colored background persists as long as the divergence trade remains valid. Traders should note the concept of "Momentum Washout":
Signal End: The background color turns off when the MACD returns to the neutral range, indicating the primary high-velocity impulse is over.
Performance Continuation: Significant positive or negative price performance can often continue even after the background signal ends. This period allows the remaining momentum to "wash out" or drift before the next major impulse.
Strategy Tip: The indicator is designed to capture the high-volatility portion of the reversal. Do not assume the end of the signal is the absolute top or bottom of the trend; it simply marks the normalization of momentum.
Strategy Recommendation: Multi-Timeframe Analysis
Divergence signals are most powerful when confirmed across timeframes. It is highly recommended to look for alignment before taking a trade:
Trend Confirmation: If you see a signal on a lower timeframe (e.g., 5m or 15m), check a higher timeframe (e.g., 1H or 4H). A bullish divergence on the 5m is significantly more reliable if the 1H momentum is already bullish or oversold.
Signal Stacking: Valid signals often appear sequentially—first on the 1m, then the 5m, and finally the 15m. Waiting for this "cascade" can filter out false reversals.
Visual Guide
🔵 Blue Dot: Bullish Divergence Setup (Watch for entry).
🟢 Green Dot: Bullish Divergence Trigger (Long Entry).
🟡 Yellow Dot: Bearish Divergence Setup (Watch for entry).
🔴 Red Dot: Bearish Divergence Trigger (Short Entry).
Background Color: Indicates an active trade (Red = Bearish / Green = Bullish).
Settings
Auto-Detect: Automatically switches between Scalping settings (tighter thresholds) for low timeframes and Swing settings for high timeframes.
Strict Invalidation: If enabled, cancels a setup if momentum pushes too far in the opposite direction before triggering.
Active Signal Multiplier: Dynamically smooths the signal line only when a trade is active to prevent premature exits during choppy corrections.
Disclaimer: This tool is for educational purposes and trend analysis only. Always manage your risk appropriately.
Indicadores y estrategias

Elite Net Cash by Mashrab🚀 Elite Net Cash Dashboard code by Mashrab
Stop switching tabs. Get the full fundamental picture instantly.
This dual-panel dashboard puts institutional-grade data right on your chart. It splits the "heavy math" from the "market context," giving you a clean, professional view of a company's true value and trading personality.
🔥 Why You’ll Love It
Two Smart Tables:
Financials: See the health check immediately—Net Cash, Cash Backed %, Free Cash Flow, and Revenue Growth.
Profile: Know who you are trading—Market Cap (with auto-class like "Mega" or "Small"), Volatility (ADR), and Sector.
Auto-ETF Mapping: It automatically tags the sector with its matching ETF (e.g., Technology (XLK)). Perfect for quickly checking relative strength!
Volatility Alerts: The ADR (Average Daily Range) turns Yellow if the stock moves more than 5% a day. Know the risk before you size your position.
Minimalist Mode: Want a clean chart? Uncheck the "Borders" box in settings for a sleek, text-only floating display.
🎯 How to Trade It
Check the Green: Look at the Financials table. Green numbers mean the company is cash-rich and growing.
Check the Moves: Look at the Profile table. High ADR means expect wild swings; Mega Cap means steady stability.
Check the Sector: Use the ETF tag to see if the whole industry is moving or just this stock.
⚙️ Make It Yours
Split the View: Put Financials top-right and Profile bottom-right (or anywhere else).
Style It: Toggle borders on/off and pick your colors.

Advanced Multi-Level S/R ZonesAdvanced Multi-Level S/R Zones: The Comprehensive Guide
1. Introduction: The Evolution of Support & Resistance:
Support and Resistance (S/R) is the backbone of technical analysis. However, traditional methods of drawing these levels are often plagued by subjectivity. Two traders looking at the same chart will often draw two different lines. Furthermore, standard indicators often treat every price point equally, ignoring the critical context of Volume and Time.
The Advanced Multi-Level S/R Zones script represents a paradigm shift. It moves away from subjective line drawing and toward Quantitative Zoning. By utilizing statistical measures of variability (Standard Deviation, MAD, IQR) combined with Volume-Weighting and Time-Decay algorithms, this tool identifies where price is mathematically most likely to react. It treats S/R not as thin lines, but as dynamic zones of probability.
2. Core Logic and Mathematical Foundation:
To understand how to use this tool optimally, one must understand the "engine" under the hood. The script operates on four distinct pillars of logic:
A. Session-Based Data Collection:
The script does not look at every single tick. Instead, it aggregates data into "Sessions" (daily bars by default logic). It extracts the High, Low, and Total Volume for every session within the user-defined lookback period. This filters out intraday noise and focuses on the macro structure of the market.
B. Adaptive Statistical Variability:
Most Bollinger Band-style indicators use Standard Deviation (StdDev) to measure width. However, StdDev is heavily influenced by outliers (extreme wicks). This script offers a sophisticated Adaptive Method-Skewness Detection: The script calculates the skewness of the price distribution. Adaptive Selection: If the data is highly skewed (lots of outliers, typical in Crypto), it switches to MAD (Median Absolute Deviation). MAD is robust and ignores outliers. If the data is moderately skewed, it uses IQR (Interquartile Range). If the data is normal (Gaussian), it uses StdDev.
Benefit: This ensures the zone widths are accurate regardless of whether you are trading a stable Forex pair or a volatile Altcoin.
C. The Weighting Engine (Volume + Time)
Not all price history is equal. This script assigns a "Weight Score" to every session based on two factors:
Volume Weighting: Sessions with massive volume (institutional activity) are given higher importance. A high formed on low volume is less significant than a high formed on peak volume.
Time Decay: Recent price action is more relevant than price action from 50 bars ago. The script applies a decay factor (default 0.85). This means a session from yesterday has 100% impact, while a session from 10 days ago has significantly less influence on the zone calculation.
D. Clustering Algorithm
Once the data is weighted, the script runs a clustering algorithm. It looks for price levels where multiple session Highs (for Resistance) or Lows (for Support) congregate.
It requires a minimum number of points to form a zone (User Input: minPoints).
It merges nearby levels based on the Cluster Separation Factor.
This results in "Primary," "Secondary," and "Tertiary" zones based on the strength and quantity of data points in that cluster.
3. Detailed Features and Inputs Breakdown:
Group 1: Main Settings
Lookback Sessions (Default: 10): Defines how far back the script looks for pivots. A higher number (e.g., 50) creates long-term structural zones. A lower number (e.g., 5) creates short-term scalping zones.
Variability Method (Adaptive): As described above, leave this on "Adaptive" for the best results across different assets.
Zone Width Multiplier (Default: 0.75): Controls the vertical thickness of the zones. Increase this to 1.0 or 1.5 for highly volatile assets to ensure you catch the wicks.
Minimum Points per Zone: The strictness filter. If set to 3, a price level must be hit 3 times within the lookback to generate a zone. Higher numbers = fewer, but stronger zones.
Group 2: Weighting
Volume-Weighted Zones: Crucial for identifying "Smart Money" levels. Keep this TRUE.
Time Decay: Ensures the zones update dynamically. If price moves away from a level for a long time, the zone will fade in significance.
ATR-Normalized Zone Width: This is a dynamic volatility filter. If TRUE, the zone width expands and contracts based on the Average True Range. This is vital for maintaining accuracy during market breakouts or crashes.
Group 3: Zone Strength & Scoring
The script calculates a "Score" (0-100%) for every zone based on:
-Point Count: More hits = higher score.
-Touches: How many times price wicked into the zone recently.
-Intact Status: Has the zone been broken?
-Weight: Volume/Time weight of the constituent points.
-Track Zone Touches: Looks back n bars to see how often price respected this level.
-Touch Threshold: The sensitivity for counting a "touch."
Group 4: Visuals & Display
Extend Bars: How far to the right the boxes are drawn.
Show Labels: Displays the Score, Tier (Primary/Secondary), and Status (Retesting).
Detect Pivot Zones (Overlap): This is a killer feature. It detects where a Support Zone overlaps with a Resistance Zone.
Significance: These are "Flip Zones" (Old Resistance becomes New Support). They are colored differently (Orange by default) and represent high-probability entry areas.
Group 5: Signals & Alerts
Entry Signals: Plots Buy/Sell labels when price rejects a zone.
Detect Break & Retest: specifically looks for the "Break -> Pullback -> Bounce" pattern, labeled as "RETEST BUY/SELL".
Proximity Alert: Triggers when price gets within x% of a zone.
4. Understanding the Visuals (Interpreting the Chart)
When you load the script, you will see several visual elements. Here is how to read them:
The Boxes (Zones)
Red Shades: Resistance Zones.
Dark Red (Solid Border): Primary Resistance. The strongest wall.
Lighter Red (Dashed Border): Secondary/Tertiary. Weaker, but still relevant.
Green Shades: Support Zones.
Dark Green (Solid Border): Primary Support. The strongest floor.
Orange Boxes: Pivot Zones. These are areas where price has historically reacted as both support and resistance. These are the "Line in the Sand" for trend direction.
The Labels & Emojis
The script assigns emojis to zone strength:
🔥 (Fire): Score > 80%. A massive level. Expect a strong reaction.
⭐ (Star): Score > 60%. A solid structural level.
✓ (Check): Score > 40%. A standard level.
"⟳ RETESTING": Appears when a zone was broken, and price is currently pulling back to test it from the other side.
The Dashboard (Top Right)
A statistics table provides a "Head-Up Display" for the asset:
High/Low σ (Sigma): The variability of the highs and lows. If High σ is much larger than Low σ, it implies the tops are erratic (wicks) while bottoms are clean (flat).
Method: Shows which statistical method the Adaptive engine selected (e.g., "MAD (auto)").
ATR: Current volatility value used for normalization.
5. Strategies for Optimum Output
To get the most out of this script, you should not just blindly follow the lines. Use these specific strategies:
Strategy A: The "Zone Fade" (Range Trading)
This works best in sideways markets.
Identify a Primary Support (Green) and Primary Resistance (Red).
Wait for price to enter the zone.
Look for the "SUPPORT BOUNCE" or "RESISTANCE REJECTION" signal label.
Entry: Enter against the zone (Buy at support, Sell at resistance).
Stop Loss: Place just outside the zone width. Because the zones are calculated using volatility stats, a break of the zone usually means the trade is invalid.
Strategy B: The "Pivot Flip" (Trend Following)
This is the highest probability setup in trending markets.
Look for an Orange Pivot Zone.
Wait for price to break through a Resistance Zone cleanly.
Wait for the price to return to that zone (which may now turn Orange or act as Support).
Look for the "RETEST BUY" label.
Logic: Old resistance becoming new support is a classic sign of trend continuation. The script automates the detection of this exact geometric phenomenon.
Strategy C: The Volatility Squeeze
Look at the Dashboard. Compare High σ and Low σ.
If the values are dropping rapidly or becoming very small, the zones will contract (become narrow).
Narrow zones indicate a "Squeeze" or compression in price.
Prepare for a violent breakout. Do not fade (trade against) narrow zones; look to trade the breakout.
6. Optimization & Customization Guide
Different markets require different settings. Here is how to tune the script:
For Crypto & Volatile Stocks (Tesla, Nvidia)
Method: Set to Adaptive (Mandatory, as these assets have "Fat Tails").
Multiplier: Increase to 1.0 - 1.25. Crypto wicks are deep; you need wider zones to avoid getting stopped out prematurely.
Lookback: 20-30 sessions. Crypto has a long memory; short lookbacks generate too much noise.
For Forex (EURUSD, GBPJPY)
Method: You can force StdDev or IQR. Forex is more mean-reverting and Gaussian.
Multiplier: Decrease to 0.5 - 0.75. Forex levels are often very precise to the pip.
Volume Weighting: You may turn this OFF for Forex if your broker's volume data is unreliable (since Forex has no centralized volume), though tick volume often works fine.
For Scalping (1m - 15m Timeframes)
Lookback: Decrease to 5-10. You only care about the immediate session history.
Decay Factor: Decrease to 0.5. You want the script to forget about yesterday's price action very quickly.
Touch Lookback: Decrease to 20 bars.
For Swing Trading (4H - Daily Timeframes)
Lookback: Increase to 50.
Decay Factor: Increase to 0.95. Structural levels from weeks ago are still highly relevant.
Min Points: Increase to 3 or 4. Only show levels that have been tested multiple times.
7. Advantages Over Standard Tools:
Feature Standard S/R Indicator, Advanced Multi-Level S/R Calculation, Uses simple Pivots or Fractals, Uses Statistical Distributions (MAD/IQR). Zone Width Arbitrary or Fixed Adaptive based on Volatility & ATR.
Context Ignores Volume Volume Weighted (Smart Money tracking).
Time Relevance Old levels = New levels Time Decay (Recency bias applied).
Overlaps Usually ignores overlaps Detects Pivot Zones (Res/Sup Flip).
Scoring None 0-100% Strength Score per zone.
8. Conclusion:
The Advanced Multi-Level S/R Zones script is not just a drawing tool; it is a statistical analysis engine. By accounting for the skewness of data, the volume behind the moves, and the decay of time, it provides a strictly objective roadmap of the market structure.
For the optimum output, combine the Pivot Zone identification with the Retest Signals. This aligns you with the underlying flow of order blocks and prevents trading against the statistical probabilities of the market.

TCI Time Oracle - Intraday
🟢 Green Zone — Opening & Closing Liquidity Window
Time:
Opening Green: ~9:15 – 9:30 AM
Closing Green: ~3:15 – 3:30 PM
Market Character:
Highest liquidity of the day
Overnight positions unwind / fresh positions initiate
Strong directional intent often revealed
Smart money sets the day’s bias
Trading Insight:
Best zone for trend bias identification
Option premiums react fastest here
Not ideal for late entries, but excellent for confirmation
🔵 Blue Zone — Midday Compression / Algo Control
Time: ~11:15 AM – 12:00 PM
Market Character:
Volatility contraction
Algo-driven price control
Time decay dominates options
Fake breakouts and mean reversion
Trading Insight
Worst zone for aggressive option buying
Best for range scalping or staying flat
Institutions wait, retailers get chopped
🔴 Red Zone — Institutional Expansion / Trap Zone
Time: ~1:15 PM – 2:00 PM
Market Character:
Sudden volatility expansion
Institutional orders hit the market
Trend acceleration or sharp reversal
Options see rapid delta & gamma shift
Trading Insight:
High probability trend continuation or trap creation
Strong zone for directional option trades
Requires strict risk management
Big Picture Takeaway
Green sets the intent
Blue compresses and traps
Red expands and delivers the real move
This time-zone behavior is exactly why one strategy cannot work all day. Edge comes from trading the right setup in the right time window.

ZeroDegen Mega Pro Pack v2═══════════════════════════════════════════════════════════════════════════════
ZERODEGEN MEGA PRO PACK v2 — Multi-Mode Trading System
═══════════════════════════════════════════════════════════════════════════════
Professional trading indicator with 11 modes for crypto markets. Clear BUY/SELL signals, real-time market analysis, and institutional-grade filters.
🎯 WHAT IT DOES
Analyzes price action using multi-factor confirmation:
- EMA crossovers (9/21) for trend direction
- RSI momentum filtering
- ADX trend strength validation
- Volume confirmation
- Higher timeframe bias (1H trend filter)
- Institutional concepts: Liquidity sweeps, Fair Value Gaps
Generates clear BUY and SELL signals directly on your chart with a real-time status panel showing all market conditions at a glance.
📊 11 TRADING MODES
SCALP (15m): Standard, Aggressive, Conservative
TREND (1H-4H): Standard, Cloud, Institutional
INSTITUTIONAL: Liquidity Engine
MIXED: Pro, Reversal, Auto Engine, Automation + Confidence
Switch modes with one click to match market conditions.
⚡ KEY FEATURES
✓ Clear visual BUY/SELL/EXIT signals
✓ Real-time status panel with all indicators
✓ Smart filters (Volume, ADX, ATR, Range)
✓ HTF Bias display (1H trend direction)
✓ Institutional Confidence score
✓ Works on any crypto pair
✓ TradingView alert-ready
📈 RECOMMENDED USAGE
Timeframes: 15m (scalp), 1H (swing), 4H (trend)
Markets: BTC, ETH, SOL, and other liquid crypto pairs
🔐 HOW TO GET ACCESS
Visit: xeroc00l.org
- Monthly: $59/mo
- Quarterly: $149 (save 15%)
- Lifetime: $497 (one-time)
After payment, send your TradingView username to zerocool@xeroc00l.org — access granted within 24 hours.
🚀 COMING SOON
We're actively developing additional features including bot integration, automated execution, and a private trading community. Subscribe now and get access to all future updates.
Learn more: xeroc00l.org
⚠️ LEGAL DISCLAIMER
This indicator is provided for educational and entertainment purposes only. It is not financial advice and should not be construed as a recommendation to buy, sell, or hold any cryptocurrency or financial instrument.
Trading cryptocurrencies and leveraged products involves substantial risk of loss and is not suitable for all investors. Past performance is not indicative of future results. You should not trade with money you cannot afford to lose.
The creators of ZeroDegen are not licensed financial advisors, brokers, or dealers. By using this indicator, you acknowledge that all trading decisions are your own responsibility and you agree that ZeroDegen and its creators are not liable for any losses incurred.
Always do your own research and consider consulting a licensed financial professional before making investment decisions.
© 2025 ZeroDegen | For entertainment purposes only

Impulsive Trend Detector [dtAlgo]This advanced Pine Script indicator identifies and tracks impulsive price movements based on Break of Structure (BOS) and Change of Character (CHoCH) concepts from Smart Money trading methodology.
The indicator automatically detects pivot highs and lows, then monitors when price breaks these key levels to signal potential impulsive moves. BOS indicates continuation in the current trend direction, while CHoCH signals potential trend reversals. Each detected move is measured from the break point to the next opposing pivot, providing accurate percentage calculations that match TradingView's measuring tool.
Impulsive moves are categorized into four levels based on magnitude (Level 1: 5-10%, Level 2: 10-15%, Level 3: 15-20%, Level 4: 20%+), with color-coded visual labels and connecting lines displayed directly on the chart.
Comprehensive Session Analysis:
Track moves across 11 distinct trading sessions in Eastern Time: Pre-London/NY, London/NY overlap, NY (with Power Hour and End subdivisions), Sydney, Asia, Sake Time, Asia/London overlap, London, Weekend, and No Session periods.
Three Dynamic Tables provide:
Real-time statistics (bullish/bearish, BOS/CHoCH, levels)
Session breakdown with move counts and average percentages
Event log showing last 10 moves with date, day, session, direction, type, level, percentage, duration, and bar count
Perfect for Smart Money traders seeking data-driven insights into market structure behavior across global trading sessions.

[iQ]PRO Pricing Levels+PRO Pricing Levels+ Analysis
Summary
A comprehensive institutional-grade market profile and liquidity analysis tool designed for professional traders who focus on price delivery and volume distribution. It identifies high-probability reaction zones by blending historical interaction density with advanced mathematical modeling.
How It Works
The script utilizes a proprietary multi-layered engine to map the "DNA" of recent price action. It functions by scanning a user-defined lookback window to identify specific price coordinates where the market has historically shown significant interest or exhaustion.
Methodology: The core logic evaluates "Price-Density" It doesn't just look at where price has been, but calculates the quality of those interactions by weighing them against volume intensity and recency. This creates a "Heatmap" of structural importance.
Model Engine: The tool incorporates a sophisticated classification system that identifies the current "Market Model" (such as Expansion, Reversion, or Compression). This helps traders distinguish between a trending market and a mean-reverting one.
Statistical Deviations: Beyond standard support and resistance, the script projects dynamic expansion levels based on the volatility of the analyzed range, identifying potential "statistical exhaustion" points.
Liquidity Mapping: It automatically detects internal and external liquidity sweeps, providing real-time feedback on whether the current move is a genuine breakout or a sophisticated stop-hunt.
Key Features
Dynamic PD Heatmap: Visually represents price density and interaction quality through a color-coded histogram.
Advanced Model Engine: Automatically classifies market phases (e.g., "MM Reversal" or "Expansion") to align your bias.
Volume-Weighted Weighting: Filters out "fake" price movements that occurred on low participation.
Premium/Discount Zones: Integrated equilibrium mapping to ensure you are never buying at the top of a range or selling at the bottom.
Chaos Filtering: An advanced algorithmic filter designed to minimize noise and highlight only the most structurally sound levels.
How to Use
Step 1: Define the Range: Adjust the Lookback Length to match your trading style (shorter for scalping, longer for swing trading).
Step 2: Identify the POC: Look for the "Point of Control" (POC) markers. These levels represent the highest density of historical interaction and often act as "magnets" for price.
Step 3: Monitor the Model Label: Use the Market Model label to determine if you should be looking for trend-following entries or reversal setups.
Step 4: Execute at Liquidity Zones: Look for price to interact with the "💧" markers or high-multiplier deviation lines for potential exhaustion-based entries.
Settings & Configuration
Core & Range Definition: Customize the lookback period and price source for level generation.
PRD Level Calculation: Switch between ATR, Percentage, or Fixed Point steps to determine how granular the price map should be.
Range Deviations: Configure multiple multipliers to project potential overextension zones.
Model Engine: Toggle the advanced "Chaos Filter" and "RAV Weighting" to adjust the sensitivity of the probability calculations.
Visualization: Enable or disable the Heatmap, Summary Table, and Regression Channels to suit your chart layout.
Past does not guarantee future results.
For Research and study!
Enjoy, MMiQ.

Trend Targets [Philosopher] Pro Alerts & Live DashTrend Targets Pro: Advanced Trend Analysis & Live Risk Management
Trend Targets Pro is a comprehensive trend-following ecosystem designed for traders who demand precision, automated risk management, and real-time performance tracking. By merging multi-layered trend filtering with dynamic volatility-based targets, this tool transforms complex price action into a clear, actionable roadmap.
Core Methodology
The script utilizes a unique "Dual-Filter" logic to identify high-probability trend shifts:
The Baseline: A sophisticated combination of Supertrend logic smoothed by WMA (Weighted Moving Average) and EMA (Exponential Moving Average). This creates a "Trend Baseline" that filters out market noise and identifies the true directional bias.
Confirmation Rejections: The script tracks price "rejections" against the baseline. Only after a user-defined confirmation count is met does the script signal a continuation, ensuring you aren't entering on minor fluctuations.
Key Features
🚀 Automated Trade Architecture: Upon a trend shift (Bullish/Bearish), the script instantly calculates and draws an Entry Line, an ATR-based Stop Loss, and three tiered Take Profit levels (TP1, TP2, TP3).
📊 Live Performance Dashboard: Track your current session in real-time. The on-chart HUD displays Total Trades, Profitable Trades, and Lost Trades, giving you immediate feedback on the current market's compatibility with the strategy.
🎯 Dynamic Visual Feedback:
Trend-Colored Bars: The entire chart atmosphere adapts to the trend.
Live Labels: Targets dynamically update and change color (Green/Red) when hit, providing "at-a-glance" trade management.
Rejection Signals: Visual triangle markers (▲/▼) indicate potential continuation points within an existing trend.
🔔 Institutional-Grade Alert System:
Entry Alerts: Includes Entry, SL, and all 3 TP prices.
Execution Alerts: Instant notifications when any TP or SL is triggered.
Weekly Reports: Automatically generates a performance summary every Saturday to help you review your weekly net points.
Asset-Specific UI: Built-in emoji support for Gold (XAU), BTC, Forex, and Indices for better readability in Telegram/Discord webhooks.
Risk Management at its Core
The script is built for professional risk-to-reward ratios. By using ATR (Average True Range) for target calculation, the "Philosopher" edition ensures your stops and targets are mathematically proportional to the current market volatility.
Risk Warning included in alerts: "Trading involves high risk. Secure your trade at TP1 and maintain strict risk management."
How to Use
Trend Detection: Wait for a color change in the Baseline or a Plotshape label.
Execution: Use the calculated TP/SL levels provided by the dynamic labels.
Optimization: Adjust the "Supertrend Factor" for higher timeframes and the "Confirmation Count" to filter out choppy markets.
Technical Specifications:
Version: Pine Script™ v6 (Latest)
Overlay: Enabled
Alerts: Fully dynamic (supports placeholders)
Disclaimer
This indicator is for educational and informational purposes only. Past performance does not guarantee future results. Always trade within your risk limits.

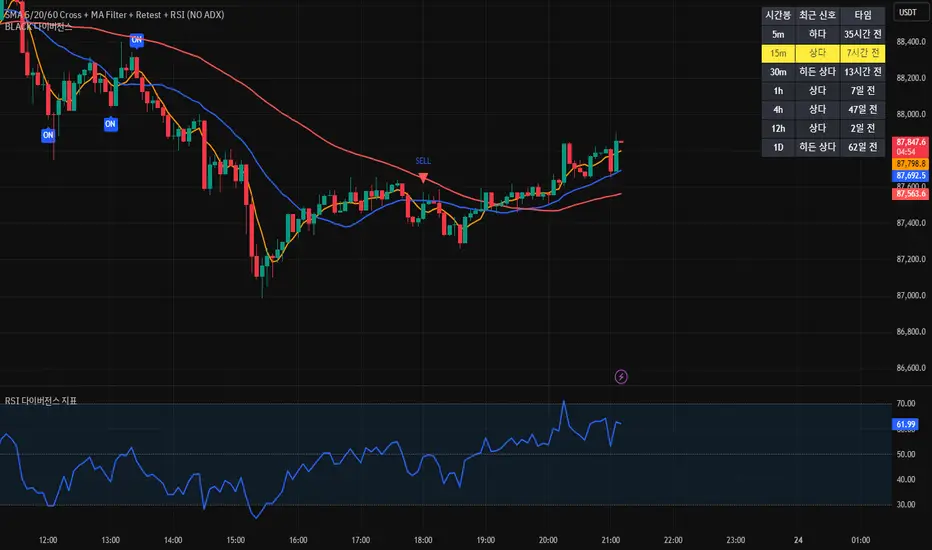
[BLACK] DivergenceDivergence
RSI Filter
EMA Filter
Unconfirmed Divergence Display
Confirmed Unconfirmed Alerts
Boards by Timeframe
다이버전스
RSI필터 EMA필터
미확정 다이버전스 표시
확정 미확정 얼러트
각 시간봉 다이버전스 보드
Instant Start EMA RibbonHave you noticed that EMAs on Tradingview start to appear on chart after the number of candles required by the EMA has fulfilled?
Example, 200 EMA shows up only when 200 candles have been printed on the canvas irrespective of the timeframe.
You might also have noticed that in some other charting software, the EMAs start from the very first candle of the instrument/asset class, a good example is a newly listed stock. And then the EMA automatically aligns itself once the amount of candles required by the EMA is fulfilled.
So if you want similar behavior of EMAs on Tradingview, you can use this "Instant Start EMA Ribbon" specifically coded in Pinescript to exactly and accurately mimic the behavior of EMAs like the other software. You can check that EMAs with this custom indicator start from the very first candles after listing of the instrument/asset class. This indicator will optimize the EMAs and work as a normal EMA once the amount of candles required are fulfilled, until then, it will use custom parameters to calculate the EMAs (that is the available current candle data).
Tip: You can change the values and colors of EMAs from the indicator settings.
Disclaimer/Warning: This indicator does not provide Buy/Sell signals or nor is an investment advice. This indicator solely for the purpose of study of price and Exponential Moving Averages. Users are responsible for their own actions, profit/loss of the users is not the liability of author.

Trend Targets [Philosopher] Pro Alerts & Live DashTrend Targets Pro: Advanced Trend Analysis & Live Risk Management
Trend Targets Pro is a comprehensive trend-following ecosystem designed for traders who demand precision, automated risk management, and real-time performance tracking. By merging multi-layered trend filtering with dynamic volatility-based targets, this tool transforms complex price action into a clear, actionable roadmap.
Core Methodology
The script utilizes a unique "Dual-Filter" logic to identify high-probability trend shifts:
The Baseline: A sophisticated combination of Supertrend logic smoothed by WMA (Weighted Moving Average) and EMA (Exponential Moving Average). This creates a "Trend Baseline" that filters out market noise and identifies the true directional bias.
Confirmation Rejections: The script tracks price "rejections" against the baseline. Only after a user-defined confirmation count is met does the script signal a continuation, ensuring you aren't entering on minor fluctuations.
Key Features
🚀 Automated Trade Architecture: Upon a trend shift (Bullish/Bearish), the script instantly calculates and draws an Entry Line, an ATR-based Stop Loss, and three tiered Take Profit levels (TP1, TP2, TP3).
📊 Live Performance Dashboard: Track your current session in real-time. The on-chart HUD displays Total Trades, Profitable Trades, and Lost Trades, giving you immediate feedback on the current market's compatibility with the strategy.
🎯 Dynamic Visual Feedback:
Trend-Colored Bars: The entire chart atmosphere adapts to the trend.
Live Labels: Targets dynamically update and change color (Green/Red) when hit, providing "at-a-glance" trade management.
Rejection Signals: Visual triangle markers (▲/▼) indicate potential continuation points within an existing trend.
🔔 Institutional-Grade Alert System:
Entry Alerts: Includes Entry, SL, and all 3 TP prices.
Execution Alerts: Instant notifications when any TP or SL is triggered.
Weekly Reports: Automatically generates a performance summary every Saturday to help you review your weekly net points.
Asset-Specific UI: Built-in emoji support for Gold (XAU), BTC, Forex, and Indices for better readability in Telegram/Discord webhooks.
Risk Management at its Core
The script is built for professional risk-to-reward ratios. By using ATR (Average True Range) for target calculation, the "Philosopher" edition ensures your stops and targets are mathematically proportional to the current market volatility.
Risk Warning included in alerts: "Trading involves high risk. Secure your trade at TP1 and maintain strict risk management."
How to Use
Trend Detection: Wait for a color change in the Baseline or a Plotshape label.
Execution: Use the calculated TP/SL levels provided by the dynamic labels.
Optimization: Adjust the "Supertrend Factor" for higher timeframes and the "Confirmation Count" to filter out choppy markets.
Technical Specifications:
Version: Pine Script™ v6 (Latest)
Overlay: Enabled
Alerts: Fully dynamic (supports placeholders)
Disclaimer
This indicator is for educational and informational purposes only. Past performance does not guarantee future results. Always trade within your risk limits.

Sector Rotation ULTIMATE: 7 Narrativas IndependientesSector Rotation ULTIMATE: Crypto Narrative Rotation (7 Independent Sectors)
Advanced indicator displaying the relative strength of major crypto sectors through 7 independently normalized lines (0-100):
• Layer1 (ETH, SOL, BNB, TON, etc.) - Pink
• Enterprise (XRP, HBAR, XLM, QNT, VET) - Yellow
• DeFi (UNI, AAVE, MKR, LDO, CRV, etc.) - Cyan
• Memecoins (SHIB, DOGE, PEPE, WIF, FLOKI, BONK) - Green
• AI (TAO, FET, ICP, GRT, etc.) - Orange
• L2 / Scalability (ARB, OP, MATIC, STRK) - Purple
• RWA + Infra (ONDO, LINK) - Brown
Each sector sums the dominance of its top coins (40 total) and is normalized independently so the lines cross constantly, revealing real capital rotations.
- Colored fills to visually highlight the leading sector
- Works perfectly on any timeframe (clean daily data, no intraday noise)
- Ideal for spotting altseason, sector rotations, and entry timing
Use on CRYPTOCAP:TOTAL. The definitive narrative oscillator for 2026!
#Crypto #Altcoins #SectorRotation #DeFi #Memecoins #AI #RWA

Volume-Weighted Fibonacci PivotThis indicator automatically plots dynamic Fibonacci retracement and extension levels based on a volume-weighted pivot point within a user-defined lookback period or date range. It intelligently calculates a central "pivot" price biased toward high-volume bars, then draws symmetric levels both upward (extensions) and downward (retracements) for balanced confluence analysis.
How It Works (Technical Methodology)
Lookback Period Determination
Multiple filter modes control the data range used for calculations:
"Last X Bars": Fixed number of recent bars (default 400, max 4999).
"Manual Date": User-specified start date.
"Interactive (Chart)": Confirmed start date via input.
"None": Full available history (falls back to max bars).
Optionally, when using "Last X Bars", calculations can pull data from a higher/lower user-selected timeframe via request.security() for multi-timeframe alignment.
A dotted vertical line marks the start point in date-based modes.
Range and Pivot Calculation
Within the selected period:
Highest high and lowest low define the full price range.
Average volume is computed across the period.
Volume-Weighted Pivot: Average close price only from bars where volume > average volume (fallback to simple midpoint if no high-volume bars).
This creates a "smart" central pivot that leans toward areas of greater participation, often aligning with institutional activity.
Fibonacci Level Generation
User-configurable ratios (default: 0.236, 0.382, 0.5, 0.618, 0.786, 1.0, 1.272, 1.414, 1.618).
Levels are calculated symmetrically around the volume-weighted pivot:
Upward: Pivot + (Range × Ratio × Correction Factor) – teal/cyan shades.
Downward: Pivot - (Range × Ratio × Correction Factor) – red shades.
Correction Factor (default 0.5): Scales level spacing for tighter/wider grids without altering ratios.
Only the user-defined number of active lines (default 9) are drawn.
Visual Construction
Central Pivot Line: Thick yellow horizontal line with label showing exact price.
Up/Down Levels: Dashed lines extended into the future, labeled with ratio direction ("Up" or "Dn").
All objects redraw only on the last bar for performance, clearing previous drawings.
Multi-Timeframe Option
When enabled with "Last X Bars":
Pulls high/low/volume data from specified timeframe.
Aligns the pivot and levels to higher-timeframe structure while displaying on current chart – ideal for intraday traders seeking HTF confluence.
How to Use
This tool provides clean, volume-aware Fibonacci grids for identifying potential support/resistance, reversal zones, and targets.
Volume-Weighted Pivot: Often acts as a strong mean reversion level or fair value area.
Upward Levels (Teal): Potential resistance/extensions in bullish moves; watch for reactions on retests.
Downward Levels (Red): Potential support/retracements in bearish moves.
Confluence: High probability when price reacts at levels aligning with other tools (order blocks, pivots, volume profile).
Correction Factor: Lower values (<0.5) for tighter grids in ranging markets; higher (>0.5) for trending markets.
Multi-Timeframe Mode: Use on lower charts (e.g., 15m) with HTF input (e.g., 4H or Daily) to project major structure levels.
Common Setups:
Pullbacks to 0.618–0.786 zones for continuation entries.
Breaks beyond 1.0–1.618 for extension targets.
Reactions near pivot line for mean reversion trades.
Adjust ratios and active line count to match your preferred Fibonacci style (classic retracement vs. extensions).
Disclaimer
This indicator is a technical analysis tool and should be used in conjunction with other forms of analysis. Past performance does not guarantee future results. Always use proper risk management.

Gold Asia Session Highlighter [IST]Here is a polished description and guide for your Gold Asia Session Highlighter. You can use this text for a YouTube description, a Telegram post, or a PDF guide to explain the tool to others.
Gold Asia Session Highlighter (IST) | Visual Indicator
This is a custom TradingView indicator designed to simplify the Gold Asia Strategy. Instead of automating trades, this tool purely handles the visuals. It automatically highlights the correct Asia Session time window (adjusting for Winter/Summer hours) and marks the exact points where you should draw your Fixed Range Volume Profile (FRVP) tool.
Perfect for: Traders who prefer to draw their own FRVP levels manually but want to ensure they are using the exact, error-free time range every single day.
Features
✅ Automatic Time Zone: Strictly calculated using IST (Indian Standard Time), so you don't need to convert time zones manually.
✅ Smart Season Detection: Automatically switches between Winter Session (04:30 – 06:25) and Summer Session (03:30 – 05:25) based on the current month.
✅ Visual Guidance: Highlights the session background and places "START" and "END" labels on the exact candles.
✅ Zero Clutter: Clean visuals with no moving averages or strategy lines—just the session box.
How to Use It
Add to Chart: Apply the script to your Gold (XAUUSD) 5-minute chart. You will see a blue highlighted box appear during the Asia session.
Locate the Labels:
Look for the blue START label (bottom of the candle).
Look for the red END label (top of the candle).
Draw Your FRVP:
Select the Fixed Range Volume Profile tool from your TradingView toolbar.
Click exactly on the START candle.
Drag and release exactly on the END candle.
Trade: You now have the exact Value Area High (VAH), Value Area Low (VAL), and Point of Control (POC) for the day. Use your breakout strategy as usual!

[iQ]PRO Structural Synthesis+Structural Synthesis+ Advanced Topology Analysis
Structural Synthesis+ is a high-fidelity technical analysis tool designed to identify significant institutional market structures using advanced signal processing and topological data analysis. It is built for a sophisticated method for distinguishing between genuine market breakouts and erratic price noise.
Methodology
This tool departs from traditional indicator logic by treating price action as a geometric manifold. It utilizes three core pillars of quantitative analysis to define market structure:
Topological Persistence: Instead of simple peak/valley detection, the script employs principles of persistent homology. It measures the "life span" of a price level relative to local volatility. Only structures that persist beyond a specific statistical threshold are qualified as significant, effectively filtering out "fake" levels created by minor liquidity grabs.
Digital Signal Processing (DSP): The engine features an adaptive denoising algorithm that estimates the true price trajectory in real-time. By minimizing the "lag vs. smoothness" trade-off common in standard moving averages, it provides a cleaner baseline for identifying structural breaks.
Entropy-Based Regime Detection: The script continuously calculates the Shannon Entropy of price movements. This allows the system to determine if the market is in an "Ordered" state (high probability for trend follow) or a "Chaotic" state (high probability for mean reversion or consolidation), adjusting the visual output and signals accordingly.
Key Features
Denoised Structure Mapping: Uses advanced signal processing to plot major support and resistance manifolds that adapt to current market conditions.
Liquidity Cluster Heatmap: Dynamically visualizes zones where significant price action has historically consolidated, highlighting potential areas of high interest.
Chaos vs. Order Matrix: An on-screen dashboard provides a real-time "Entropy" reading, identifying the current market regime.
Structural Gap Identification: Automatically highlights internal liquidity voids (gaps) that often act as magnets for future price action.
Validated Break of Structure (BOS): Generates signals only when a level is breached while the market is in an "Ordered" state, aiming to filter out low-conviction movements.
How to Use
Step 1: Identify the Regime: Check the Info Panel. An "Ordered" status suggests that structural breakouts (BOS) have higher validity, while "Chaotic" suggests a range-bound environment.
Step 2: Monitor Persistence: Look for the thick horizontal manifolds (Yellow for Resistance, Fuchsia for Support). These are your primary zones for institutional supply and demand.
Step 3: Signal Execution: A "BOS" (Break of Structure) label indicates price has successfully breached a persistent level with sufficient momentum and order.
Step 4: Risk Management: Utilize the Liquidity Clusters (Heatmap) to set logical take-profit targets or move stop-losses behind the most recent "Persistent" structure level.
Settings & Configuration
Topology Lookback: Adjusts the historical window used to identify significant price peaks and troughs.
Persistence Threshold: Controls the "strictness" of the structural filtering; higher values result in fewer, but more significant, levels.
DSP Denoising: Toggle the internal signal smoothing engine on or off to suit your preference for reactivity.
Chaos Threshold: Customizes the sensitivity of the Entropy calculation to define when the market enters a "Chaotic" state.
Visual Customization: Toggle the Heatmap, Structural Gaps (Holes), and dashboard visibility.
Past does not guarantee future results
Users discretion, offered for research and study purposes
To obtain access to this script, please see instructions to find where access is granted manually.

TiRadarHUD Radar that provids for the ability to input manual levels in addition to tracking multiple EMAs.

4MA / 4MA[1] Forward Projection with 4 SD Forecast Bands4MA / 4MA Projection + 4 SD Bands + Cross Table is a forward-projection tool built around a simple moving average pair: the 4-period SMA (MA4) and its 1-bar lagged value (MA4 ). It takes a prior MA behavior pattern, projects that structure forward, and wraps the projected mean path with four Standard Deviation (SD) bands to visualize probable future price ranges.
This indicator is designed to help you anticipate:
Where the MA structure is likely to travel next
How wide the “expected” future price corridor may be
Where a future MA4 vs MA4 crossover is most likely to occur
When the real (live) crossover actually prints on the chart
What you see on the chart
1) Live moving averages (current market)
MA4 tracks the short-term mean of price.
MA4 is simply the previous bar’s MA4 value (a 1-bar lag).
Their relationship (MA4 above/below MA4 ) gives a clean, minimal read on trend alignment and directional bias.
2) Projected MA path (forward curve)
A forward “ghost” of the MA structure is drawn ahead of price. This projected curve represents the indicator’s best estimate of how the moving average structure may evolve if the market continues to rhyme with the selected historical behavior window.
3) 4 Standard Deviation bands (predictive future price ranges)
Surrounding the projected mean path are four SD envelopes. Think of these as forecast corridors:
Inner bands = tighter “expected” range
Outer bands = wider “stress / extreme” range
These bands are not a guarantee—rather, they’re a structured way to visualize “how far price can reasonably swing” around the projected mean based on observed volatility.
4) Vertical projection lines (most probable cross zone)
Within the projected region you’ll see vertical lines running through the bands. These lines mark the most probable zone where MA4 and MA4 are expected to cross in the projection.
In plain terms:
The projected MAs are two curves.
When those curves are forecasted to intersect, the script marks the intersection region with a vertical line.
This gives you a forward “timing window” for a potential MA shift.
5) Cross Table (top-right)
The table is your confirmation layer. It reports:
Current MA4 value
Current MA4 value
Whether MA4 is above or below MA4
The most recent BUY / SELL cross event
When a real, live crossover happens on the actual chart:
It registers as BUY (MA4 crosses above MA4 )
Or SELL (MA4 crosses below MA4 )
…and the table updates immediately so you can confirm the event without guessing.
How to use it
Practical workflow
Use the projected SD bands as future range context
If price is projected to sit comfortably inside inner bands, the market is behaving “normally.”
If price reaches outer bands, you’re in a higher-volatility / stretched scenario.
Use vertical lines as a “watch zone”
Vertical lines do not force a trade.
They act like a forward “heads-up”: this is the most likely window for an MA crossover to occur if the projection holds.
Use the table for confirmation
When the crossover happens for real, the table is your confirmation signal.
Combine it with structure (support/resistance, trendlines, market context) rather than trading it in isolation.
Notes and best practices
This is a projection tool: it helps visualize a structured forward hypothesis, not a certainty.
SD bands are best used as forecast corridors (risk framing, range planning, and expectation management).
The table is the execution/confirmation layer: it tells you what the MAs are doing now.

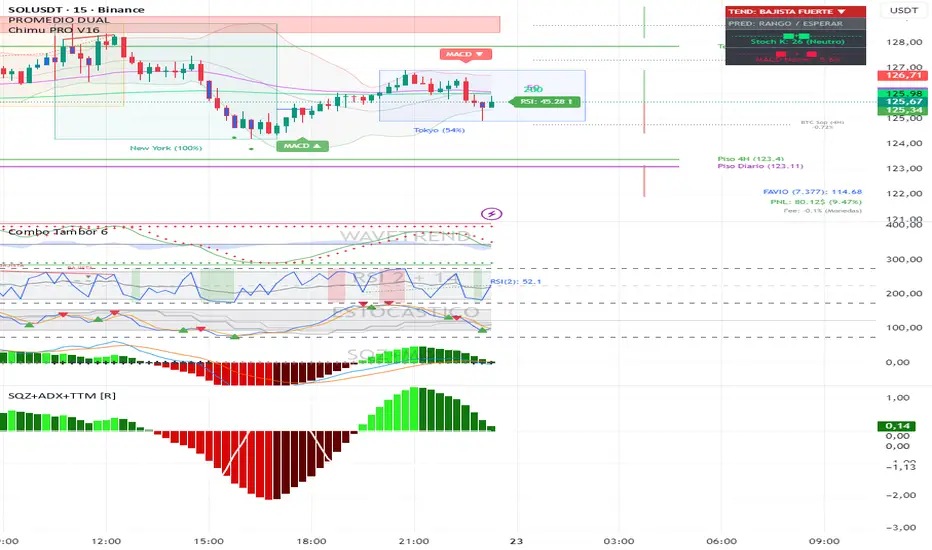
Squeeze + ADX + TTM [V6]Execution speed: The TradingView engine processes v6 scripts much faster.
Stability: By using standard functions like ta.sma or ta.linreg, the indicator is less prone to calculation errors on lower timeframes.
Clarity: I've reorganized the ADX calculation within a function to make it more readable if you decide to modify it later.
Delta Pressure SpectrumWhat this indicator is (brief)
Delta Pressure Spectrum (DPS-3) is a volume-pressure oscillator that estimates buy vs sell imbalance (a delta proxy), then normalizes it into a robust z-score so “significant” pressure means the same thing across different volatility regimes and market conditions. It visualizes that pressure as delta candles + a histogram, and only “lights up” with three breach tiers (plus an ultra-rare white core) when the move is statistically extreme for the current environment.
How to use it:
1) Read it like a pressure gauge, not an entry signal
-Histogram/candle height = intensity of net pressure (buy-dominant vs sell-dominant).
It’s best at telling you: “Is this move real pressure or just price wiggling?”
2) The 3 tiers tell you “how abnormal” the pressure is
-Tier-1 (weak breach): meaningful but common; “something’s happening.”
-Tier-2 (strong breach): rare enough to care; often aligns with real expansions / squeezes / liquidation events.
-Tier-3 (extreme breach): statistically extreme; often shows climactic behavior (either continuation impulse or blow-off/flush conditions).
-White core: only when Tier-3 overshoots hard—treat as “exceptional event.”
Key idea: tiers are adaptive. Tier-2 on BTC 1m and Tier-2 on ES 1h should both represent “strong for that regime.”
3) Best ways to trade with it (high-signal)
-Trend continuation confirmation: In an uptrend, repeated Tier-2/Tier-3 on the up side = real demand; avoid fading unless structure breaks.
-Exhaustion / climax watch: Tier-3 + white core after an extended run = “crowded pressure.” That can precede either: continuation (if structure holds), or reversal / mean reversion (if structure fails).
So you use it as a warning light, then let price structure confirm.
-Compression → expansion detection:
-Quiet baseline for a while, then sudden Tier-2/Tier-3 = expansion regime shift.
-Divergence (use carefully): Price makes new high, DPS-3 fails to reach prior tier intensity → weakening participation. This is most useful on HTFs or at major levels.
4) What the alerts should mean (how you set them)
-Tier-3 breach alerts: your “something serious just hit the tape” alert.
-Pressure flip alerts: best used as contextual reversal confirmation (it requires strong context in your logic).
-White core alert: extremely rare “event mode” notification—use sparingly.
5) One simple rule that keeps you out of trouble
-Don’t fade Tier-2/Tier-3 pressure just because it’s extreme. Fade only when price structure says the move failed (break of trend / reclaim failure / key level loss). DPS-3 tells you strength, structure tells you directional validity.

Volume + VWAP + Prior Session Levels DashboardVolume Spike + VWAP + Session Levels Dashboard
This indicator is a real-time market context dashboard designed to help traders quickly understand participation, value, and key reference levels without cluttering the chart with multiple indicators.
Instead of plotting lines or signals, the script summarizes critical intraday information into a compact on-chart table, allowing traders to make faster, more informed decisions based on how active the market is, where fair value is, and where important reference levels exist.
Core Concepts Used
This script is built on three widely used market principles:
Relative Volume Participation
Volume-Weighted Average Price (VWAP)
Prior Session Reference Levels
The indicator does not attempt to predict direction. Its purpose is to provide objective context that traders can combine with their own strategies.
How the Indicator Works
1. Volume Spike Analysis (Relative Volume)
Rather than showing raw volume, the script measures how unusual the current bar’s volume is compared to recent activity.
A moving average of volume is calculated using a user-defined lookback period.
Current volume is divided by this average to produce a volume multiple (for example, 2.0× normal volume).
This multiple is translated into a descriptive strength label, ranging from Below Threshold to Legendary.
This approach helps traders immediately recognize when participation is significantly above normal, which often coincides with institutional activity, breakouts, or important reactions near key levels.
2. Daily VWAP (Current and Prior Day)
VWAP (Volume-Weighted Average Price) represents the average price traded, weighted by volume, and is commonly used as a measure of fair value.
This script calculates VWAP internally by:
Accumulating price × volume throughout the day
Dividing by total volume
Automatically resetting at the start of each new trading day
The dashboard displays:
Current day VWAP – real-time session fair value
Prior day VWAP – an important reference from the previous session
Traders often use these levels to evaluate whether price is trading at a premium, discount, or near equilibrium.
3. Previous Day High and Low
The indicator also displays:
Previous day high
Previous day low
These levels frequently act as liquidity targets, support/resistance zones, or reaction points, especially during intraday trading sessions.
Dashboard Design
All information is presented in a two-column dashboard showing:
Metric name
Current value or status
The dashboard can be positioned in any corner of the chart and updates in real time, allowing traders to maintain awareness without constantly switching indicators or timeframes.
How to Use This Indicator
This script is best used as a decision-support tool, not a standalone trading system.
Typical uses include:
Identifying abnormally high volume near important price levels
Evaluating price position relative to VWAP
Monitoring reactions around prior day highs and lows
Staying oriented during fast market conditions without chart clutter
The indicator works on any timeframe and adapts automatically to the instrument’s trading session.
Customization Options
Users can:
Adjust the volume moving average length to define what “normal” volume means
Choose the price source used for VWAP calculation
Change the dashboard’s on-screen position
Summary
The Volume Spike + VWAP + Session Levels Dashboard provides a clear, objective snapshot of market conditions by combining participation, value, and reference levels into a single visual tool. It is designed to help traders answer a simple but critical question:
“Is the market doing something meaningful right now — and where?”
This indicator focuses on context, clarity, and usability for traders who want insight without unnecessary complexity.

S&D Trend Pullback StrategyThis is simple indicator for myself to alert me when in trend pullback and entry.
Use in M5 chart.
SL put 30-50pips
TP can set 30-90pips

CCI Standard DeviationCCI Standard Deviation – Asymmetric Volatility-Adjusted Trend Filter (CCI SD)
The Commodity Channel Index (CCI), created by Donald Lambert in 1980, measures how far the typical price deviates from its statistical average to identify cyclical momentum and trend strength.
The standard formula is:
CCI = (Typical Price − SMA(Typical Price, n)) / (0.015 × Mean Deviation)
where Typical Price = (High + Low + Close)/3.
CCI is unbounded and centered around zero: sustained readings above zero indicate bullish momentum, below zero bearish. Classic interpretations often use zero-line crosses or fixed levels (±100, ±200, ±250), but these can be unreliable when CCI volatility changes across market regimes.
This indicator was developed to create a more disciplined trend-following tool that aligns with my core risk principle: “always protect to the downside.”
Starting from the standard CCI zero-line concept for trend direction, I experimented with standard deviation bands to make the oscillator volatility-adjusted. I then applied deliberate asymmetry: requiring the lower 1σ envelope (CCI − stdev) to cross above a positive threshold for bullish confirmation (high-probability entry only in robust trends), while exiting immediately on any raw CCI weakness below a negative threshold (quick downside protection). User inputs for both thresholds were added to allow fine-tuning and adaptability across different assets and timeframes.
An optional DEMA-smoothed version of the lower envelope provides additional clarity when desired.
Extreme zones
raw CCI ±240 and lower envelope > 200 or < –200 - are highlighted with background shading to flag rare acceleration or capitulation phases.
How it works
Standard CCI calculated on typical price (default length 38).
Rolling standard deviation of the CCI itself (default length 13) measures the oscillator’s recent volatility.
Lower envelope = CCI − stdev (dn).
Optional DEMA smoothing (default length 12) can be toggled.
Trend logic:
Bullish regime only when lower envelope
→ Long Threshold (default +10)
→ statistical proof of strength
Bearish/neutral immediately when raw CCI
→ Short Threshold (default –25)
→ fast downside protection
Origin and development
The indicator emerged from wanting a cleaner, more reliable CCI for trend direction. After testing volatility-adjusted versions, the asymmetric design proved superior:
it enters only high-conviction uptrends and exits rapidly on weakness, significantly reducing whipsaws while preserving trend capture.
Parameters were optimized through extensive backtests on major assets (BTC, ETH, SOL and many more Cryptos; Magnificent 7 stocks, QQQ, SPX, gold).
The defaults were selected for the best average Sortino ratio and lowest maximum drawdown across this broad universe, ensuring robustness and avoiding single-asset overfitting.
How to use it
Green triangle below bar
→ lower envelope crosses above Long Threshold
→ high-conviction bullish trend confirmed
→ enter or add to longs
Magenta triangle above bar
→ CCI crosses below Short Threshold
→ exit longs or go cash/short
While lower envelope remains above Long Threshold
→ hold bullish positions
Extreme background shading (dn >200 or CCI ±240)
→ rare high-attention zones (potential acceleration or exhaustion)
Recommended defaults
CCI length: 38
SD length: 13
Long threshold: +10
Short threshold: –25
Optional MA length: 12 (DEMA of lower envelope)
All visual elements (bar coloring, signals, background, smoothed line) are toggleable for personal preference.
This indicator is designed as a trend-strength and risk-management filter and is not intended as a standalone trading system.
Disclaimer:
This is not financial advice. Backtests are based on past results and are not indicative of future performance.

Logarithimic Regression Fib Deviation BandsOverview
This indicator builds a logarithmic regression growth curve and wraps it in Fibonacci-scaled deviation bands to create a long-horizon valuation corridor. It is designed for assets where percentage moves matter more than absolute price moves (for example Bitcoin and other crypto assets), and it remains readable thanks to rainbow band colouring and right-offset labels .
What this indicator does
1) Fits a regression midline in log price space
The midline is a best-fit curve for the asset’s long-term trend
Because the regression is performed on log(price) , the trend behaves in percentage terms rather than linear price terms
This makes the curve suitable for multi-cycle and exponential-growth markets
2) Measures deviation around the midline
The indicator calculates the residual distance between price and the regression midline in log space
A single expanding deviation measure is derived from these residuals
Deviation can be calculated using either:
Expanding standard deviation (smoother, more robust)
Expanding maximum deviation (widest possible corridor)
3) Builds Fibonacci-scaled deviation bands
Upper and lower bands are placed at Fibonacci multiples of the deviation
Included levels:
0.236, 0.382, 0.500, 0.618, 0.786
1.000, 1.272, 1.618, 1.786, 2.000
Extended levels above 2.0: 2.272, 2.414, 2.500, 2.618, 2.720, 3.000
Bands are calculated in log space and then converted back to price space for plotting
4) Keeps the chart clean and readable
Upper bands have individual visibility toggles
Lower bands have:
A master enable / disable switch
Individual per-level toggles
Sensible defaults are used (only the most commonly relevant lower levels are enabled by default)
All labels are offset to the right so they do not overlap current price action
Why this indicator is useful
This tool is designed for context, structure, and regime awareness , not short-term entry signals.
Long-term valuation context
Helps visualise where price sits relative to a fitted growth curve
Cycle extremes
Upper Fibonacci deviation bands highlight historically stretched conditions and potential blow-off zones
Mean-reversion and discount zones
Lower bands highlight historically depressed conditions and deep drawdown regions
Consistency across time
Because the model operates in log space, all distances are interpreted as percentages, making behaviour comparable across multiple cycles
How it works (plain English)
Price is converted to log(price)
A regression is fitted to log(price) using an anchored time axis
Two time modes are available:
Days : log(price) vs linear time (exponential curve in price space)
Log(Days) : log(price) vs log(time), which often behaves like a power-law corridor over very long histories
Residuals (distance from the midline) are measured in log space
A deviation width is calculated from those residuals
Fibonacci ratios are applied to that deviation to create the band levels
Bands are converted back to normal price and plotted
Inputs guide
Model timeframe
Regression and deviation are calculated on a chosen timeframe (default Daily) and displayed on all chart timeframes
Time axis mode
Days = exponential-style trend
Log(Days) = power-law-style trend (often better for very long cycles)
Deviation model
Expanding StdDev = smoother, more statistically robust corridor
Expanding MaxAbs = widest possible corridor
Midline shift (%)
Shifts the entire corridor up or down by a constant percentage (useful for centring the model across different assets)
Lower band controls
Master toggle plus per-level toggles allow you to show only the lower levels that are relevant for the current regime
Label offset
Moves labels into the future by a fixed number of bars so they do not interfere with live price action
Typical usage ideas
Use Log(Days) + Expanding StdDev as a default for multi-cycle assets
Treat upper bands as risk or stretch zones , not automatic sell signals
Treat lower bands as discount or stress zones , not automatic buy signals
Enable deeper lower bands only when price action approaches those regions
Notes and limitations
This indicator is not a prediction tool
Bands evolve as more historical data becomes available
Results may vary depending on the amount and quality of historical data for a given symbol
