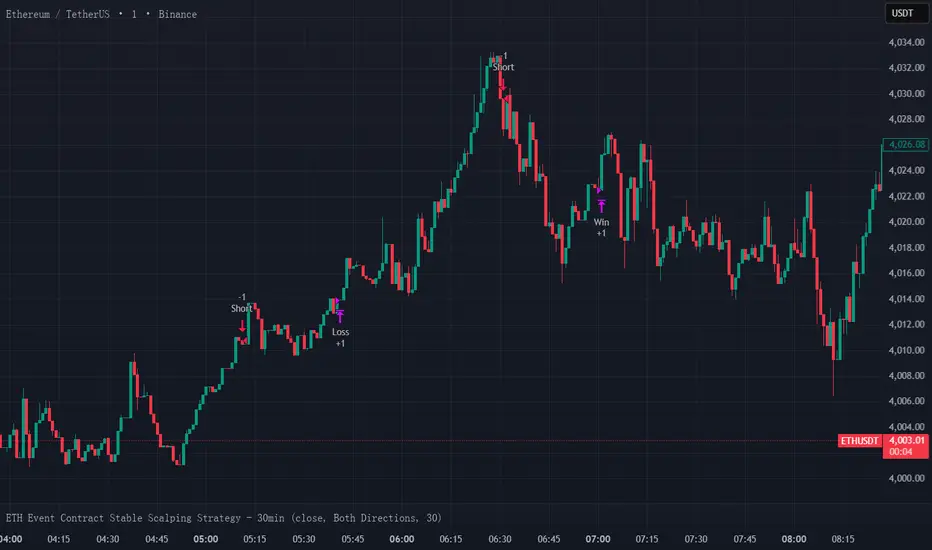
ETH Event Contract Stable Scalping Strategy - 30minKeep using it and you The winning rate of ETH event contract trading is stable at around 60%.ETH事件合约交易,胜率稳定在60%左右。Estrategia Pine Script®por xpzmf881
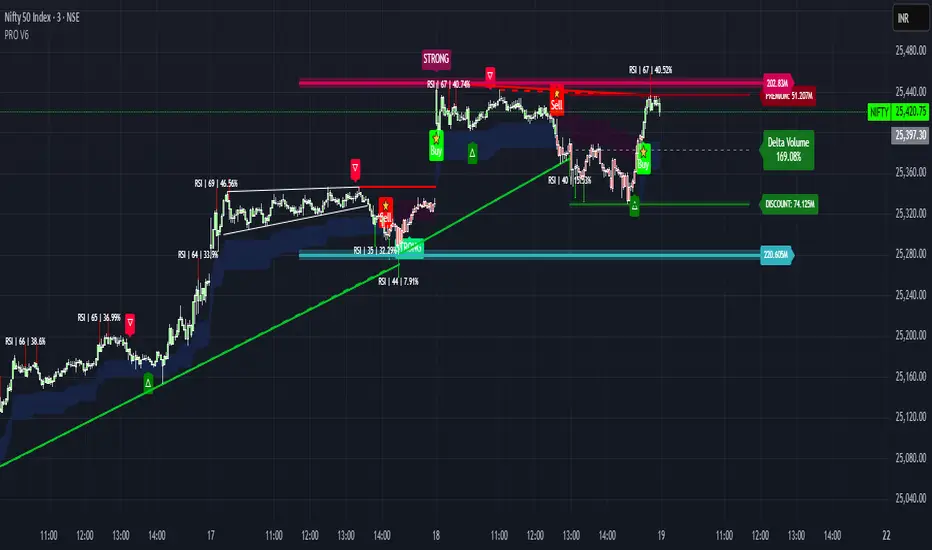
AD4President SMC Strong OB AlertsAD4President SMC Strong OB Alerts – Full Description Overview: The AD4President SMC Strong OB Alerts indicator is a multi-timeframe Smart Money Concepts (SMC) tool designed to help traders identify key Order Blocks (OBs) and potential high-probability areas of support and resistance. Inspired by premium SMC indicators, it focuses on strong OBs while filtering out weaker levels to reduce noise. Features: Strong vs. Weak Order Blocks Strong OBs: Bright green (bullish) or bright red (bearish). Weak OBs: Dimmed green (bullish) or dimmed red (bearish). Only strong OBs trigger alerts, keeping signals clean and high-probability. Multi-Timeframe Detection Works across current timeframe and higher timeframes: HTF1: 4H (configurable) HTF2: Daily HTF3: Weekly Each timeframe’s OBs are visually distinct with unique colors. 50% Midpoint / Equilibrium Line Draws a dashed line at the 50% mark of each order block. Provides a visual reference for the OB’s equilibrium and potential price reaction points. Alerts can trigger when price touches this midpoint for strong OBs. Dynamic Color Coding Strong bullish OB: Bright green Weak bullish OB: Dim green Strong bearish OB: Bright red Weak bearish OB: Dim red HTF OBs have unique color sets to distinguish them easily. Alerts for High-Probability Levels Alerts trigger only for strong OBs when: Price enters the OB Price touches the 50% midpoint of the OB Alerts available for current timeframe and all higher timeframes. Efficient Drawing & Cleanup Supports up to 500 OB boxes, 500 lines, and 500 labels. Automatically deletes old objects to prevent chart clutter. Legend / Visual Guide Shows which colors represent strong/weak OBs for each timeframe. Provides quick reference to understand signals without confusion. How Traders Use It: Identify strong support/resistance levels via bullish and bearish OBs. Spot potential supply and demand zones for entries or exits. Combine with price action, break of structure, and liquidity hunts for advanced SMC trading strategies. Alerts help you stay updated without watching charts continuously. Settings & Customization: lookback: Number of bars to analyze for OB formation. show50: Enable/disable midpoint dashed line. strongOBPct: Threshold for strong OB detection. HTFs: Configure 3 higher timeframes to monitor multi-timeframe OBs. showLegend: Toggle the visual legend. Ideal For: Swing traders, intraday traders, and position traders using Smart Money Concepts. Traders looking to filter high-probability zones while avoiding noise from weaker OBs. Indicador Pine Script®por ADorseystockspaper1114
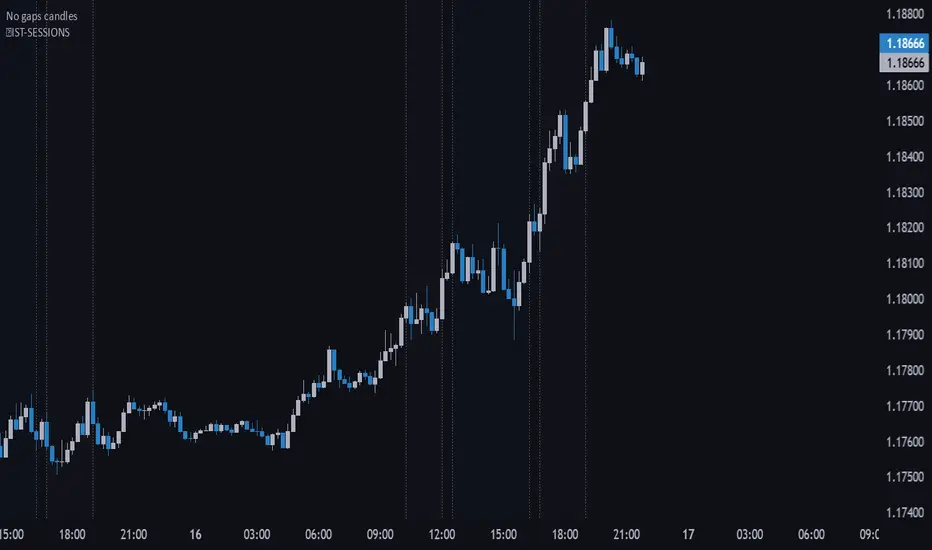
🔵IST-SESSIONS📌 IST-SESSIONS – TradingView Indicator The IST-SESSIONS indicator clearly marks all major trading sessions throughout the day according to your specified schedule, helping traders visualize market activity and plan intraday strategies. It highlights session times and breaks for optimal clarity: Morning Session: 10:15 – 12:00 Midday Break: 12:00 – 12:30 Day Session: 12:30 – 16:15 Afternoon Break: 16:15 – 16:45 Evening Session: 16:45 – 19:00 Evening Break: 19:00 – 20:00 Night Session: 20:00 – 23:00 ✔️ Visualizes multiple trading sessions and breaks ✔️ Helps traders track market activity during specific hours ✔️ Perfect for intraday strategies and session-based analysis ✔️ Makes planning entries and exits easier across different market phases How to use: Apply the indicator to your chart. Sessions and breaks are automatically highlighted according to the schedule. Use the visual cues to optimize your trading strategy for each session.Indicador Pine Script®por Trading_Pfx2
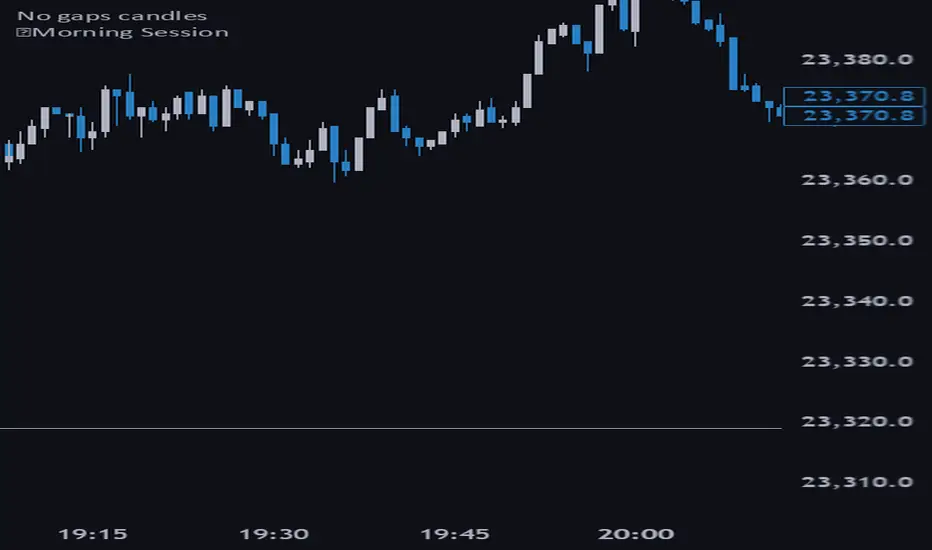
🔵Morning Session📌 Morning Session – TradingView Indicator The Morning Session highlights the time window between 10:00 – 12:00, a key part of the London session when the market gains volume and volatility. The indicator plots the High of Day (HOD) and Low of Day (LOD) formed during this period, giving traders a clear framework to analyze price action and spot potential trading opportunities. ✔️ Focuses on the most active part of the London session ✔️ Marks critical HOD & LOD levels within the morning range ✔️ Useful for breakout or reversal strategies around session highs and lowsIndicador Pine Script®por Trading_Pfx1
Iron Condor Pro v6 – Full EngineIronCondor Engine v6.6 is a multi-mode options strategy tool for planning and managing iron condors, straddles, strangles, and butterflies. It supports both setup planning and live trade tracking with modeled delta, risk-based strike selection, IV rank estimation, and visual breach alerts. Use Setup Mode to preview strike structures based on IV proxy, ATR, delta targeting, and risk tier (High/Mid/Low/Delta). Use Live Mode to track real trades, enter strike/premium data, and monitor live P&L, delta drift, and range status. This script does not connect to live option chains. Volatility and delta are modeled using price history. All strikes and premiums must be confirmed using your broker before placing trades. Best used with strong support/resistance levels and high IV rank (30%+). For educational purposes only. Workflow Guide Use this flow whether you're setting up on Sunday night or any day before placing a trade. Step 0: Pre-Script Preparation Before using the script: Identify major support and resistance zones on your chart. Define the expected range or consolidation area. Use this context to help evaluate strike placement 1. Setup Phase (Pre-Trade Planning) Step 1 – Load the Script Add: IronCondor Engine v6.6 – Full Risk/Decay Edition to your chart Step 2 – Set Mode = Setup This enables planning mode, where the engine calculates strike combinations based on: Your selected risk profile (High, Mid, Low, or Delta) Historical volatility (20-day log return) ATR (Average True Range) Target short delta (adjustable) Step 3 – Review Setup Table Enable Show Setup Table to view calculated strikes and width by risk tier. Adjust any of the following as needed: Target Short Delta Strike Interval ($) Width multipliers (High/Mid/Low) Risk tier under Auto-Feed Choice Step 4 – Evaluate the Setup Is the net credit at least 1.5–2.0x your max risk? Are the short strikes clearly outside support/resistance zones? Are the short deltas between 0.15 and 0.30? Is the range wide enough to handle normal price movement? Step 5 – Prep for Execution Enable Auto-Feed Setup → Live to carry Setup strikes into Live mode Or disable it if you prefer to manually enter strikes later 2. Trade Execution (Live Tracking Mode) Step 1 – Place the Trade with Your Broker Use your brokerage (TOS, Tasty, IBKR, etc.) to place the iron condor or other structure Step 2 – Set Mode = Live In Live mode: If Auto-Feed is ON, the Setup strikes auto-populate If Auto-Feed is OFF, manually enter: Short and long strikes (Call and Put) Premiums collected/paid per leg Total net credit (Entry Credit) Optional: Input current mid prices for each leg in the "Live Chain" section to track live mark-to-market P&L Once all required fields are valid, the script activates: Real-time profit/loss tracking Max risk estimate Delta monitoring on short legs IV Rank estimate Breach detection system Chart visuals (if enabled) 3. Trade Management (During the Week) While the trade is active, use the dashboard and visuals to monitor: Key Metrics: Unrealized P/L % Mark-to-market value vs entry credit Daily decay (theta) Days until expiration Breach status: In Range Near Breach Breached Alerts: Price near short strike → suggests roll Price breaches long strike → breach alert 50% or 75% profit → optional exit signal Delta exceeds threshold → exposure may need adjustment Management Tips: At 50–75% profit: consider closing early If price nears a short leg: roll, hedge, or manage If nearing expiry: decide whether to hold or close If IV collapses: may accelerate time decay or reduce exit value 4. End-of-Week or Expiration Management If Profit Target Hit Close early to reduce risk and lock gains If Still Open Near Expiry Close the position or Hold through expiration only if you're fully prepared for pinning/gamma/assignment scenarios Avoid holding open spreads over the weekend unless part of a defined strategy Reference Notes Strike Width Defined as: Width = Distance between Short and Long strike Used for calculating max loss and breach visuals Delta Guidelines 0.15–0.20 = safer, wider range, lower credit 0.25–0.30 = more aggressive, tighter range, higher credit Use Target Short Delta input to adjust auto-selected strikes accordingly Credit Example Sell Call: $1.04 Sell Put: $0.23 Buy Call + Put wings: $0.14 Net Credit = $1.13 = $113 per contract (max profit) This is the max profit if price stays between short strikes through expiration IV Rank (Estimated) This script does not use options chain IV data. Instead, it calculates a volatility proxy: ivRaw = ta.stdev(log returns, 20) * sqrt(252) IV Rank is then calculated as the percentile of this value within the last 252 bars. High IV Rank (30%–100%) → better premium-selling conditions Low IV Rank (<30%) → lower edge for condors Ideal to sell premium when IV Rank is above 30–50% Disclosures and Limitations This script is for educational use only It does not connect to live option chains All strikes, deltas, and premiums must be validated through your broker Always confirm real-time IV, delta, and pricing before placing a tradeIndicador Pine Script®por renderingnature167
Pro Momentum Table + Trade Alerts📊 Indicator Name: Pro Momentum Table – ADX + DI + ATR + Astro Timing 🧠 Concept: This indicator is designed for professional scalpers and intraday traders who want to capture only strong momentum waves — not noise. It combines trend strength, volatility, directional movement, momentum oscillation, vega divergence, and astrological timing into a single compact table on your chart. ⚙️ Components Explained: Metric Description ADX (Average Directional Index) Measures the strength of the trend. Values above 20 indicate that a meaningful move is starting. +DI / -DI (Directional Indicators) Show whether buyers (+DI) or sellers (-DI) are dominating. Increasing +DI with ADX rising = bullish momentum. Increasing -DI with ADX rising = bearish momentum. ATR (Average True Range) Shows volatility and expected range. Used for setting realistic stop-loss and multi-level targets (1×, 1.5×, 2×, 2.5× ATR). Price Displays the current price level for quick reference. CMO (Chande Momentum Oscillator) Measures short-term momentum direction and strength. Helps identify overbought/oversold conditions in trend continuation. Vega Divergence Shows a synthetic reading of volatility pressure — "Bullish" when volatility expansion supports upward moves, "Bearish" for downward pressure, and "Neutral" otherwise. Astro Remark Suggests ideal time windows based on planetary cycles for scalping entries. “Bullish Window” often aligns with high-probability long trades; “Bearish Window” favors shorts. Trade Signal The core momentum condition: “Bullish Momentum” if ADX > 20 and +DI rising, “Bearish Momentum” if ADX > 20 and -DI rising, else “No Clear Momentum.” 📈 How to Use: Wait for ADX > 20 – This confirms that the market is entering a strong momentum phase. Check DI direction: ✅ +DI rising: Buyers gaining strength → look for long setups. ✅ -DI rising: Sellers gaining strength → look for short setups. Use ATR to plan exits: 🎯 TP1 = Entry ± 1 × ATR 🎯 TP2 = Entry ± 1.5 × ATR 🎯 TP3 = Entry ± 2 × ATR 🎯 TP4 = Entry ± 2.5 × ATR CMO & Vega Divergence: Confirm momentum direction and volatility expansion before committing. Astro Remark: Align your scalping activity with the planetary support window for higher probability trades. 🪙 Pro Tips for Scalpers: Only trade when ADX > 20 and DI is consistently rising. Ignore signals in choppy or sideways phases. Avoid trades if Vega is neutral and CMO is flat – these usually indicate fake breakouts. If targets aren’t hit within expected ATR-based time, treat the move as false and exit early. Combine with 9 EMA and 20 EMA (hidden) for wave structure confirmation without cluttering the chart. 💡 Summary: This indicator acts as a real-time trade decision dashboard. It removes clutter from the chart and delivers everything a professional scalper needs — strength, direction, volatility, momentum, timing, and actionable trade bias — all in one elegant table.Indicador Pine Script®por maheshdevne84
Baseline Buy/Sell Alerts (v6) - FixedGood for indexes,metals and cryptos Thanks Universe Thanks AngelsIndicador Pine Script®por FinixFly8
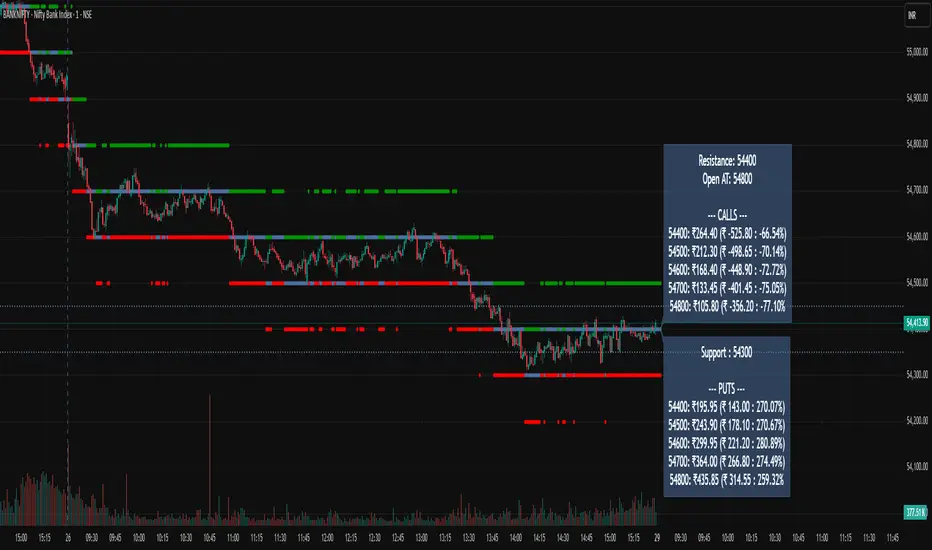
BankNifty Radar @BhupiXBankNifty Radar This indicator automatically detects and plots the most important support and resistance zones where markets often show reversal or breakout moves. These levels are based on key price reactions and are highly useful for identifying potential big moves in Index, Futures, and Options Charts. 🔹 Key Features Auto-detection of major support & resistance levels Works across Index, Futures & Options Charts Highlights zones where strong reversal or breakout is likely Helps traders plan entries, exits, and stop-loss levels Ideal for intraday as well as positional trading 🔹 How to Use Use support levels to identify buying opportunities during pullbacks Use resistance levels to spot selling opportunities or possible breakouts Combine with volume/momentum indicators for higher accuracy Options traders can use these levels to select ATM/OTM strikes with better conviction ⚡ This tool is designed to give traders a clear view of where the market is likely to react, making it easier to catch big moves after reversals or breakouts. This indicator tracks & Draw BankNifty Index & options important support and resistance levels and 10 options Strikes Live prices & Price Change and price change in % in one place. This Indicator Work Only BankNifty Index ,Futures & Option Strike charts charts. 📌 Financial Disclaimer This indicator is created for educational and informational purposes only. It does not constitute financial or investment advice. Past performance is not indicative of future results. Trading in stocks, futures, and options involves substantial risk of loss and may not be suitable for all investors. Please consult with your financial advisor before making any trading or investment decisions. Use this indicator at your own risk.Indicador Pine Script®por Bhupix3
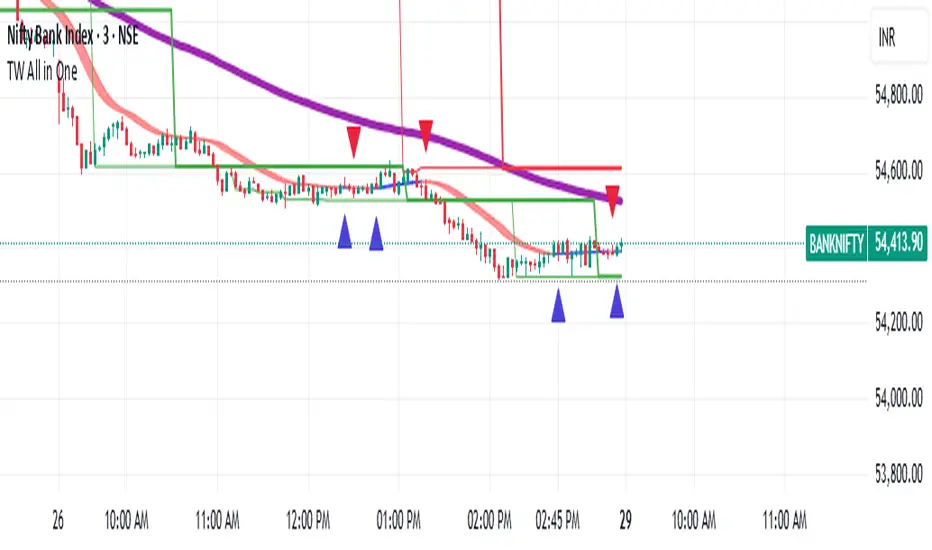
TW All in OneIts a overlap strategy, giving signals for buy and sell. Mostly suitable for Bank Nifty. Nifty and crude oilIndicador Pine Script®por amiyashankar47
1m OPTION BUY_Multi indi-01 (P) SEMI AUTOEnter every monday choose the option price range between 50 tp 100 , set strategy for a week or 3 three days, set upper limit 120 and lower limit 30 and input your own contract size and all parameters as you wish, and execute the alert (this is how the strtegy made). if you dont have any idea of market direction execute this strtegy for put and call both. be aware this strategy may incurred loss . we r not recomending to use this strategy , this is for education purpose only, watch and analyze then take your own decision. Indicador Pine Script®por IQ2869Actualizado 229
Tristan's Star: 15m Shooting Star DetectorThis script is designed to be used on the 1-minute chart , but it analyzes the market as if you were watching the 15-minute candles. Every cluster of 15 one-minute candles is grouped together and treated as a single 15-minute candle. When that 15-minute “synthetic” candle looks like a shooting star pattern (small body near the low, long upper wick, short lower wick, bearish bias), the script triggers a signal. At the close of that 15-minute cluster, the script will: Plot a single “Sell” label on the last 1-minute bar of the group. Draw a horizontal line across the 15 bars at the high, showing the level that created the shooting star. Optionally display a table cell in the corner with the word “SELL.” This lets you stay on the 1-minute timeframe for precision entries and exits, while still being alerted when the higher-timeframe (15-minute) shows a bearish reversal pattern.Indicador Pine Script®por OhRayOhRay11217
J. YOUNG INDICATOR (2)QUICK REFERENCE to help with a PRICE FOR OPTIONS and or B/H entry MEDIAN PRICE of the MONTHLY/QUARTERLY aVWAPS to get a more accurate price point Indicador Pine Script®por Jyoungtx211134
Smash + Proba + BF + VWAP + VP + SessionsVWAP Addition Yearly, Monthly, Weekly and Daily. Session boxes addition and volume and range in theses boxes. Volume Profile in developpementIndicador Pine Script®por Jerem_KiKActualizado 22
Vortex Filter PATThe Vortex Filter is your guide to smarter trend trading and position scaling. This indicator goes beyond simple buy/sell signals by identifying a critical zone for potential averaging, allowing you to improve your position and risk management in real-time. A clear 'Long' or 'Short' signal is generated when a new trend is confirmed. When the price pulls back into the specially defined averaging zone, you receive a signal to "BUY" or "SELL" consider adding to your position. This two-tiered approach to market entry and management is a game-changer for traders who want to build profitable positions and manage risk effectivelyIndicador Pine Script®por Impextejas04114
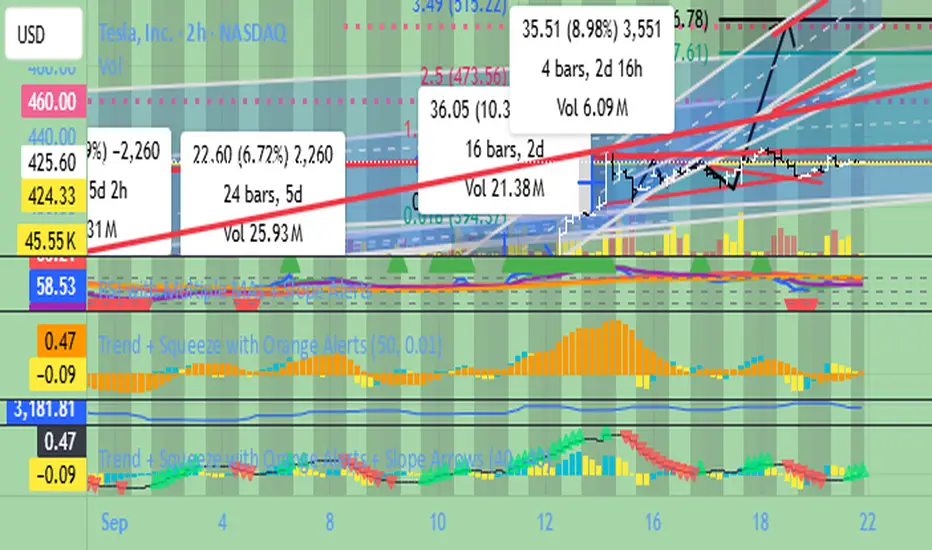
Trend + Squeeze High VolatilityGood for High Volatility Stocks and Options Trend and Squeeze High Volatility Good For High Volatility Stocks and OptionsIndicador Pine Script®por kevinchow36016
Navkar Finalthis script uses macd, rsi, stochastic, moving average, ATR, Bollinger bands and many other indicator to check if possible entry exit conditionsIndicador Pine Script®por AkshayShah998
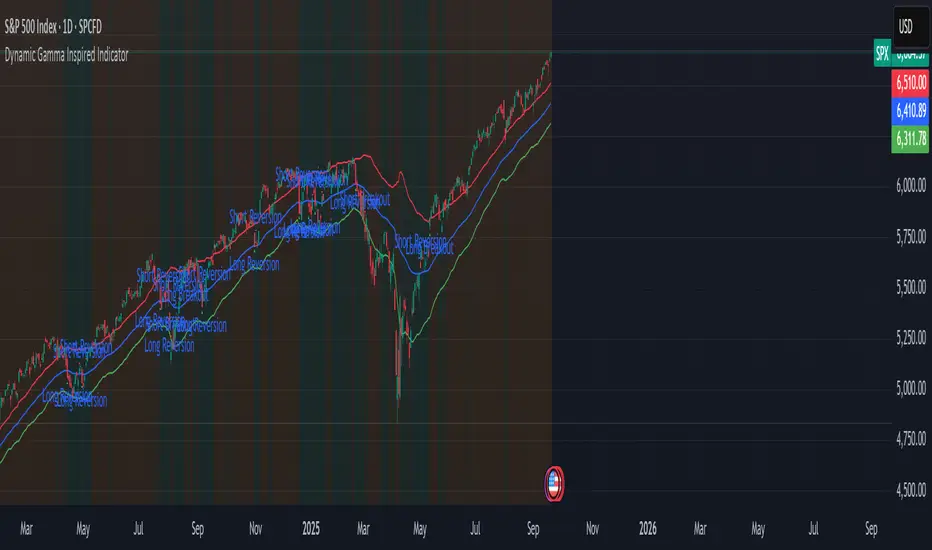
Dynamic Gamma Inspired IndicatorDynamic Gamma Inspired Indicator This indicator identifies potential market regime shifts between low-volatility (mean-reverting) and high-volatility (trending) environments by using a dynamic, volatility-adaptive framework inspired by options market gamma exposure concepts. Core Concepts This indicator uses a volatility-based model that mimics how market maker hedging can influence price stability and volatility. While it's not possible to calculate true Gamma Exposure (GEX) in Pine Script without external options data, this script uses the Average True Range (ATR) as a proxy to create dynamic zones that adapt to current market conditions. Positive Gamma Environment (Green Background) When price is contained within the upper and lower walls, it suggests a period of stability where market makers' hedging may suppress volatility. In this "mean-reversion" regime, prices tend to revert to the central pivot. Negative Gamma Environment (Orange Background) When price breaks outside the walls, it signals a potential increase in volatility, where hedging can amplify price moves. This "trend-amplification" regime suggests the potential for strong breakout or trend-following moves. How It Works The indicator is built on three key components that dynamically adjust to market volatility: Dynamic Pivot (Blue Line) An Exponential Moving Average (EMA) acts as the central "zero gamma" pivot point. Dynamic Walls (Red & Green Lines) These upper and lower bands are calculated by adding or subtracting a multiple of the Average True Range (ATR) from the central EMA pivot. This is similar to how Keltner Channels use ATR to create volatility-based envelopes. The walls expand during high volatility and contract during low volatility. How to Use This Indicator The indicator automatically plots signals based on the current market regime: Mean-Reversion Signals (Inside the Walls) Long Reversion: Appears when the price crosses up through the central pivot, suggesting a potential move toward the upper wall. Short Reversion: Appears when the price crosses down through the central pivot, suggesting a potential move toward the lower wall. Breakout Signals (Outside the Walls) Long Breakout: Appears when the price breaks and closes above the upper wall, signaling the start of a potential uptrend. Short Breakout: Appears when the price breaks and closes below the lower wall, signaling the start of a potential downtrend. Customization You can tailor the indicator to different assets and timeframes by adjusting the following inputs: Central Pivot EMA Length: Determines the period for the central moving average. ATR Length for Walls: Sets the lookback period for the Average True Range calculation. ATR Multiplier for Walls: Adjusts the width of the channel. A larger multiplier creates wider walls, filtering out more noise but providing fewer signals. Disclaimer: This indicator is a tool for analysis and should not be used as a standalone trading signal. Always use proper risk management and combine it with other analysis methods. Past performance is not indicative of future results. Indicador Pine Script®por guttimg27
Option Strike Previous Day high and LowThis script automatically plots the previous day’s High and Low levels for a selected Call (CE) and Put (PE) option contract. It is designed to help options traders quickly identify important price zones without having to fetch or calculate them manually. Mandatory to Input expiry like. YYMMDD Mandatory to Input Strike like. 25350 ✨ Key Features: • Automatically requests previous day High/Low for CE and PE of the chosen strike. • Full-width horizontal lines for clear visibility across the entire chart. • Configurable appearance: dashed/solid lines, custom width, and label placement (left/right). • Optional manual level input for custom support/resistance marking. • Debug mode available to show the tickers and requested values. ⚙️ How to Use: 1. Choose the underlying root (e.g., NIFTY), expiry (YYMMDD), and strike price. 2. Select whether you want to show CE, PE, or both. 3. Adjust label offset to position tags near the chart’s right edge. 4. Use the manual level input if you want to mark an additional reference line. 💡 Why it’s useful: Option traders often rely on previous day’s option Highs and Lows as intraday reference zones for support, resistance, and breakout levels. This script makes those levels instantly visible and consistently updated, saving time and reducing manual charting errors. 📌 Notes: • Works on any timeframe chart of the underlying. • For best use, apply on the underlying index/stock chart, not on the option itself. • This script does not generate trading signals or make predictions; it provides levels for reference. Indicador Pine Script®por vinothblr20151130
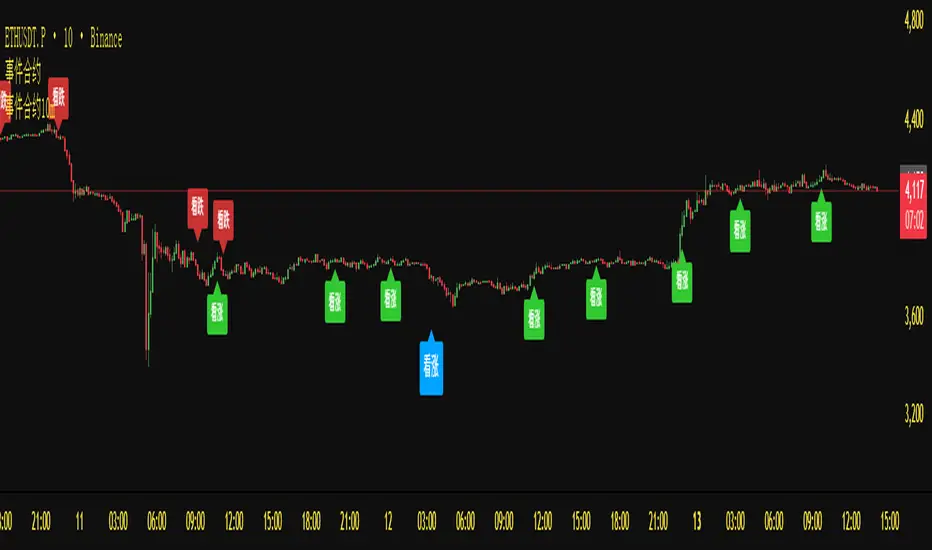
RSI+VOL——Binary(One bar)Overview This indicator integrates Stochastic RSI, MACD trend alignment, ADX trend strength, and multi-dimensional volume analysis to provide intelligent signal guidance and market activity monitoring. It is suitable for short-term, swing, and event-driven trading, offering clear visualization of trend direction, market strength, and volume anomalies. Core Features 1️⃣ Stochastic RSI Signals Automatically identifies overbought and oversold conditions to generate buy and sell reference signals. Signals are filtered with candle closing direction to reduce counter-trend entries. 2️⃣ MACD Trend Alignment Signals trigger only when MACD trend direction aligns with Stochastic RSI, improving accuracy. Real-time trend alignment reduces noise from ranging markets. 3️⃣ ADX Trend Strength Filter Signals trigger only when ADX indicates a significant trend, filtering out low-strength movements. Helps capture primary market directions. 4️⃣ Multi-Dimensional Volume Analysis Differentiates bullish and bearish volume to identify breakout signals. Relative volume (RVOL) ensures signals occur during periods of active trading. Background highlights abnormal spikes and extreme volume, clearly reflecting market activity. 5️⃣ Signal Visualization and Alerts Buy and sell labels with corresponding RSI values are displayed on the chart. Built-in alert conditions support TradingView notifications and strategy integration. Indicator Value Multi-dimensional alignment: combines trend, momentum, and market activity for comprehensive assessment. High-precision signal reference: filters noise and provides clear entry indications. Market activity monitoring: highlights extreme volume to reflect market participation. Broad applicability: suitable for short-term, swing, and event-driven trading across various markets.Indicador Pine Script®por HunterX8869Actualizado 1122
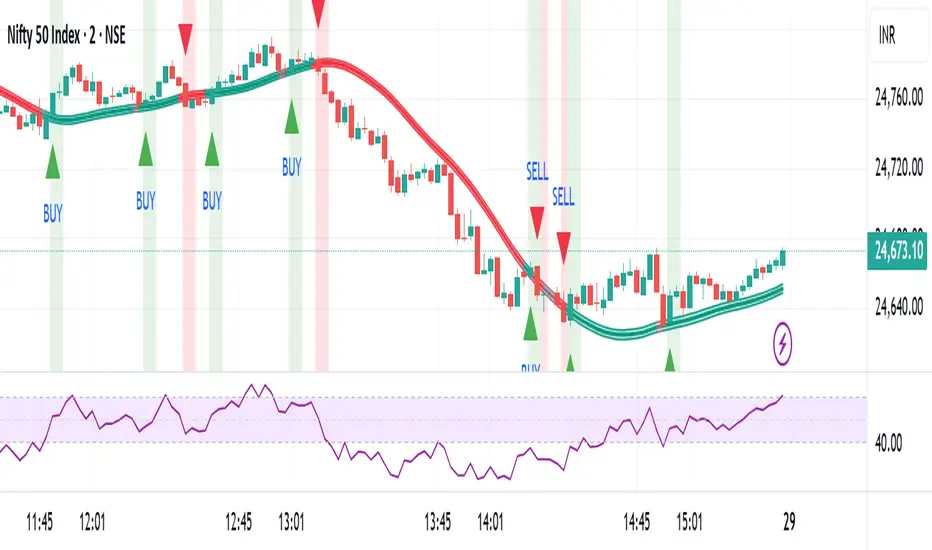
Option Trend for Nifty & Bank Nifty (Indian Market)This is an advanced multi-system trading indicator for TradingView, offering a comprehensive suite of tools for technical analysis and trading decision support . Main Features Trendline Detection: Identifies bullish and bearish trendlines automatically using swing highs and lows, with optional labeling of key price structure (Higher Highs, Lower Lows, etc.) and customizable line colors and styles. Signal & Trend Systems: Includes both a crossover signal system (for buy/sell entries) and a multi-period trend-following system, which uses enhanced moving averages and dynamic trailing levels to adapt to different market conditions. Supply & Demand Zones: Automatically detects and marks potential supply and demand zones based on pivot structures and ATR buffers, helping spot logical areas for price reaction or reversal. Support & Resistance: Plots periodic support/resistance and macro (long-term) levels, with user-defined periods and the ability to visualize volume delta for each zone. Theil-Sen Estimator: Optionally adds a statistical regression channel using the robust Theil-Sen method to identify trend direction and breaks for long-term analysis. RSI/KDE Analysis: Implements relative strength index (RSI) analysis with kernel density estimation (KDE) to detect pivot points with probability labeling and color-coded signals for high-confidence reversals. Dashboards & Alerts: Provides multitimeframe dashboards summarizing trend, EMA signals, and momentum across up to five timeframes, plus integrated alerting for all major events (entries, exits, zone breaks, etc.). Customization & Usability Extensive input settings for periods, color themes, line widths, and label visibility. Can display visual cloud bands, trend ribbons, and supply/demand boxes as overlays on price charts for enhanced clarity. Open-source and for educational use under permissive licensing, not affiliated with TradingView. This indicator is designed to deliver a full-featured market map, combining price action, trend, support/resistance, and probabilistic signals for discretionary or semi-automated trading.Indicador Pine Script®por balagan9323
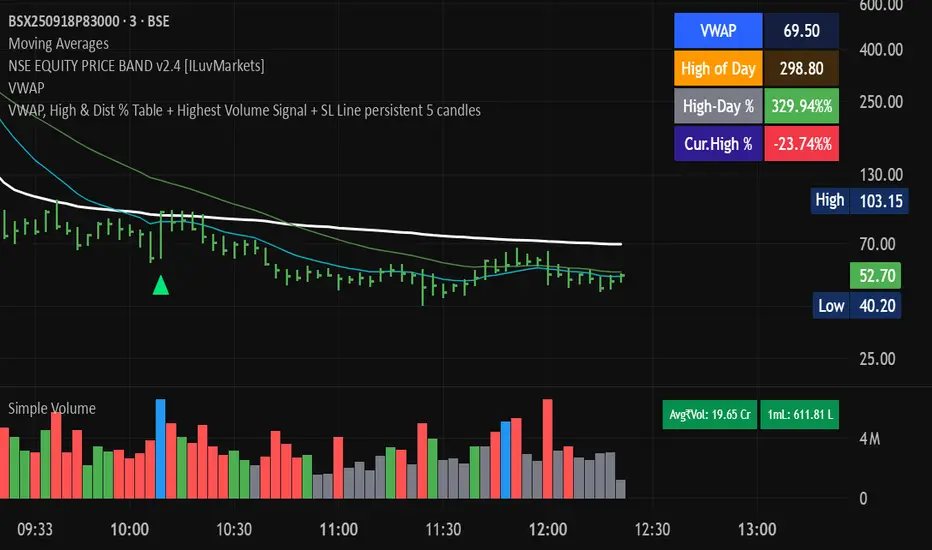
VWAP, High & Distance % Table + Highest Volume Signal I want the value of VWAP, High of the Day and Distance of VWAP from the highs to judge for an Entry if possible.Indicador Pine Script®por nikhilmehta687Actualizado 18
Gabriel's Triple Impulsive Candle DetectorTriple Impulsive Candle Detector Overview, critical for catching impulse moves in either direction. SPX Income System is a rule-based framework designed to identify frequent, high-probability income opportunities on the S&P 500 cash index (SPX/SPY) using 0-DTE credit spreads. The core engine operates on 30-minute Impulse bars during the morning trade window and can be extended with optional modules for afternoon, overnight, and weekly swing opportunities. The methodology centers on a single, mechanical price event called a Impulse Bar (small wick to body ratio) to minimize discretion and keep execution consistent. 🔶What’s Inside Core Strategy: SPX Daily Income Timeframe: 3 kinds of 30-min bars. Window: 09:30–11:30 ET (new setups only) Instrument: SPX (cash index, XSP/SPY), executed with $5-wide credit spreads on 0-DTE SPX options Bullish Setup Entry on the break of setup bar high Use an at the money put credit spread Bearish Setup Entry on the break of setup bar low Use an at the money call credit spread Intent: Enter shortly after setup; manage to >80% max profit or EOD expiration if SPX. If it's another stock, then a 1.5~2x D ATR is suggested. Signal: An Impulse Bar that closes at/near the high (bullish) or low (bearish) of its 30-min range, verified with Volume above average. Risk—limited to the risk of the option spread. The spread is 5 dollars wide The premium collected is $2.50 $5 - 2.50 = $2.50, or the breakeven point. Which means what's left is the risk involved. The risk is $2.50 per spread 🔶Why the 30-Minute Chart? The 30-minute bar is the “chart of choice” because it filters noise and aligns with morning institutional flows. On alternate timeframes, price often retraces half the candle body before following through. On the 30m: the follow-through is more consistent, especially with 2x volume confirmation. Adding support/resistance levels at the impulse bar hl2 strengthens execution. This strategy has roots in MTF Crypto, and SPX/SPY TPO-Order Block logic. 🔶Bonus Examples: 🔹Afternoon SPX Income Second chance window (typically 14:00–15:00 ET) if the morning trade has exited, 60-min bars instead. 🔹ORB 30 – Opening Range Break (first 30 min) Classic ORB with an income twist for early action when time is limited. This can be entered on the 15 minute candle break. 🔹ORB 60 – Opening Range Break (second 30 min) A follow-up ORB variant for traders who miss the first window, verified on a 60-min chart. Enter on the final 3 minutes of the hourly candle or wait for a pullback. 🔹B&B – Bed & Breakfast (Overnight) Identifies income setups via the 10-minute chart in the last 30–60 minutes of the session with next-day open as the exit. 🔹JB – Just Breakfast Uses the prior day’s end-of-day setup to enter at the opening bell, then manages into the daily income flow. I trade 0-date, and selling an ITM spread either partially or fully then gives me a head start on the daily income potential. This may work better if you either roll or the ORB 30 also meets the criteria. 🔹All-Day-Scalper Converts income logic into 30-minute scalps using deep 75/80 delta ITM options as synthetic stock (requires >PDT). Meaning that the option will behave as if it is stock. This strategy comes with a warning: it's better if you can day trade. 🔹Tag ’n Turn—Weekly SPX Income Swing Weekly swing overlay using 30-min Pulse Bars + Bollinger Bands (50) for 3–7 day swings and as a filter for daily income alignment. I use the TTM Squeeze and obtain similar results. Target heuristics (directional days) with a fired squeeze. Part of my Gamma Scalping System. 🔶The Impulse Bar (10~40% Wick to Body Bar) An Impulse Bar is a candle that: Bullish: Closes higher than it opens and within the top ~10% of its high-low range. Bearish: Closes lower than it opens and within the bottom ~10% of its high-low range. Practical tip: Many traders mark 0-10-80-100% levels on the candle range (custom Fib or ruler) to quickly validate Pulse Bars. If it's accompanied by a volume spike, then it's better quality. 🔶SPX Daily Income—Rules & Execution 🔹Rules Chart: 30 min, no indicators required. Pure PA, TPO-based strategy. New Setups: 09:30–11:30 ET Instrument: SPX signals, executed via SPX 0-DTE credit spreads ($5 wide, $2 for SPY) 🔹Entries Bullish: Enter on a break of the setup bar high, use ATM put credit spread Bearish: Enter on a break of the setup bar low, use ATM call credit spread 🔹Exits Primary: Close at >80% of max profit (credit received) Alternate: Hold to EOD expiration Stop: Risk of the spread (defined by width – credit) Target Heuristics (directional days) Optional: 1.5–2× ATR as a reference (mirrors directional follow-through that often accelerates the >80% outcome) Credit Guidance (typical) OTM short strike ≈ $2.40 ITM short strike ≈ $2.50–$2.80 2× ITM short strike ≈ $2.80–$3.00 Trade Management (PDT-Aware) If under PDT, many prefer set-and-forget with GTC buy-back (e.g., $0.20) or EOD expiration. 1:00 PM ET time check Trending day ±$15–$20 SPX: usually no action, run to expiration Non-trending day ±$5 SPX: consider taking 40–60% if available (optional) to avoid 50/50 end-of-day decay dynamics Rationale: Without a favorable trend by ~1 PM, the odds of a late push decline; choosing a controlled partial outcome can improve long-run expectancy and reduce variance. 🔶Examples (Conceptual) 🔹Bullish: A green dot marks a bullish impulse bar; minor follow-through pushes the spread to >80% quickly. 🔹Bearish: A red triangle marks a bearish Impulse Bar; a modest down move is often sufficient for >80–95%. 🔹Tag ’n Turn—Weekly Swing (Filter & Stand-Alone) Chart: 30-minute Overlay: Bollinger Bands 50 (mean-reversion lens), or KC or TTM. Setup: Tag of upper/lower band + Pulse Bar, enter on break of Pulse Bar in that direction Target: Opposite Bollinger Band Use Case: 3–7 day swings and a directional filter for Daily Income signals (trade with weekly bias) 🔹Afternoon SPX Income: Same Pulse logic, 14:00–15:00 ET window. 🔹ORB 30 / ORB 60: Uses 30/60-min opening range; can relax Pulse threshold (up to 40% bars) for early positioning when time-constrained. 🔹B&B (Overnight): Lasts 30–60 minutes; closes the next day at open or after the first 30-minute bar. 🔹JB (Just Breakfast): Enter at open using prior day’s signal; optionally roll into Daily Income if eligible. 🔹All-Day-Scalper: Deep ITM options (~0.75–0.80 delta) as synthetic stock. Entry: Long ITM option Stop: ~40% of option price Target: 70–150% or 30-minute timed exit Note: Time-intensive; for accounts above PDT. 🔹Brokerage: Must efficiently support SPX options; a <10% spread between OI and Volume is ideal. Preferences vary; Tastytrade, Thinkorswim, and Interactive Brokers are common choices. Use what’s reliable, available in your region, and cost-effective. 🔶Alerts (Check-in) Bullish Impulse Detected (within 09:30–11:30 ET) Bearish Impulse Detected (within 09:30–11:30 ET) Afternoon Pulse (14:00–15:00 ET) ORB 30/60 Trigger B&B Window Open (last 60 mins) JB at Open Tag ’n Turn: Band Tag + Impulse (Bull/Bear) 🔶Inputs (Typical) Session windows (morning, afternoon, last hour) ~5~15 Average Bar Impulse threshold (strict 10% vs relaxed up to 40% for ORB variants) Marker/label styles (bull/bear colors, dots vs arrows) Filters (optional ATR TP, band touch BB(50-SMA, 2 Stdv.) for Tag ’n Turn) Alert toggles (on-close for webhooks) 🔶Best Practices One playbook, many Doors: Start with daily income; add afternoon or B&B/JB only after you’re consistent. Credit discipline: Don’t chase poor pricing; stick to the credit guidance. Time awareness: If no trend by ~1 PM ET, consider variance control. Weekly bias: When using Tag ’n Turn, align daily trades with the weekly swing direction for added confluence. Risk is defined as width – credit = max risk per spread. Size, accordingly, 1~2%. 🔶Disclosures & Risk This is not financial advice. Options involve risk and are not suitable for all investors. Past performance (including backtests or theoretical studies) does not guarantee future results. Slippage, fills, assignment risk, and latency can materially impact outcomes. Trade a plan you fully understand and always size for durability. On the Daily, the Impulse bars, are often a signal that you should plan for it to return back to half of the Candle's body, and plan accordingly. Plot a horizontal support/resistance level and see how price reacts to it. Keep house-money, and use 1~2% Risk, reduce exposure when VIX is low and increase it when VIX is high. TL;DR (Summary) Signal: 30-min Pulse Bar (strict 10% close in range) Window: 09:30–11:30 ET (new setups) Execution: 0-DTE $5-wide SPX credit spreads Exit: >80% max profit or EOD Add-ons: Afternoon, ORB 30/60, B&B/JB overnights, All-Day-Scalper, Tag ’n Turn weekly swing/filter Philosophy: Fully rule-based, minimal discretion, production-line consistency 0-date.Indicador Pine Script®por GabrielAmadeusLau1128
Implied Volatility RangeThe Implied Volatility Range is a forward-looking tool that transforms option market data into probability ranges for future prices. Based on the lognormal distribution of asset prices assumed in modern option pricing models, it converts the implied volatility curve into a volatility cone with dynamic labels that show the market’s expectations for the price distribution at a specific point in time. At the selected future date, it displays projected price levels and their percentage change from today’s close across 1, 2, and 3 standard deviation (σ) ranges: 1σ range = ~68.2% probability the price will remain within this range. 2σ range = ~95.4% probability the price will remain within this range. 3σ range = ~99.7% probability the price will remain within this range. What makes this indicator especially useful is its ability to incorporate implied volatility skew. When only ATM IV (%) is entered, the indicator displays the standard Black–Scholes lognormal distribution. By adding High IV (%) and Low IV (%) values tied to strikes above and below the current price, the indicator interpolates between these inputs to approximate the implied volatility skew. This adjustment produces a market-implied probability distribution that indicates whether the option market is leaning bullish or bearish, based on the data entered in the menu: ATM IV (%) = Implied volatility at the current spot price (at-the-money). High IV (%) = Implied volatility at a strike above the current spot price. High Strike = Strike price corresponding to the High IV input (OTM call). Low IV (%) = Implied volatility at a strike below the current spot price. Low Strike = Strike price corresponding to the Low IV input (OTM put). Expiration (Day, Month, Year) = Option expiration date for the projection. Once these inputs are entered, the indicator calculates implied probability ranges and, if both High IV and Low IV values are provided, adjusts for skew to approximate the option market’s distribution. If no implied volatility data is supplied, the indicator defaults to a lognormal distribution based on historical volatility, using past realized volatility over the same forward horizon. This keeps the tool functional even without implied volatility inputs, though in that case the output represents only an approximation of ATM IV, not the actual market view. In summary, the Implied Volatility Range is a powerful tool that translates implied volatility inputs into a clear and practical estimate of the market’s expectations for future prices. It allows traders to visualize the probability of price ranges while also highlighting directional bias, a dimension often difficult to interpret from traditional implied volatility charts. It should be emphasized, however, that this tool reflects only the market’s expectations at a specific point in time, which may change as new information and trading activity reshape implied volatility.Indicador Pine Script®por QuantitativeAlpha11164