ATM Pulse (Arjo)ATM Pulse (Arjo) — Real-Time ATM Options Sentiment & Trend Strength Indicator
Overview
ATM Pulse (Arjo) is an options analytics and trend overlay tool that automatically detects the At-The-Money (ATM) strike for NIFTY, BANKNIFTY , or any selected stock.
It merges Call–Put Volume Ratio (CPVR) sentiment analysis with a Chandelier Exit trend overlay to help traders visualize both market bias and trend direction in a single chart.
Concepts & Logic
ATM Auto Detection
The script calculates the current ATM strike by rounding the underlying’s price to the nearest strike interval (e.g., 50 for NIFTY, 100 for BANKNIFTY). It then requests live option-chain data for that strike.
Call–Put Volume Ratio (CPVR)
The Call-Put Volume Ratio (CPVR) is calculated as the call volume divided by the put volume.
CPVR > 1.25 → Bullish dominance (Calls stronger)
CPVR < 0.75 → Bearish dominance (Puts stronger)
0.75–1.25 → Neutral sentiment
This ratio helps interpret real-time option-market positioning.
Chandelier Exit Trend Overlay
Using Average True Range (ATR) , the overlay plots dynamic trailing stops and visual trend zones:
🟢 Green: Uptrend continuation zone
🔴 Red: Downtrend continuation zone
A color change signals possible momentum reversal.
Combination of CPVR and Chandelier Exit
CPVR gauges option-market sentiment
Chandelier Exit confirms price-action direction
When both align (e.g., bullish CPVR + green Chandelier zone), it strengthens directional conviction. Divergent readings may signal indecision or early reversals.
How to Use
Open any NIFTY, BANKNIFTY , or stocks chart.
Add ATM Pulse (Arjo) to the chart.
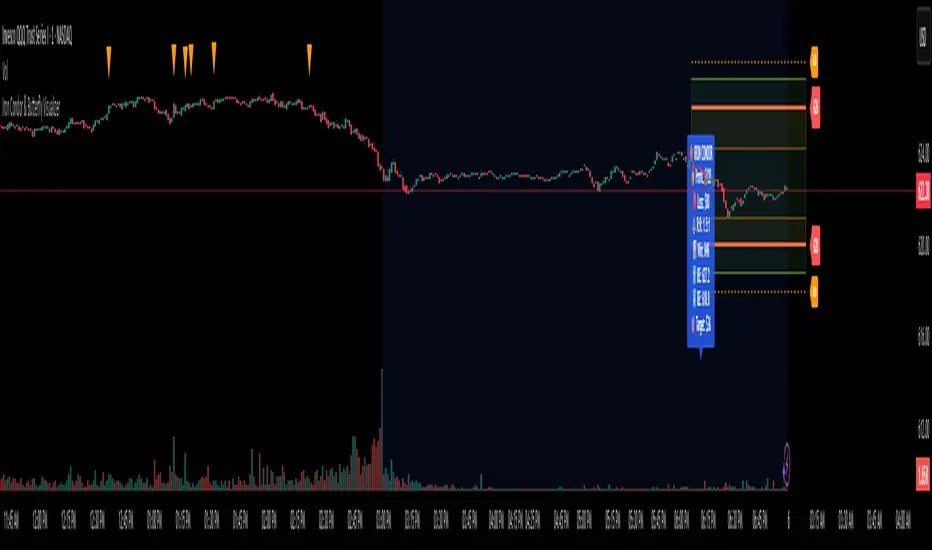
Select your expiry date — the script auto-detects the ATM strike and displays:
C: Call LTP
P: Put LTP
CPVR: Call/Put Volume Ratio label
Watch the Chandelier Exit colors:
🟢 Green = Bullish trend
🔴 Red = Bearish trend
Combine CPVR bias + trend color for confirmation.
If CPVR is above 1.25 and trend color green → More bullish activity (Calls stronger).
If CPVR is below 0.75, and trend color red→ More bearish activity (Puts stronger).
If CPVR is between 0.75 and 1.25 and the trend color is gray/mixed → Neutral
Practical Use Case
The script continuously updates the ATM strike, CPVR , and trend overlay in real time.
It provides a clear visual snapshot of how option volumes align with price momentum , ideal for intraday or short-term directional traders.
Disclaimer
This tool is for educational and analytical purposes only.
It does not provide financial advice or guaranteed trading signals.
Happy Trading. ARJO
Indicador Pine Script®