VWMA with kNN Machine Learning: MFI/ADXThis is an experimental strategy that uses a Volume-weighted MA (VWMA) crossing together with Machine Learning kNN filter that uses ADX and MFI to predict, whether the signal is useful. k-nearest neighbours (kNN) is one of the simplest Machine Learning classification algorithms: it puts input parameters in a multidimensional space, and then when a new set of parameters are given, it makes a prediction based on plurality vote of its k neighbours.
Money Flow Index (MFI) is an oscillator similar to RSI, but with volume taken into account. Average Directional Index (ADX) is an indicator of trend strength. By putting them together on two-dimensional space and checking, whether nearby values have indicated a strong uptrend or downtrend, we hope to filter out bad signals from the MA crossing strategy.
This is an experiment, so any feedback would be appreciated. It was tested on BTC/USDT pair on 5 minute timeframe. I am planning to expand this strategy in the future to include more moving averages and filters.
Knn

Machine Learning: kNN-based Strategy (update)kNN-based Strategy (FX and Crypto)
Description:
This update to the popular kNN-based strategy features:
improvements in the business logic,
an adjustible k value for the kNN model,
one more feature (MOM),
a streamlined signal filter and
some other minor fixes.
Now this script works in all timeframes !
I intentionally decided to publish this script separately
in order for the users to see the differences.

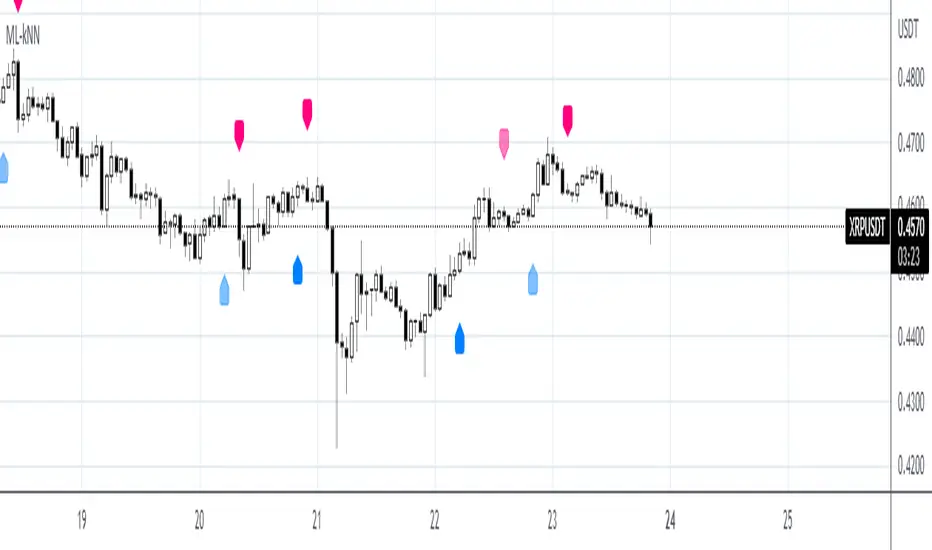
Machine Learning: kNN-based Strategy (mtf)This is a multi-timeframe version of the kNN-based strategy.
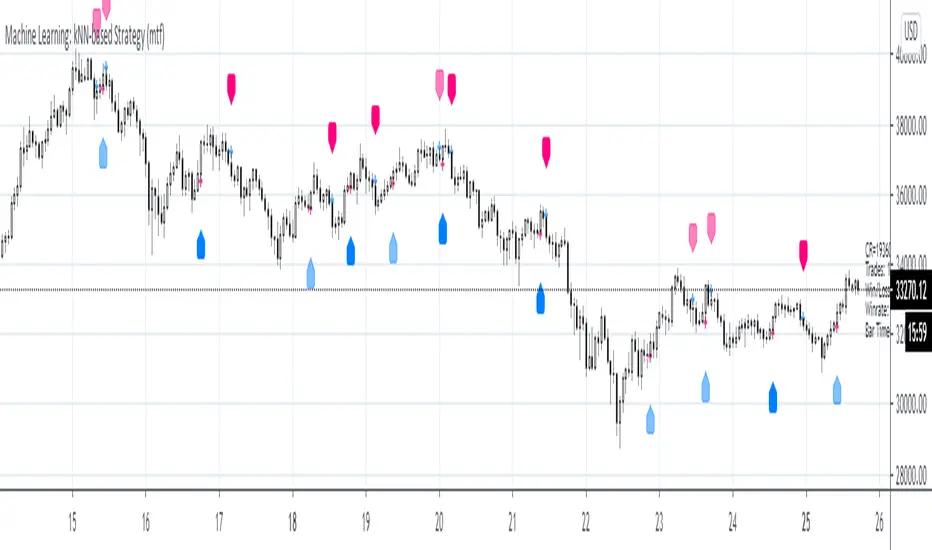
Machine Learning: kNN-based StrategykNN-based Strategy (FX and Crypto)
Description:
This strategy uses a classic machine learning algorithm - k Nearest Neighbours (kNN) - to let you find a prediction for the next (tomorrow's, next month's, etc.) market move. Being an unsupervised machine learning algorithm, kNN is one of the most simple learning algorithms.
To do a prediction of the next market move, the kNN algorithm uses the historic data, collected in 3 arrays - feature1, feature2 and directions, - and finds the k-nearest
neighbours of the current indicator(s) values.
The two dimensional kNN algorithm just has a look on what has happened in the past when the two indicators had a similar level. It then looks at the k nearest neighbours,
sees their state and thus classifies the current point.
The kNN algorithm offers a framework to test all kinds of indicators easily to see if they have got any *predictive value*. One can easily add cog, wpr and others.
Note: TradingViews's playback feature helps to see this strategy in action.
Warning: Signals ARE repainting.
Style tags: Trend Following, Trend Analysis
Asset class: Equities, Futures, ETFs, Currencies and Commodities
Dataset: FX Minutes/Hours+++/Days