Bull Bear Power TrendDo you find it difficult to analyze trends?
This indicator will help you to have an objective analysis of the trend.
Let's start .....
In this indicator Bears and Bulls go their separate ways.
-The Bull line (bullish green) always goes above zero.
-The Bear line (bearish red) always goes below zero.
With a quick glance, you will know who is winning.
There are two zones of tendency force:
- Above 2 for bulls: when the Bull line crosses its + 2 level upwards, an uptrend begins to have strength.
- Below 2 for bears: when the Bear line crosses its -2 level down, a downward trend begins to gain strength.
Trend Confirmation:
- When a histrogram bar appears the trend is confirmed.
When a positive histogram appears, it indicates that the Bull line is above its + level and the Bear line is above its level -.
When it is a negative histogram that appears, it indicates that the Bear line is below its level - and the Bull line is below its + level.
The TREND line (in black) is the difference between the Bull line and the Bear line.
Its crosses above / below zero serve us to track the trend, as well as turning points where we could put a stop loss .
This indicator generates multiple signals as position management, I leave it to fall in love with it and find all that.
Thanks to Jose Callao for this great idea.
Thumbs up
Buysignal

Bollinger Bands on MacdOnly longs when Macd line is above Bollinger Band and shorts when Macd line is above Bollinger Band, this will avoid many problems.
thumbs up!!!

Climatic Volume X- Climate volume detection
- Relative volume value in bar
- Automatic zone generation (possibility of configuration)
- Additional features
¡¡¡Thumbs up¡¡¡
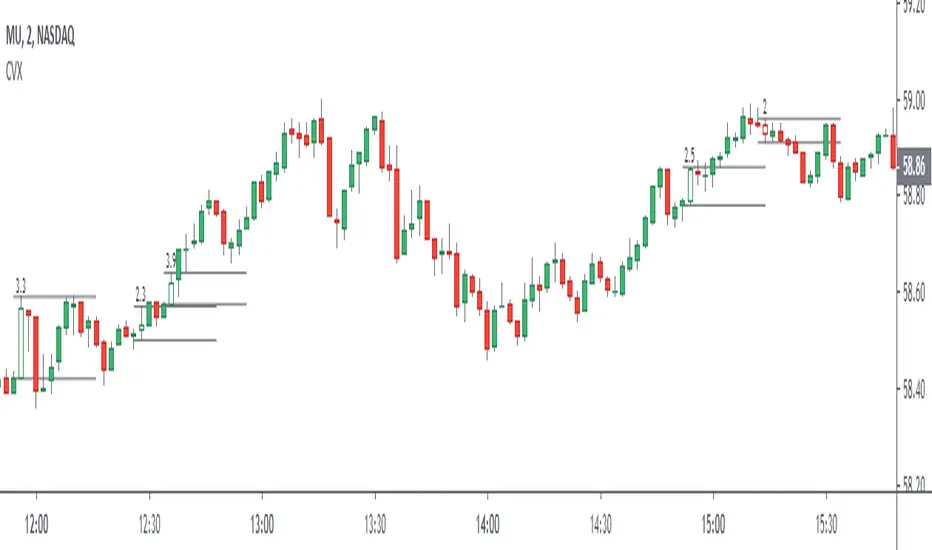
Elephant Bar by Oliver VelezThis script detects an event created by Oliver Velez, basically it is a wide-range candle, its range is noticeably larger than the previous candles, this event indicates a possible continuation of the movement, or the beginning of an extended movement. The candle has to be of good body, as a rule it can be taken that the body must be more than 70%. The stop goes below the minimum of the candle and the signal is given when the next candle followed by the elephant candle exceeds its body, this condition is not programmed so that the alert indicates that an elephant candle was generated and the trader has some time to visualize the graph and wait for the signal. Example below:
NOTE: IT IS VERY IMPORTANT THAT THE TRADER ANALYZE THE CONTEXT OF THE MARKET WHERE THE ELEPHANT BAR IS GENERATED AND DETERMINE ACCORDING TO ITS EXPERIENCE IF THE EVENT HAS A GOOD PROBABILITY OF PROJECTION, YOU MUST NOT TAKE AN ENTRY ONLY BY THIS EVENT, IF YOU DO YOU WILL LOSE ALL YOUR MONEY
.
One of the problems of the elephant bar is that it generates a fairly wide risk unit with respect to other narrow range events, so the risk / benefit ratio is not very large, but it is an event that deserves attention when it occurs in a good location since it generally generates continuation.
If you want to have a lower risk unit and improve the risk / benefit ratio, you can play the “Gift Zone”, when detecting an elephant bar you can wait for a step back inside the elephant bar area and take a position, this will give you a less distance to the stop, but this can lead to the event escaping if there is no recoil.
- The size of the candle is determined by comparing a range of previous candles (you can set the amount at your discretion)
- Search factor: by default 1.3, this means that all bars that have a range greater than the average range of previous candles + 30%, are considered elephant candles (can be configured at your discretion)
- Possibility to configure the percentage of the body that the elephant candle must have.
- Possibility of filtering up to 2 means with direction detection and color change (fully configurable)
- Possibility of filtering by mobile averages
- Alerts
- Additional features
Thumb up if you liked me ..

RSI with an Opinion (UO)This RSI has a very clear idea about when to buy and sell. It plots buy and sell signals. It is an expert system. Yes, of course, it can make some errors. You should have used stop-loss

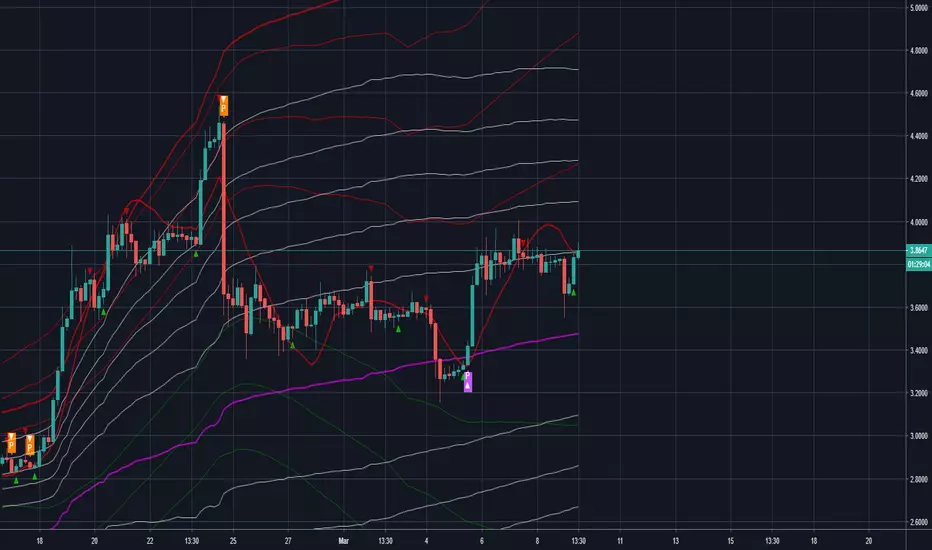
Hash RibbonsBuying during Miner Capitulation yields wonderful returns.
The best buy signals occur on Hash Rate "recovery", and when price momentum is also positive.
Historically, this strategy has yielded average returns to cycle peak of >5000%, with max Drawdown of -15%.
Follow me to learn more about this indicator.

InfoPanel - SeasonalityThis panel will show which is the best month to buy a stock, index or ETF or even a cryptocurrency in the past 5 years.
Script to use only with MONTHLY timeframe.
Thanks to: RicardoSantos for his hard work.
Please use comment section for any feedback.

Mayer Multiple Optimal Multi-Color Histogram [aamonkey]Mayer Multiple developed by Trace Mayer gives the ratio of price to 200 daily moving average.
Buy when it's white sell when it's orange.
Is intended for use on day chart only.
This is an extension of the Mayer Multiple developed by Trace Mayer.
Normally you only have 2 thresholds signaling buying or selling (blue and yellow).
However, I added 2 more thresholds signaling optimized buys and sells (white and orange).

Sell / Buy RatesThis script finds sell / buy rates and adds its linear regression to the chart. its aim is finding buying and selling power, then you can try to find trend reversals. Also you can find divergences, it's very important signal for trend reversal.
Linear regression is a basic and commonly used type of predictive analysis.
if you choose lower periods then it will be more sensitive. I choose 34 as it's one of fibonnaci number.
If you find my works useful, please consider a donation
BTC: 16XRqyS3Vgh1knAU1tCcruqhUrVm4QWWmR

Fib Divergence SystemCombo of many useful indicators which includes fib lines, time and money channels and divergence buy sell signals
Credits for source code:
Scarf, Lazybear, 100kiwi

Power Fractals Open Source I decided to make my power fractals indicator open source.
(/script/el8MaHcq-Power-Fractals/)
Feel free to use/change/improve.

Trading System(Light)Combo of many useful indicators modified to suit dark theme, contains
1)Regular and Hidden Divergence Buy and Sell signals by scarf
2)Time and Money channels by Lazybear
3)Fibonacci Bollinger Bands by Rashad
4) Linear Regression Curve by ucsgears
Thanks for all the creators for the source codes!

Trading System(Dark)Combo of many useful indicators modified to suit dark theme, contains
1)Regular and Hidden Divergence Buy and Sell signals by scarf
2)Time and Money channels by Lazybear
3)Fibonacci Bollinger Bands by Rashad
4)Linear Regression Curve by ucsgears
Thanks for all the creators for the source codes!

Trading System(Dark)Combo of many useful indicators, contains
1)Regular and Hidden Divergence Buy and Sell signals by scarf
2)Time and Money channels by Lazybear
3)Fibonacci Bollinger Bands by Rashad
4)Linear Regression Curve by ucsgears
Thanks for all the creators for the source codes!
Steroid CCI w/ Overbought & Oversold Alert//@version=2
//By Tantamount
//Channel Commodity Index (CCI) with overbought and oversold alert features! Highly configurable indicator that includes a Topography map feature, used to detect & show minute threshold crosses.
//CCI is a momentum based technical trading tool used to help determine when an asset is reaching an overbought or oversold condition and is an great alternative to RSI.
//This CCI tool comes loaded with features and is easily configurable back to standard CCI or with your own preferences.
Customize to your liking:
Simple alert signals
The full enchilada, with Topo map view!
Stand alone CCI oscillator

Total Power IndicatorHello traders!
This indicator was originally developed by Daniel Fernandez (Currency Trader magazine, 2011).
It is based on the two well-known indicators by Dr. Alexander Elder - Bulls Power and Bears Power.
Signals
1) Long when Bull and Total lines indicate 100 (it happens rarely)
2) Short when Bear and Total lines indicate 100 (it happens rarely)
3) Bull and Bear lines crossovers
4) Long when Bull line crosses Total line from below
5) Short when Bear line crosses Total line from below
6) Long/Short when Bull/Bear lines cross adjustable level.
Like and follow for more open source indicators!
Happy Trading!

Klinger Volume OscillatorThis indicator was originally developed by Stephen J. Klinger (Stocks & Commodities, V.15:12 (December, 1997): "Identifying Trends with Volume Analysis").
NOTE : this is the only correct version of Klinger Volume Oscillator in the public library.
Like and follow for more open source indicators!
Happy Trading!


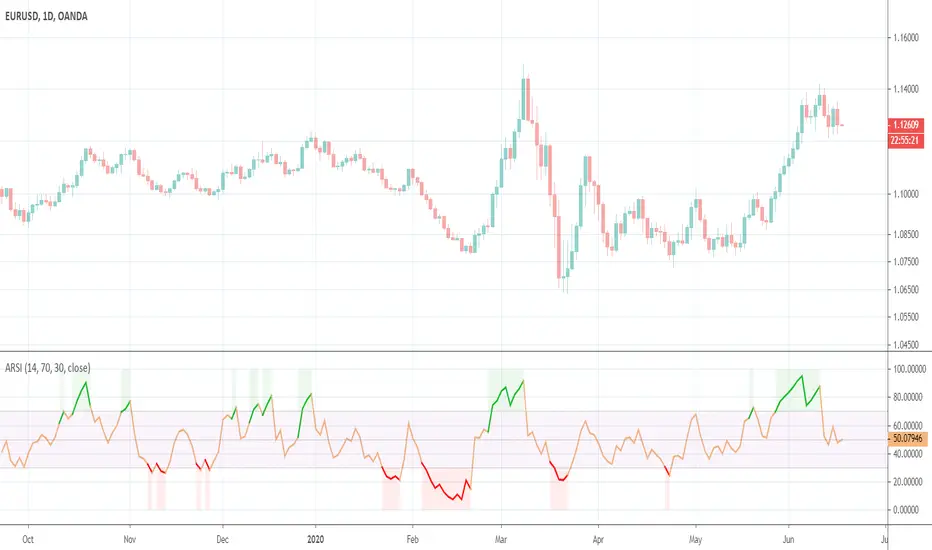
Asymmetrical RSIThis indicator was originally developed by Sylvain Vervoort (Stocks & Commodities, V.26:11 (October, 2008): "ARSI, The Asymmetrical RSI").


RSI/MFI - MTF - Entry signals/Trend colored bars - JD@version=2
This indicator is designed to give early entry signals as well as to follow trend moves, according to different settings.
The indicator shows a histogram of the RSI ro MFI in relation to an ema of the RSI or MFI.
The histogram is then smoothed to give early reversal/entry signals.
The actual RSI/MFI line with oversold/overbought indication can be displayed or omitted, as preferred.
in addition to the RSI/MFI line or as an alternative to it, the background colour can be set to change folowing the RSI/MFI signals.
The timeframe can be chosen. Higher timeframes (eg. 3h) tend to give less false signals.
version 5.
added support for custom Multiple Time Frame selection.
added option for choice of RSI or MFI as base indicator.
added option for price bar coloring according to the indicator. (deselecting "borders" in the "style" tab is recommended)
price bar coloring can be adjusted for different strategies:
1. following the slope of the histogram (for faster entry/exit signals)
2. according to positive or negative histogram (for longer moves)
3. according to pos. or neg. RSI/MFI (for longer term trend holds)
4. uptrend: biased towards faster buy signals and slower sell signals to stay in the uptrend
5. downtrend: biased towards faster sell signals and slower buy signals to stay in the downtrend
A longer timeframe (eg. 3x) is recommended for following trend moves.
try different strategies to see what works better for RSI or MFI.
JD.

CryptogramTR with OPEN CODEIndicator is obtained by importing RSI(14) into HULL moving average source with 2 different periods, as one is long period and the other is short.
When green line (short period) cross upward the red line (long period) , this is a BUY; vice versa it is a SELL.
When HMA Short Period is set to 1 (one), yielding line is absolutely the same line of RSI (14). You can change it into 8(eight) preferably.
İndikatör, RSI(14) indikatörünün, hull hareketli ortalamasının kod kaynağı olarak atanması ile elde edilmiştir. Uzun ve kısa olmak üzere 2 ayrı periyot kullanılmıştır.
Yeşil çizgi yani kısa periyotlu çizgi, kırmızı yani uzun periyotlu olanı yukarı keserse AL, tersi durum SAT olarak düşünülmelidir.
Hull Kısa Periyodu 1 iken oluşan yeşil çizgi, RSI(14) indikatörünü vermektedir. Kısa periyot olarak tercihinize göre bu değeri 8 olarak da kullanabilirsiniz.
