TradingCryptoCourse Support/ resistance BreakoutThis indicator looks for breakouts above and below the latest highs and lows. Indicador Pine Script®por CarlEverest7798
AM HellachoppyThis script shows choppy zones and attempts to estimate the proceeding direction using a variety of methods. The methods used to calculate the estimate are user configurable.Indicador Pine Script®por ajmd_trades27
Poseidon - [Swing High Low][Support and Resistance][Reversal]...A great indicator with tons of usages for technical analysis Act as: * Support and Resistance (It can be used as breakouts only if you drag the line manualy, it will never break it by itself) * Swing points * Reversal point (The candle will reverse in 90% in cases) * Tops and Bottoms (It finds highest and lowest points) ... and many more TA for strategies Combined with RSI will give even better overview of the chart Play with values till you find what your needs are The bigger value is, the more accurate points will be (There is no such as magic indicators, you need to do your job, you need to know what are you doing before enter in real life!) Cheers! @ZekisIndicador Pine Script®por edward_ZActualizado 2424 2.1 K
TrendBand NakedSame concept as Trendband Guide script, but now, we can choose any combination of moving average that suite with our own trading style. Default setting : Input (candle base on your timeframe) Breakout Candle : 5 (highest) Breakdown Candle : 10 (lowest) Moving Average Line EMA : default EMA, uncheck for MA Fast Line : 10 Slow Line : 20 Direction : 50 Long Term : 200 Style Breakout Line / Breakdown Line : Horizontal line base on breakout or breakdown setting above Green Triangle : Potential pullback breakout Red Triangle : Candle make new high but close lower (potential weakness) Black Triangle : Candle make new low but close higher (potential strength) Inside Candle : High and low current candle was smaller and within the high and low the previous candle Background color : Red for positive / uptrend (fast line above slow line) and green for negative/downtrend (fast line below slow line) Indicador Pine Script®por BURSATRENDBANDCHARTActualizado 66551
Ichimoku A/D Breakoutthis is basically a clone of the super a/d indicator but we're using a standard ichimoku as the source for the trend instead of the supertrend indicatorIndicador Pine Script®por ParCornActualizado 11306
Breakout IndicatorThis script allows you to set breakout alerts. An alert will be triggered only when price breaks and closes beyond the specified prices. You will get an alert on the first candle that closes beyond the levels you set.Indicador Pine Script®por ZenAndTheArtOfTradingActualizado 1515 3.7 K
Trend Follower With Help of Donchian Channels - TFWHDCThis is a simple Day Trade indicator, but can be used for swing and long term trades. It is based on Donchian Channels to detect trend and point out resistance or support breakouts using arrows. The bars ared colored when a breakout occurs. When a resistance breakout occurs the current and the next bars are colored green (default) and when a support breakout occurs the current and the next bars are colored red (default). This way this indicator can show if its an uptrend or a downtrend. I hope this indicator will be useful for many traders! Thank you! Indicador Pine Script®por rasantos33476
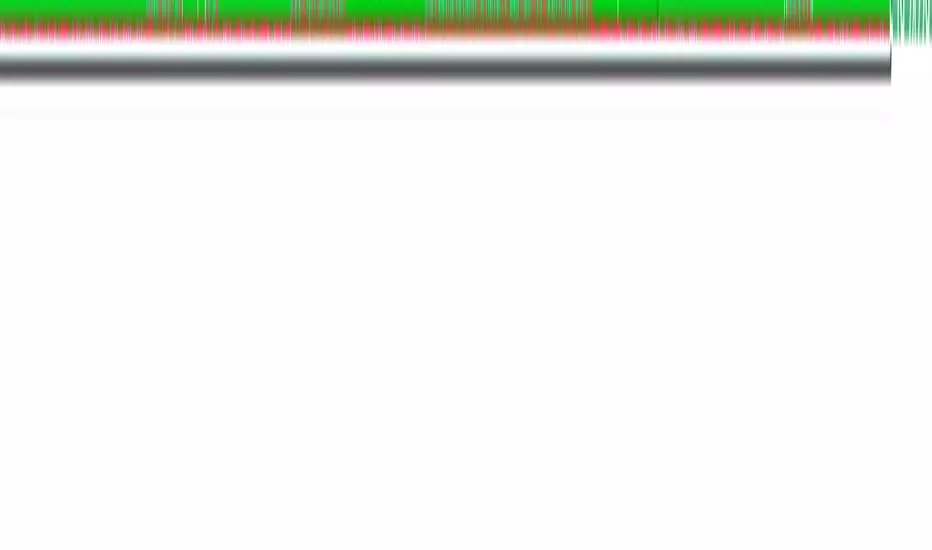
Breakout/Consolidation Filter [jwammo12]This indicator acts as a filter for determining recent breakouts and consolidations in price. The first way to use the indicator is with a short lookback period. It then will paint yellow most of the time, with red marking a sharp recent breakdown in price and green marking a sharp breakout in price. This can be used to follow the breakout, or to fade it. The second way to use the indicator is a long lookback period. This will change the output to be colored most of the time, with small sections of yellow. The yellow indicators areas where price has not made a large move in a while, or periods of consolidation. This can then be used to plan reversal trades, or follows any new trend. The blue line is a Average True Range Percent Rank, when this value is high, it means that breakouts are less likely to trigger, since price has been moving rapidly recently, and a relative breakout would have to be a large move. When the line is low, breakouts will trigger more easily, since price has been moving relatively slowlyIndicador Pine Script®por jwammo1244569
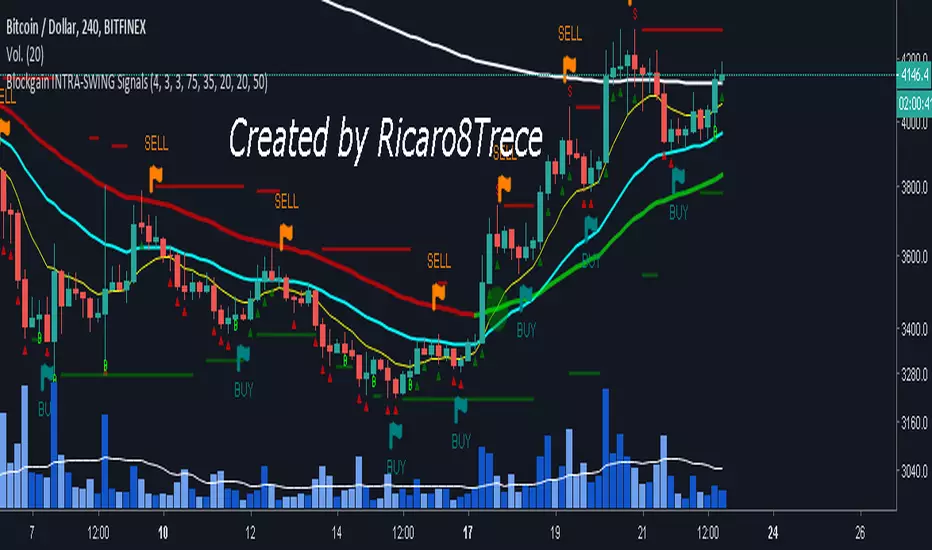
Blockgain INTRA-SWING SignalsRules 1h to 4h for Crypto: - This script should be used as confirmation of an entry that the trader is preparing, since the signal can move 2 or 3 candles because it is calculating the chances of a rally in that area. - The S and B are Stoch crosses in overbought and oversold - The green and red triangles indicate new maximums and new minima of 4 candles back - EMAS 10, 26, 50 refer to Ichimoku Tenkan-sen (9) (10), Kijun-sen (26), Senkou Span B (52) (50) - Supports and resistances calculated at 20 candlesIndicador Pine Script®por Ricardo8TreceActualizado 33113
Study INTRA-SWINGContent - ema of 50 changes color if the price is above or below it -ema of 10 yellow -ema of 200 white - Green triangles under the candles indicate new maxima compared to the previous 4 candles -Red triangles indicate new minima with respect to the previous 4 candles -the green and orange arrows of high altitude indicate Longs and Shorts for Intradia or Swing (recommended in temporalities from 1h to 4h), for more temporality should change the period for a greater one -Alarms for: - Green and red triangles like Break Out, Break Down -Long ARROW green arrow -Orange arrow SHORT ARROW // NOTE: this Script is in Beta mode and next updates will be madeIndicador Pine Script®por Ricardo8TreceActualizado 44150
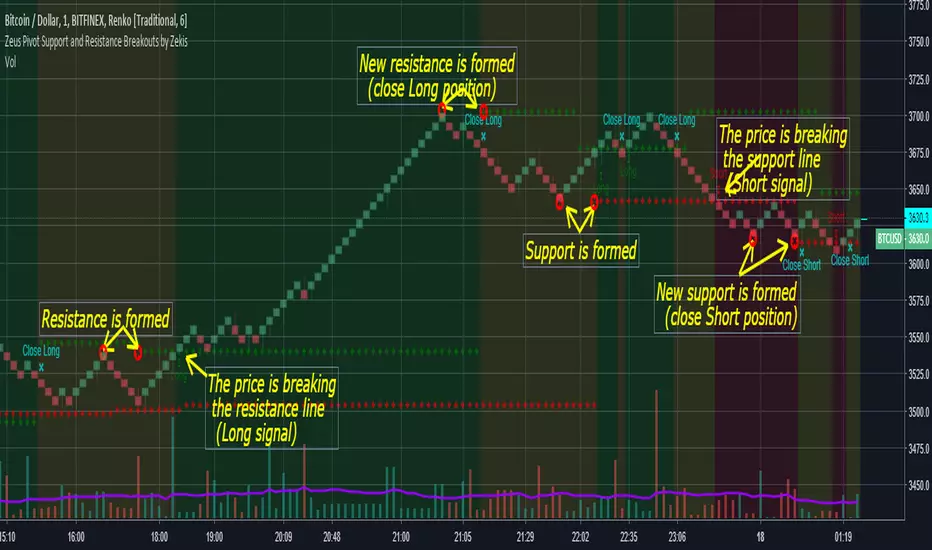
Zeus Pivot Points Support and Resistance Breakouts by ZekisZeus Pivot Support and Resistance Breakouts by Zekis Is an indicator with big results, it forms new support /resistance according to the last higher high or lower low (it prints new ones only if it breaks through the last one) Rules: - enter Long or Short when the support or resistance is craked - exit when new support or resistance is starts to form Alerts for entries and exits A moving average is added to filter signals (leave it at 1 for price close signals) Bar colors can be added to see longs, shorts or no position Background colors for longs, shorts or no position Enjoy! @ZekisIndicador Pine Script®por edward_Z33583
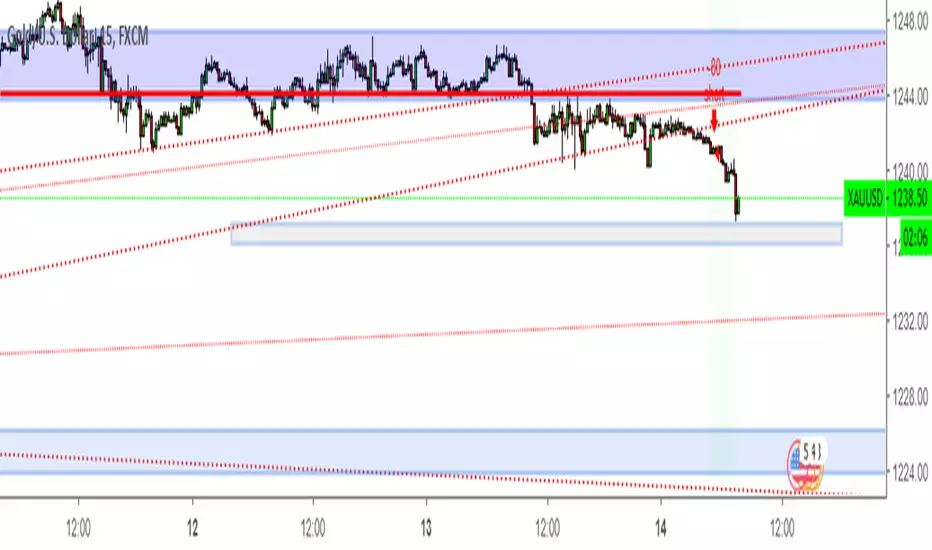
BuySell Gold Test Script by Breakout and SR zone I test this for test overall report and set fix price after 14 dec 2018 that i set from manual trade in zone. will improve to better automate again after this.Estrategia Pine Script®por theoris411
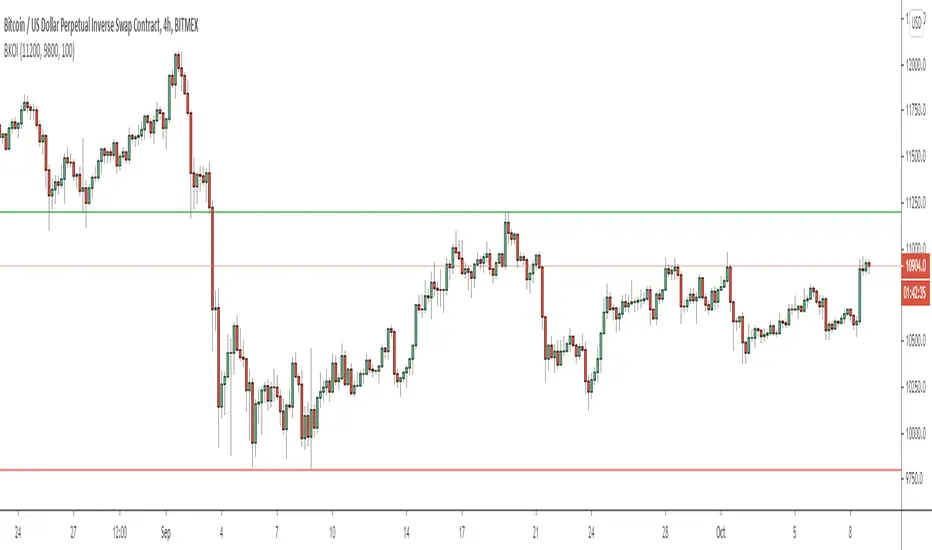
RMA Breakout v1.0Optimized for Bitmex XBT/USD. Timeframe 4H.Estrategia Pine Script®por DenCrypto11206
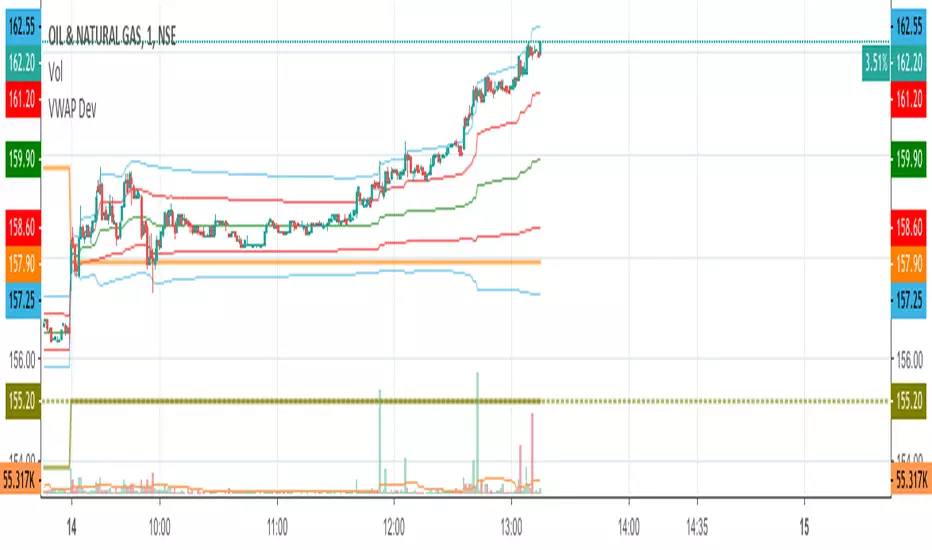
VWAP Stdev BandsCurrent price always obeys VWAP and is very useful for intraday traders. The Price will never go beyond the second deviation of VWAP at any point of time. The deviation bands are also very useful in predicting the volatility of the script. Breakout trades can be taken based on the previous day's VWAP and it's deviations. One can say that the stock has experienced breakout if current price crosses the fourth deviation of the previous day's VWAP or price bounces off that level, the price movement will be rapid if this occurs providing a good trading opportunity with low risk-reward ratio.Indicador Pine Script®por dbdecoy11287
Δ Volume Finder Vol Delta v1.0 by 🇨🇷🇾🇵🇹🇴🇷🇹🇭🇾🇭🇲🇸Δ Volume Finder Vol Delta v1.0 by 🇨🇷🇾🇵🇹🇴🇷🇹🇭🇾🇭🇲🇸 General Description 💰This indicator is given FREE to all our premium indicator subscribers. 🔊Volume Finder is an indicator designed to provide additional insights, and actionable information from the vanilla volume indicator you are all used to. ℹ More information is never a bad thing! This indicator gives you several tools in one package. The aim is to give volume some additional depth and utility. 🕞The indicator works on any timeframe and any market that has basic volume data (stocks, forex, crypto). 📜 Features 🎚 First off the volume bars are split into positive volume and negative volume. This allows you to more easily visualize the amount of a "green" candle that was actually SELLS, and vice versa - the amount of a "red" candle that were actually BUYS. 🌈It will auto gradient the volume levels based on historical volume range for whatever instrument you are looking at. Yellow bars are deviated outside the lower range (many times this will precede a breakout / breakdown). 🚫If you do not wish to set the auto gradient, you can manually set the levels you would like via settings, or turn it off. 🚦 Next is the Volume Delta. This is the line that is oscillating above and below zero. This shows you the net positive or negative volume. In other words, it shows you the total positive or negative volume. ➕➖ Third are options for EMA plots of the total positive volume and total negative volume. This should be pretty self explanatory. 📩 Lastly is a system that generates alerts when volume breaks out past a certain user defined level. You can plot these alerts as one or both of the following: colored bars on the price chart, or alert bubbles within the indicator pane. 💭Please leave me any ideas or feedback you have! 💬Questions? Comments? Want to get access to an entire suite of proven trading indicators? Come visit us on telegram and chat, or just soak up some knowledge. We make timely posts about the market, news, and strategy everyday. Our community isnt open only to subscribers - everyone is welcome to join.Indicador Pine Script®por theheirophant1010207
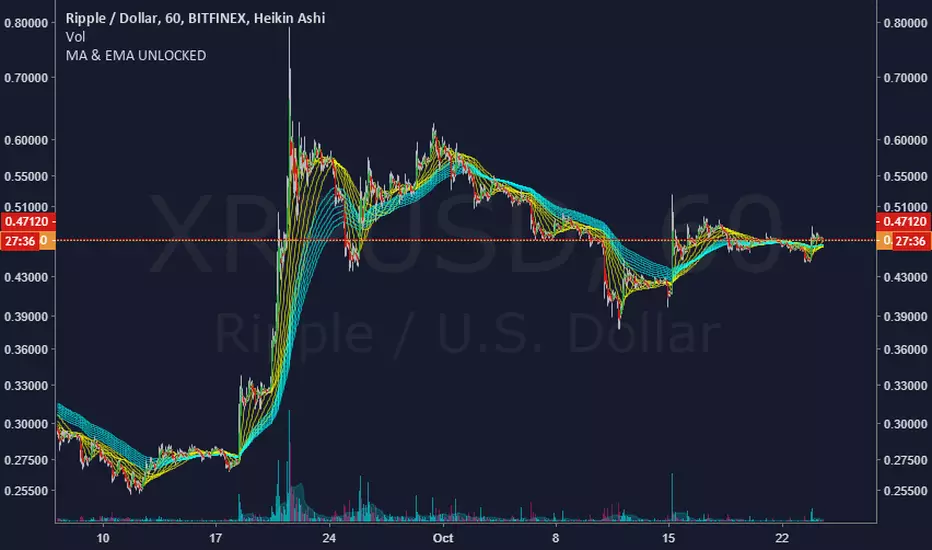
MA & EMA UNLOCKEDMaximized your trading by using MA & EMA UNLOCKED. 7 Moving Average 7 EXPONENTIAL MOVING AVERAGE Fully customizable in your needs such as support and resistance , trend follower and crossover breakouts. You can hide and unhide unnecessary things. Indicador Pine Script®por Lockedeye7
Breakout / Resistance Intra-dayShows Breakout / Resistance points for Intra-day charts Indicador Pine Script®por m_p_d347
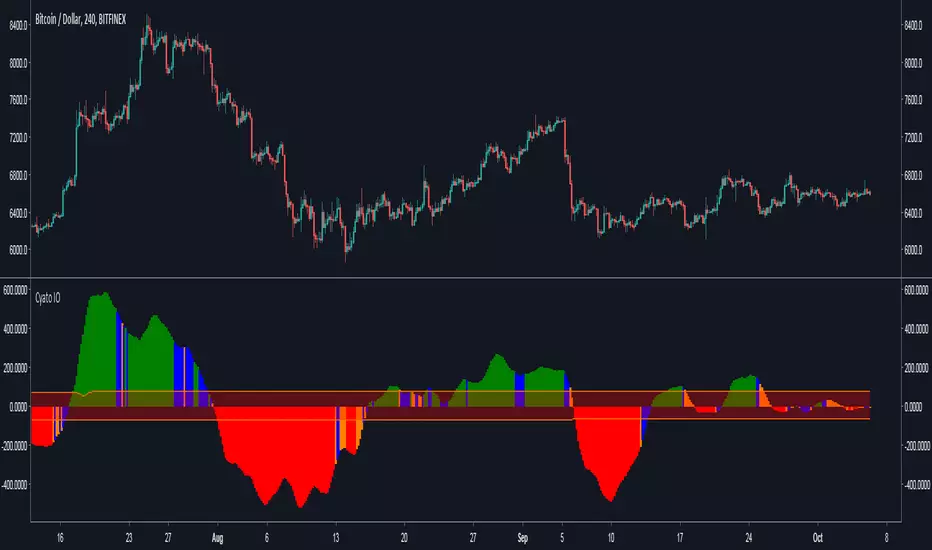
Cyatophilum Ichimoku Oscillator [BACKTEST][STRATEGY]An Automated Strategy based on Ichimoku Cloud. Works on any timeframe and market. Backtest is done using the largest period TradingView has to offer for 1H. Net profit is calculated using the Strategy Tester, with only long entries at Green triangles and exits at red triangles. Profit can be greater if you short Sell signals (red triangles). Commission used is 0.05%. This strategy is on my website. You can get access if you purchase the Cyatophilum Indicators. blockchainfiesta.com The Alert Setup version is here : Estrategia Pine Script®por cyatophilum5524
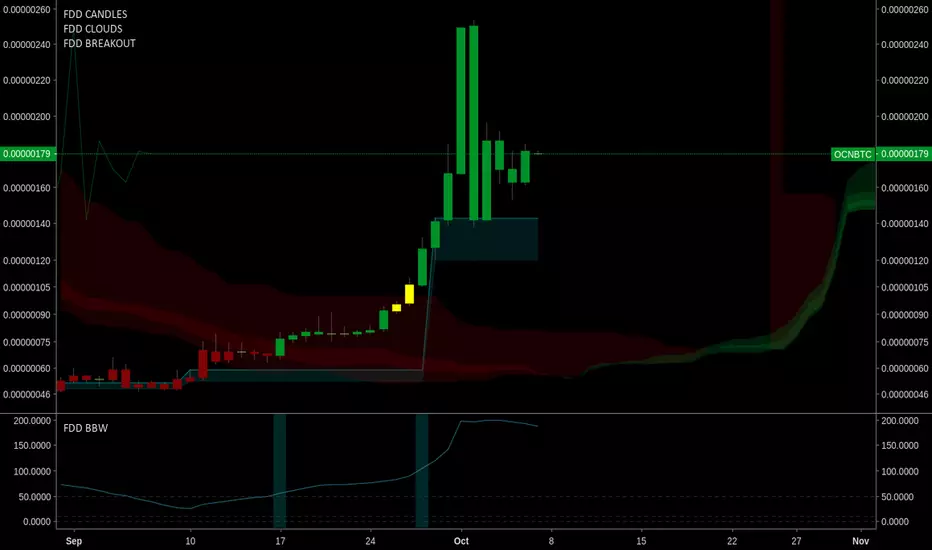
FOMO DRIVEN BREAKOUT INDICATORFomo Driven Developments Breakout Indicator Works well with FDD Super Candles Indicator and Super Clouds. This is the breakout indicator that F-DAS uses. For access please go to www.fomodd.io. Twitter = Telegram = @dgnsrekt FOMO DRIVEN DEVELOPMENT www.youtube.com This video shows the F-DAS system watching TDI. F-DAS is a modular trading alert system that can easily be programmed to watch any exchange, market, or trading strategy. The video shows F-DAS watching TDI and FDD breakouts.Indicador Pine Script®por dgnsrekt13
Cyatophilum Ichimoku Oscillator [ALERT SETUP]Hello, I built an oscillator based on Ichimoku trading rules. I wanted something simple to use, but powerful, with automated alerts that would help us trade breakouts and trend reversals. The indicator can be used on all timeframes and everywhere : Crypto, Forex, Index, Stocks, Futures, CFD. Basically, green bars equals bull market and red bars equals bear market. Blue and Orange bars show potential breakouts and you can setup automatic alerts for receiving an email or SMS when it happens. You can also setup alerts for new highs and new lows indicating a potential trend reversal. The narrow channel in the middle indicates consolidating periods and unsignificant trades, because we know Ichimoku performs badly in range markets. For more information on how to use it, I made a description page at the link below. Sample Use Cases : BTCUSD 4H BTCUSD 2H with New Highs/Lows on chart (blue and red circles correspond to alert conditions) BTCUSD 1H ETHUSD 2H Use divergences with price action to trade breakouts. More information on my website blockchainfiesta.com Purchase this indicator today and get access to my other Cyatophilum Indicators that will help you in your trading blockchainfiesta.com Happy trading!Indicador Pine Script®por cyatophilumActualizado 161635
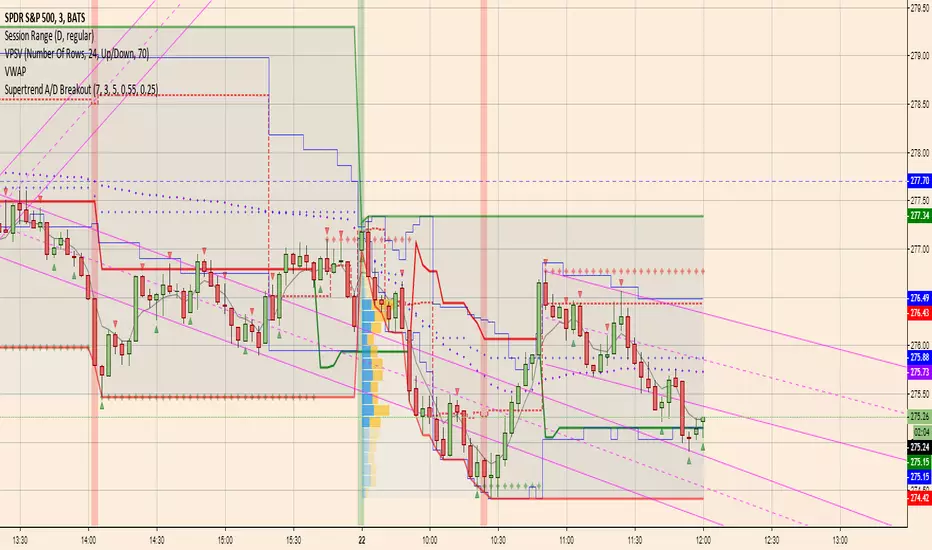
Supertrend A/D BreakoutModified Hoffman A/D: 1. uses standard supertrend to determine up/down direction (previous version used ema crossover) 2. uses improved A/D candlestick patterns I'm optimistic about this oneIndicador Pine Script®por ParCornActualizado 241
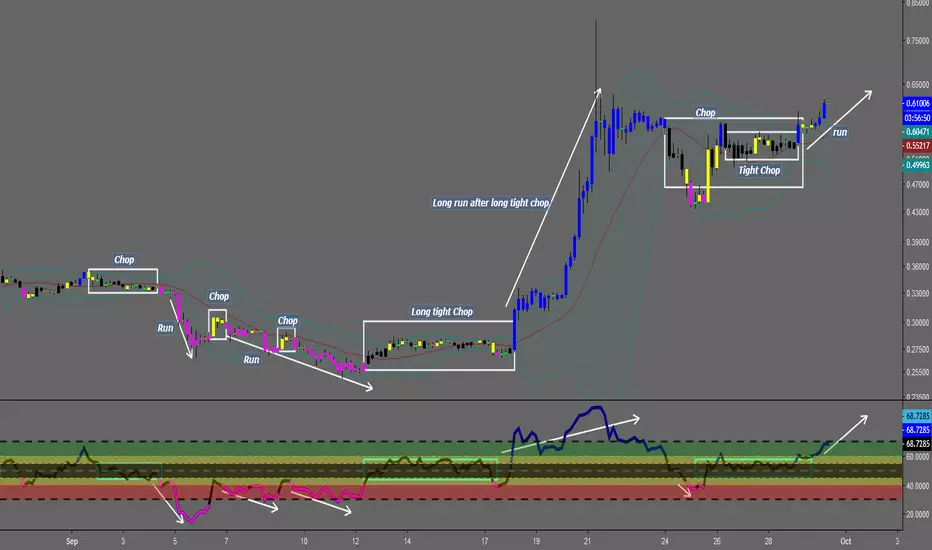
Chop and explodeThe purpose of this script is to decipher chop zones from runs/movement/explosion The chop is RSI movement between 40 and 60 tight chop is RSI movement between 45 and 55. There should be an explosion after RSI breaks through 60 (long) or 40 (short). Tight chop bars are colored black, a series of black bars is tight consolidation and should explode imminently. The longer the chop the longer the explosion will go for. tighter the better. Loose chop (whip saw/yellow bars) will range between 40 and 60. the move begins with blue bars for long and purple bars for short. Couple it with your trading system to help stay out of chop and enter when there is movement. Use with "Simple Trender." Best of luck in all you do. Get money. Indicador Pine Script®por NYBKLYN6262 4.1 K
Peso Pros Asia Breakout with AlertsAsia Breakout indicator using some magic sauce with two take profit levels and alerts to go long or short. Works on a variety of pairs as discussed in the Peso Pros group and course. SL the other side of the trade at the middle of the box or the end.Indicador Pine Script®por ShawnGervais5572