CBOT: Micro E-Mini Dow Jones Futures (  MYM1!)
After a 9-day delay due to the U.S. government shutdown, the Bureau of Labor Statistics (BLS) released the September CPI data on October 24th. Here are the highlights:
• The Consumer Price Index for All Urban Consumers (CPI-U) increased 0.3% on a seasonally adjusted basis in September, after rising 0.4% in August.
• On an annual basis, the headline inflation rose 3.0% before seasonal adjustment.
• The CPI index for all items less food and energy, commonly known as the Core CPI, rose 0.2% in September, after rising 0.3% in each of the 2 preceding months.

As cooling inflation data spurred investor optimism, U.S. stocks reached new heights again on Friday. The market expects the Federal Reserve to stay on its rate-cutting path, boosting the U.S. economy and justifying higher stock valuations.
The Dow Jones Industrial Average rose 472.51 points, or 1.01%, to 47,207.12, securing its first close above the 47,000 level. The S&P 500 added 0.79% to 6,791.69, while the Nasdaq Composite climbed 1.15% to 23,204.87. All three closed at records.
Following the CPI data, traders increased their stakes that the Fed will cut rates in October and December. Odds for a December cut jumped to 98.5% from roughly 91% before the data, per the CME FedWatch tool. Odds for a cut next week remained above 95%.

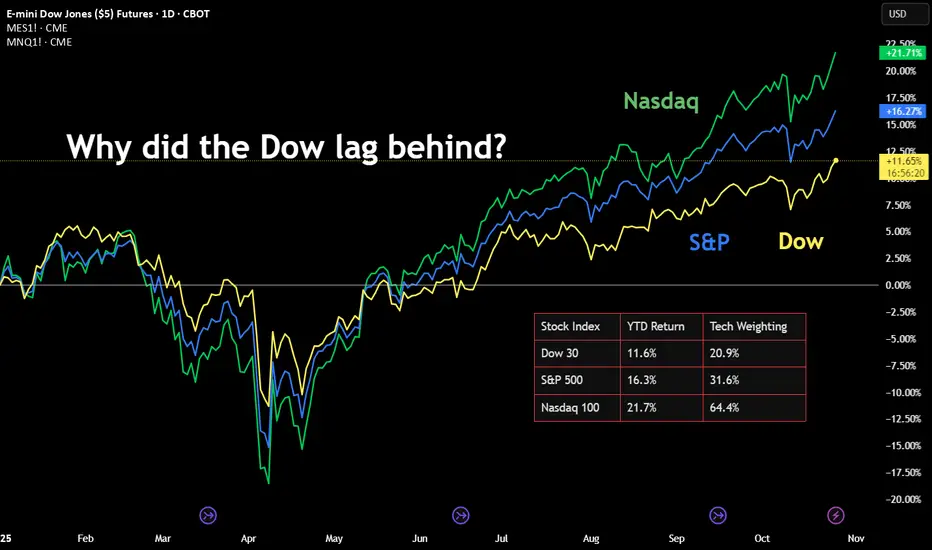
The Case of Dow over S&P and Nasdaq
As of Friday, the Dow gained 10.55% year-to-date, while the S&P rose 15.01% and the Nasdaq was 20.18% higher in 2025.
Why did the Dow lag behind the S&P and the Nasdaq? A simple answer is due to its lower index weight on technology. Since the current bull market is primarily driven by A.I., the Dow benefited less comparing to the other two stock indexes.
The Dow has six component companies in the technology sector. Their combined weight comes to 20.91% of the 30-stock index as of today.
• Microsoft (MSFT), 6.82%
• IBM (IBM), 4.00%
• Apple (AAPL), 3.42%
• Salesforce (CRM), 3.32%
• Nvidia (NVDA), 2.43%
• Cisco (CSCO), 0.92%
For a comparison, the S&P 500 has a weighing of 31.6% on Information Technology, while the Nasdaq-100 has a weighing between 62.48% - 64.45% for Technology.
In my opinion, the stock market has already beaten up so much on the A.I. hype, and it is late in the bull market cycle. The Nasdaq-100 has a lofty valuation with a Price/Earnings ratio of 33.25 (trailing 12-month), according to Birinyi Associates. Meanwhile, the Dow has a more reasonable P/E ratio of 24.90.
I am bullish on U.S. stocks long term. However, I share the growing concerns about potential collusion among AI companies. Types of AI collusion under investigation:
• Partnerships and investments: Tech giants invest billions into AI startups. Are these deals designed to control the AI ecosystem and suppress competition?
• Algorithmic price-fixing: Companies may use AI-powered pricing algorithms to inflate prices. Antitrust agencies are actively scrutinizing potential collusive outcomes.
• AI companies may use shared platforms or common algorithms to align market strategies, potentially forming a tacit "hub-and-spoke" conspiracy.
• Companies initially release AI models as "open source" to gain market share, accumulate data, and establish an ecosystem, only to later close off access.
• Dominant tech firms with control over cloud computing infrastructure, proprietary data, and massive financial resources could entrench their positions in the AI market.
To summarize, the Dow is a safer bull-market strategy given its more reasonable valuation. Investors are wise to stay clear off the potential crush on the A.I. hype.
Trading with Micro E-Mini Dow Jones Futures
If a trader shares a bullish view on the Dow, he may consider using stock index futures to enhance investment returns.
Micro E-Mini Dow Jones futures (MYM) offer smaller-sized versions of CME Group’s benchmark Dow Jones futures (YM) contracts. Micro futures have a contract size of 0.5 times the DJIA index, which is 1/10th of the standard contract.
CME data shows that the E-Mini and Micro Dow Jones futures have a combined open interest of 105,674 contracts as of Friday. Due to the government shutdown, the CFTC Commitment of Traders report has not been updated since September 23rd. We are currently in the dark about the “Smart Money” positions in the Dow.
Buying or selling one MYM contract requires an initial margin of $1,371. With Friday settlement price of 47,396, each December contract (MYMZ5) has a notional value of $23,857. Compared with investing in stocks, the futures contracts offer a built-in leverage of about 17 times (=23857/1371).
Hypothetically, if Dow futures price moves up 5% to 49,766 by December, the index gain of 2,370 points will translate into $1,185 for a long position, given each index point equal to $0.50 for the Micro contract. Using the initial margin of $1,371 as a cost base, the trade would produce a theoretical return of 86.4% (=1185/1371).
Futures contracts have expiration days, and you may not hold them forever like stocks. To stay long in the DJIA, a trader may consider a futures rollover strategy. An illustration:
• A trader buys the lead contract December now, and holds it till the end of November
• He will then sell December and buy March, which will become the next lead contract
• He will repeat this process: buy June 2025 and sell March 2026 in February 2026
• Repeat this again to buy September 2026 and sell June 2026 in August 2026
This series of trades allows a trader to establish a long position in the DJIA throughout the year, while holding the most liquid contracts.
There is no guarantee that each trade will yield positive returns. But if the Dow is trending up over time, the position would likely pay off.
The leverage feature in futures works both ways. It would magnify the losses as well as improving the winnings. The good news is, a trader could put stop-loss on his futures trades, limiting the downside risks.
For example, our trader may set stop-loss at 45,000 when he buys the MYM at 47,396. If the Dow falls to 40,000, his position will be liquidated well before that when the price hits 45,000. The maximum loss incurred will be $1,198 (= (47396 - 45000) * 0.5), which is less than the initial margin of $1,371.
The combination of Futures Rollover with Stop-loss could yield higher returns (thanks to the leverage) while maintaining a limited loss exposure. If the index bounces up and down but trends up in the long stretch, the trader will see both wins and losses. Since the wins are unbounded but the losses are contained, the overall returns would likely be positive.
Happy Trading.
Disclaimers
*Trade ideas cited above are for illustration only, as an integral part of a case study to demonstrate the fundamental concepts in risk management under the market scenarios being discussed. They shall not be construed as investment recommendations or advice. Nor are they used to promote any specific products, or services.
CME Real-time Market Data help identify trading set-ups and express my market views. If you have futures in your trading portfolio, you can check out on CME Group data plans available that suit your trading needs tradingview.com/cme/
After a 9-day delay due to the U.S. government shutdown, the Bureau of Labor Statistics (BLS) released the September CPI data on October 24th. Here are the highlights:
• The Consumer Price Index for All Urban Consumers (CPI-U) increased 0.3% on a seasonally adjusted basis in September, after rising 0.4% in August.
• On an annual basis, the headline inflation rose 3.0% before seasonal adjustment.
• The CPI index for all items less food and energy, commonly known as the Core CPI, rose 0.2% in September, after rising 0.3% in each of the 2 preceding months.
As cooling inflation data spurred investor optimism, U.S. stocks reached new heights again on Friday. The market expects the Federal Reserve to stay on its rate-cutting path, boosting the U.S. economy and justifying higher stock valuations.
The Dow Jones Industrial Average rose 472.51 points, or 1.01%, to 47,207.12, securing its first close above the 47,000 level. The S&P 500 added 0.79% to 6,791.69, while the Nasdaq Composite climbed 1.15% to 23,204.87. All three closed at records.
Following the CPI data, traders increased their stakes that the Fed will cut rates in October and December. Odds for a December cut jumped to 98.5% from roughly 91% before the data, per the CME FedWatch tool. Odds for a cut next week remained above 95%.
The Case of Dow over S&P and Nasdaq
As of Friday, the Dow gained 10.55% year-to-date, while the S&P rose 15.01% and the Nasdaq was 20.18% higher in 2025.
Why did the Dow lag behind the S&P and the Nasdaq? A simple answer is due to its lower index weight on technology. Since the current bull market is primarily driven by A.I., the Dow benefited less comparing to the other two stock indexes.
The Dow has six component companies in the technology sector. Their combined weight comes to 20.91% of the 30-stock index as of today.
• Microsoft (MSFT), 6.82%
• IBM (IBM), 4.00%
• Apple (AAPL), 3.42%
• Salesforce (CRM), 3.32%
• Nvidia (NVDA), 2.43%
• Cisco (CSCO), 0.92%
For a comparison, the S&P 500 has a weighing of 31.6% on Information Technology, while the Nasdaq-100 has a weighing between 62.48% - 64.45% for Technology.
In my opinion, the stock market has already beaten up so much on the A.I. hype, and it is late in the bull market cycle. The Nasdaq-100 has a lofty valuation with a Price/Earnings ratio of 33.25 (trailing 12-month), according to Birinyi Associates. Meanwhile, the Dow has a more reasonable P/E ratio of 24.90.
I am bullish on U.S. stocks long term. However, I share the growing concerns about potential collusion among AI companies. Types of AI collusion under investigation:
• Partnerships and investments: Tech giants invest billions into AI startups. Are these deals designed to control the AI ecosystem and suppress competition?
• Algorithmic price-fixing: Companies may use AI-powered pricing algorithms to inflate prices. Antitrust agencies are actively scrutinizing potential collusive outcomes.
• AI companies may use shared platforms or common algorithms to align market strategies, potentially forming a tacit "hub-and-spoke" conspiracy.
• Companies initially release AI models as "open source" to gain market share, accumulate data, and establish an ecosystem, only to later close off access.
• Dominant tech firms with control over cloud computing infrastructure, proprietary data, and massive financial resources could entrench their positions in the AI market.
To summarize, the Dow is a safer bull-market strategy given its more reasonable valuation. Investors are wise to stay clear off the potential crush on the A.I. hype.
Trading with Micro E-Mini Dow Jones Futures
If a trader shares a bullish view on the Dow, he may consider using stock index futures to enhance investment returns.
Micro E-Mini Dow Jones futures (MYM) offer smaller-sized versions of CME Group’s benchmark Dow Jones futures (YM) contracts. Micro futures have a contract size of 0.5 times the DJIA index, which is 1/10th of the standard contract.
CME data shows that the E-Mini and Micro Dow Jones futures have a combined open interest of 105,674 contracts as of Friday. Due to the government shutdown, the CFTC Commitment of Traders report has not been updated since September 23rd. We are currently in the dark about the “Smart Money” positions in the Dow.
Buying or selling one MYM contract requires an initial margin of $1,371. With Friday settlement price of 47,396, each December contract (MYMZ5) has a notional value of $23,857. Compared with investing in stocks, the futures contracts offer a built-in leverage of about 17 times (=23857/1371).
Hypothetically, if Dow futures price moves up 5% to 49,766 by December, the index gain of 2,370 points will translate into $1,185 for a long position, given each index point equal to $0.50 for the Micro contract. Using the initial margin of $1,371 as a cost base, the trade would produce a theoretical return of 86.4% (=1185/1371).
Futures contracts have expiration days, and you may not hold them forever like stocks. To stay long in the DJIA, a trader may consider a futures rollover strategy. An illustration:
• A trader buys the lead contract December now, and holds it till the end of November
• He will then sell December and buy March, which will become the next lead contract
• He will repeat this process: buy June 2025 and sell March 2026 in February 2026
• Repeat this again to buy September 2026 and sell June 2026 in August 2026
This series of trades allows a trader to establish a long position in the DJIA throughout the year, while holding the most liquid contracts.
There is no guarantee that each trade will yield positive returns. But if the Dow is trending up over time, the position would likely pay off.
The leverage feature in futures works both ways. It would magnify the losses as well as improving the winnings. The good news is, a trader could put stop-loss on his futures trades, limiting the downside risks.
For example, our trader may set stop-loss at 45,000 when he buys the MYM at 47,396. If the Dow falls to 40,000, his position will be liquidated well before that when the price hits 45,000. The maximum loss incurred will be $1,198 (= (47396 - 45000) * 0.5), which is less than the initial margin of $1,371.
The combination of Futures Rollover with Stop-loss could yield higher returns (thanks to the leverage) while maintaining a limited loss exposure. If the index bounces up and down but trends up in the long stretch, the trader will see both wins and losses. Since the wins are unbounded but the losses are contained, the overall returns would likely be positive.
Happy Trading.
Disclaimers
*Trade ideas cited above are for illustration only, as an integral part of a case study to demonstrate the fundamental concepts in risk management under the market scenarios being discussed. They shall not be construed as investment recommendations or advice. Nor are they used to promote any specific products, or services.
CME Real-time Market Data help identify trading set-ups and express my market views. If you have futures in your trading portfolio, you can check out on CME Group data plans available that suit your trading needs tradingview.com/cme/
Jim W. Huang, CFA
jimwenhuang@gmail.com
cmegroup.com/markets/microsuite.html
jimwenhuang@gmail.com
cmegroup.com/markets/microsuite.html
Publicaciones relacionadas
Exención de responsabilidad
La información y las publicaciones que ofrecemos, no implican ni constituyen un asesoramiento financiero, ni de inversión, trading o cualquier otro tipo de consejo o recomendación emitida o respaldada por TradingView. Puede obtener información adicional en las Condiciones de uso.