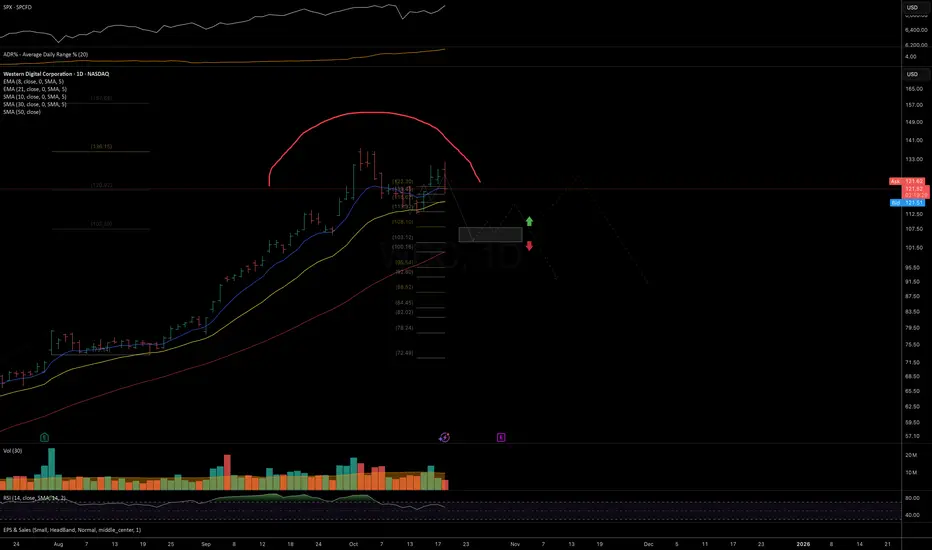
Price continues to act in line with the trend structure suggested in the October analysis. As long as price remains below today’s low, I’m watching for downside continuation toward the 108–103 support zone in the short term, with potentially lower targets in the mid-term.
Chart:
Previously:
On downside potential (Oct 9):
Chart:
see in weekly review: https://www.tradingview.com/chart/BITF/MXF8r9gK-Weekly-Chart-Review-Oct-6-10-2025/
Chart:
Previously:
On downside potential (Oct 9):
Chart:
see in weekly review: https://www.tradingview.com/chart/BITF/MXF8r9gK-Weekly-Chart-Review-Oct-6-10-2025/
Nota
Chart:
📊 Daily FREE Market Insights | Crypto + US Stocks
⚡ Technical analysis, setups & commentary
🌍 t.me/MarketArtistryENG | 🇷🇺 t.me/marketartistry
⚡ Technical analysis, setups & commentary
🌍 t.me/MarketArtistryENG | 🇷🇺 t.me/marketartistry
Publicaciones relacionadas
Exención de responsabilidad
La información y las publicaciones no constituyen, ni deben considerarse como asesoramiento o recomendaciones financieras, de inversión, de trading o de otro tipo proporcionadas o respaldadas por TradingView. Más información en Condiciones de uso.