Introduction-:
Trendlines are often the first tool traders learn and ironically, one of the most misused. Drawing a line between two swing points may look convincing, but that doesn’t make it meaningful. A right trendline is not just about connecting dots it’s about capturing the heartbeat of the market.
In this post we will learn how to draw high quality trendlines that align with price structure, reflect momentum, and provide reliable trade signals. Whether we are scalper, swing trader, or positional analyst, mastering this skill will bring more clarity and confidence to your chart reading.
1-:What Is a Trendline Really ?
A trendline isn't just a visual reference it’s a dynamic tool that reflects the direction and strength of a trend. Think of it as the price path of least resistance.
a) Identify areas of value for entry
b) Highlight potential reversal or breakout zones
c) Keep your analysis structured and disciplined
2-: Anatomy of a Right Trendline
a) Three Touches Minimum
A trendline with just two points is a projection. Once it gets a third touch or more, it becomes validated a level that other traders are likely watching too.
b) Wicks or Bodies Choose One, Use wicks when volatility is high or you're analyzing intraday charts and use bodies for cleaner structure in swing setups
Mixing both can distort your view so choose one and stick to it per chart.
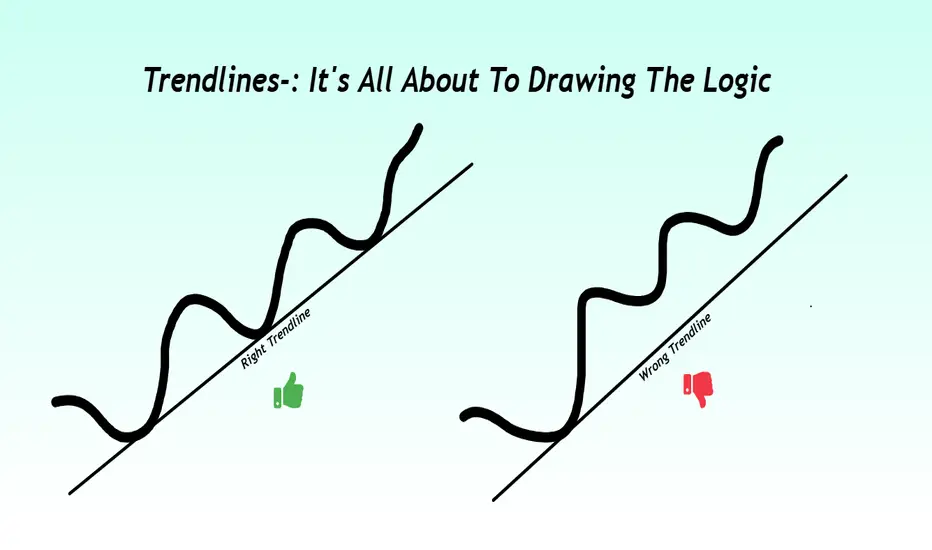
c) Don’t Cut Through Candles, a forced line that slices through multiple candles is a biased line. Let the trendline hug swing points naturally without imposing your view on the market.
d) Respect the Slope, steep trendlines often mark emotional moves that don’t last. Shallow trendlines suggest controlled trends better for swing trades. Avoid extremes a flat or vertical line is usually unreliable.
3-: Timeframe Relevance
Always start with higher timeframes Daily or 4H to draw the main trendline. These longer-term lines attract more volume and institutional attention. Then shift to lower timeframes to refine your entries, keeping the higher-level structure in view.
4. Use Trendlines with Context for Better Accuracy, Trendlines become far more powerful when aligned with other tools, Some examples below.
Horizontal support and resistance can confirm trendline levels
Volume spikes can validate breakout or pullback setups
Divergence in RSI or MACD can signal weakening trend strength
Chart patterns like flags, triangles, or head-and-shoulders often form around key trendlines
The more layers of confirmation, the better your odds.
5-: Using Trendlines for Trading Decisions
a) Pullback Entry
Wait for price to touch the trendline and show a strong reaction (engulfing, pin bar, etc.). These setups offer high R:R with clear invalidation.
b) Break and Retest
A clean break below or above the trendline, followed by a retest, often marks trend continuation or reversal. Wait for confirmation before entering.
c) Logical Stop Placement
Place your stop-loss just outside the trendline’s opposite side. This approach is more rational than random pip buffers or fixed risk.
6-: Trendlines That Trap Traders
Not all breakouts are real. Sometimes price will breach a trendline just enough to trigger stops and then snap back so how to avoid the trap.
Don’t trust every breakout
Confirm with volume or candle structure
Watch for failure-to-follow-through patterns
Patience often reveals whether a move is genuine or manipulation.
Conclusion
The right trendline is not just a drawing it’s a tool that reflects the psychology of the market.
It helps you trade what the market is showing, not what you hope to see. Don’t draw lines to fit your bias. Let price action speak, and draw lines that the market itself respects.
Thanks for reading. If this added value, a like would be encouraging.
Regards- Amit.
Exención de responsabilidad
La información y las publicaciones que ofrecemos, no implican ni constituyen un asesoramiento financiero, ni de inversión, trading o cualquier otro tipo de consejo o recomendación emitida o respaldada por TradingView. Puede obtener información adicional en las Condiciones de uso.