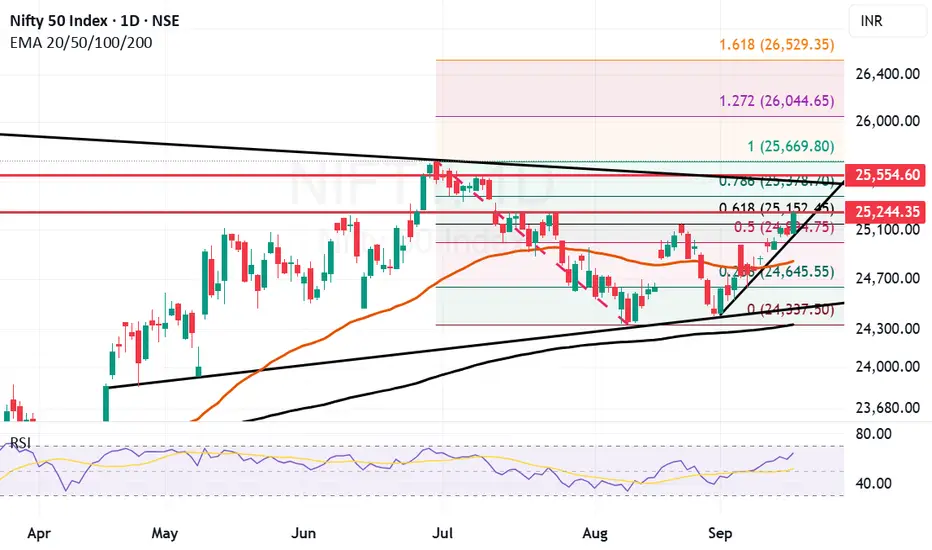
Nifty gave a great closing above important Fibonacci resistance. Today Nifty closed at 25239 which is fairly above the Fibonacci resistance at 25152. The next Fibonacci resistance is at 25378 which is also a Trend line resistance.
Before reaching there the resistance just round the corner is at 25244. So the key resistance now are at 25244 and 25378. Above 25378 there is possibility of very strong bullish breakout which can lead Nifty towards 25554 and 25669. Supports for Nifty currently remain at 25152, 24994 both Fibonacci levels.
Mother line support of daily chart remains at 24844. Shadow of the candle right now neutral as the RSI on hourly chart is getting into overbought zone. RSI however on the daily chart still shows more room to grow.
Disclaimer: The above information is provided for educational purpose, analysis and paper trading only. Please don't treat this as a buy or sell recommendation for the stock or index. The Techno-Funda analysis is based on data that is more than 3 months old. Supports and Resistances are determined by historic past peaks and Valley in the chart. Many other indicators and patterns like EMA, RSI, MACD, Volumes, Fibonacci, parallel channel etc. use historic data which is 3 months or older cyclical points. There is no guarantee they will work in future as markets are highly volatile and swings in prices are also due to macro and micro factors based on actions taken by the company as well as region and global events. Equity investment is subject to risks. I or my clients or family members might have positions in the stocks that we mention in our educational posts. We will not be responsible for any Profit or loss that may occur due to any financial decision taken based on any data provided in this message. Do consult your investment advisor before taking any financial decisions. Stop losses should be an important part of any investment in equity.
Operación activa
Market Outlook: Things looking rosy but caution must. (chart remains same as yesterday only one difference 25244 is a support now instead of resistance).We had depicted 25244 and 25378 as 2 important resistances for this week. Nifty has knocked out 25244 today now one of the most important resistances 25378 remains to be conquered. This resistance can provide a stiff challenge as it is a Fibonacci + Trend line resistance. The resistance is tough but Nifty momentum is good. If Nifty is able to cross and close above it the next resistances will be 25554 and 25669 as mentioned in Yesterday's message. If Nifty is not able to cross 25378, the support zones will be 25244 (Which was a resistance yesterday but is now a support).
Those who follow me for a long time know my famous dialogue and example regarding support and resistance (Gangadhar hi Shaktimaan hai) (a resistance becomes support once we get a closing above it and Support becomes resistance once we get a closing below it.).
Other than 25244, 25152 and 24994 will also be supports for Nifty. Things look favorable as of now lot of sectors and stocks trying to turn the corner, keeping my fingers crossed. (Let the latest round of trade talks with use give some positive result, it will provide much needed catalyst for market growth.)
Exención de responsabilidad
La información y las publicaciones que ofrecemos, no implican ni constituyen un asesoramiento financiero, ni de inversión, trading o cualquier otro tipo de consejo o recomendación emitida o respaldada por TradingView. Puede obtener información adicional en las Condiciones de uso.