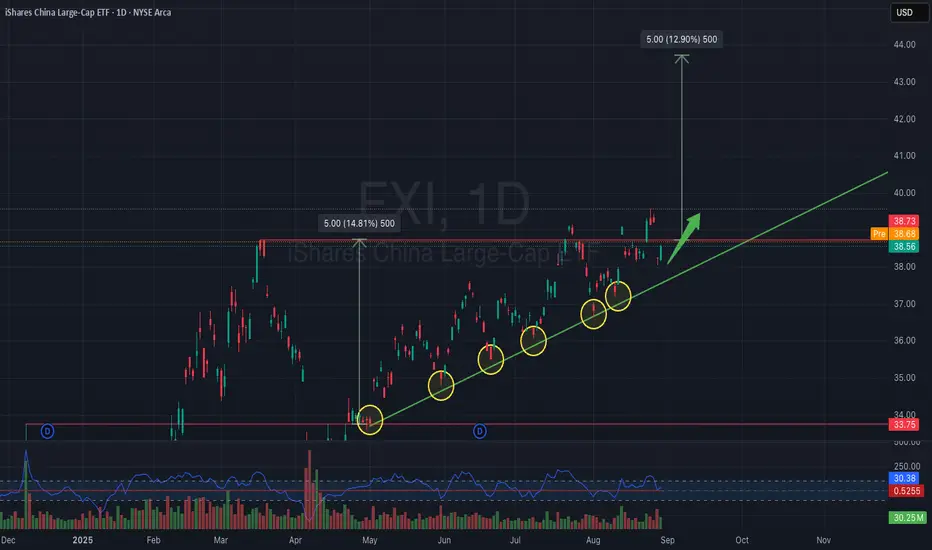
The chart of iShares China Large-Cap ETF (FXI) shows a strong ascending trendline, tested multiple times (yellow circles), confirming bullish support.
Currently, FXI is consolidating just below resistance at $39, and a breakout above this level could trigger a strong upward move. The projected target is around $43–44, which aligns with a 12–13% upside potential.
Entry Zone: Above $39 breakout
Target Price: $43–44
Stop Loss: Below $37 (trendline support)
Momentum is supported by higher lows, consistent trendline touches, and a constructive RSI setup. If the breakout holds, bulls may push FXI toward prior highs.
Exención de responsabilidad
La información y las publicaciones que ofrecemos, no implican ni constituyen un asesoramiento financiero, ni de inversión, trading o cualquier otro tipo de consejo o recomendación emitida o respaldada por TradingView. Puede obtener información adicional en las Condiciones de uso.