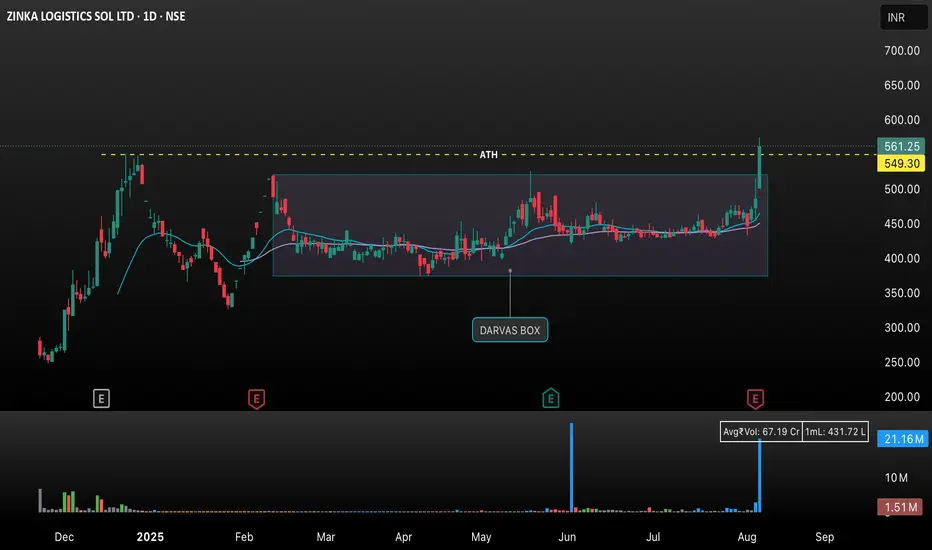
This chart shows the daily price action of Zinka Logistics Sol Ltd (NSE) with a focus on recent technical developments:
• Darvas Box Pattern: For several months, the stock price traded sideways within a well-marked “Darvas Box” range, approximately between ₹400 and ₹549.30. This represents a consolidation phase where the stock found both support and resistance within this zone.
• All-Time High Resistance: The yellow dashed line at ₹549.30 marks the previous all-time high (ATH) level, acting as a critical resistance point.
• Breakout and Volume Surge: On the latest trading day, the stock price sharply broke above the ATH resistance, closing at ₹561.25—a gain of 15.66%. This move was supported by a significant spike in trading volume, as shown at the bottom of the chart, which reinforces the breakout’s strength.
• Bullish Signal: Such a breakout from a long consolidation within a Darvas Box, particularly on elevated volume, is typically interpreted by traders as a strong bullish signal, suggesting the start of an upward trend.
• Indicators: The chart also includes a moving average line (light blue) that underscores recent momentum and trend direction.
Exención de responsabilidad
La información y las publicaciones que ofrecemos, no implican ni constituyen un asesoramiento financiero, ni de inversión, trading o cualquier otro tipo de consejo o recomendación emitida o respaldada por TradingView. Puede obtener información adicional en las Condiciones de uso.