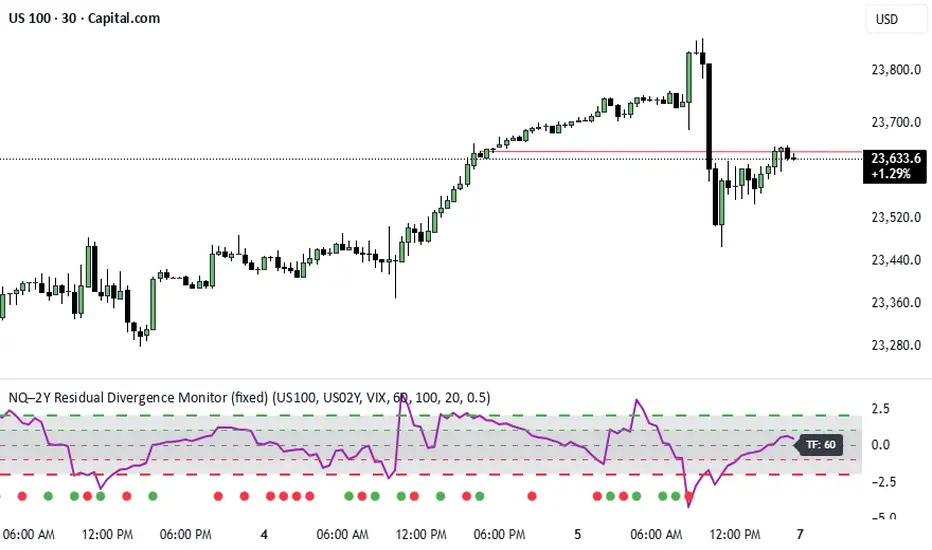
NQ–2Y CorrelationThis indicator tracks the relationship between the Nasdaq futures (NQ) and the US 2-Year Treasury yield (US02Y). The two typically move in opposite directions. This tool highlights when that relationship breaks down, and when moves become stretched to extremes. This can be useful for traders to find inflection points in price representing either overbought or oversold extremes.
Key Features
Residual Z-Score: Shows how far NQ’s returns deviate from what would be expected given moves in the 2Y. Useful for spotting stretched conditions (+/- 2σ bands).
Correlation Tracking: Fast and slow correlations between NQ and inverted 2Y returns. Helps identify regime shifts in the relationship.
Same-Direction Signals: Green dots mark when NQ and 2Y both move strongly in the same direction (rare alignment). Red dots mark strong opposing moves.
Alerts: Triggers available for residual stretches, correlation flips, and significant same-direction or opposite moves.
Usage
Monitor Z-Score to identify when the equity–rates linkage is stretched beyond typical bounds. I typically use this on the H1 or H4 timeframe.
Watch for correlation regime shifts to spot changing market dynamics. Typically price falling into support or moving into resistance as there is a false correlation or a flip.
Same-direction dots help flag unusual synchronized moves between risk assets and yields - these are especially useful for identifying false moves.
Year
Yearly High & LowThe "Yearly High & Low" indicator shows the yearly high and low prices on the chart, providing you with key price levels for each year. It helps you identify significant price ranges and potential support and resistance areas.
Features:
Start Year and End Year: Define the starting and ending years to display the highs and lows within a specific period.
Show Highs and Lows: Toggle the visibility of the yearly high and low lines to focus on specific price levels.
Show Price: Display the price alongside the yearly high and low labels for precise price level identification.
High Colour and Low Colour: Customise the colour of the yearly high and low lines to match your chart preferences.

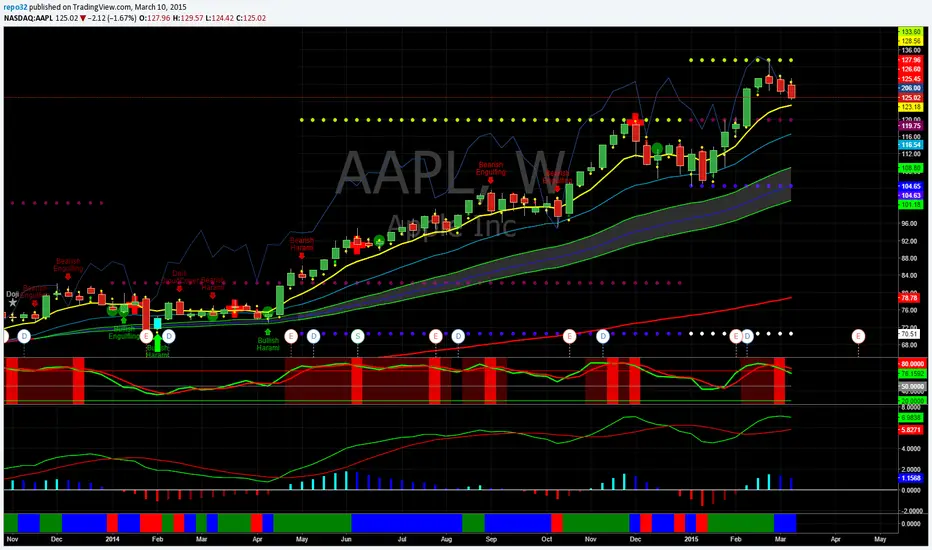
[TTI] Eric Krull's YTD Market Indexes––––HISTORY & CREDITS 🏦
The Eric Krull's Index and Sector Performance Indicator is a powerful tool designed to provide users with a comprehensive view of the market's health and leading sectors. This innovative indicator analyzes various indexes and sectors, including the Nasdaq Composite, Renaissance IPO ETF, NYSE Composite, DJIA, and SP500, as well as 11 custom (user input) ETFs representing major sectors. By offering a detailed look at these indexes and sectors, users can better understand market trends and make informed trading decisions. Credit for the indicator goes to Eric Krull from the Lifecycle Trade team who has showcased the idea for it.
––––WHAT IT DOES 💡
The Eric Krull's Index and Sector Performance Indicator allows traders to:
👉 Monitor the performance of various market indexes, such as the Nasdaq Composite, Renaissance IPO ETF, NYSE Composite, DJIA, and SP500 and compare them to one another
👉Track the performance of 11 user input tickers or ETFs representing major sectors, providing insights into market trends and sector strength (could also compare stocks or other instruments like bonds, crypto or FOREX)
👉Assess overall market health by analyzing the Year-to-Date (YTD) performance of the selected indexes and input tickers.
👉Calculate where in the year to date range is the ticker/sector currently since the beginning of the year.
––––HOW TO USE IT 🔧
Using the Eric Krull's Index and Sector Performance Indicator is simple:
👉Add the indicator to your TradingView chart by searching for " Eric Krull's YTD Market Indexes" in the indicators list.
👉Customize the indicator by entering your desired symbols for the 11 custom ETFs, representing the major sectors you wish to analyze.
👉Adjust the table position on your chart by selecting from the available options: Top Left, Top Center, Top Right, Middle Left, Middle Center, Middle Right, Bottom Left, Bottom Center, or Bottom Right.
👉Review the table to analyze the YTD performance, percentage change, and range of each index and sector, which will help you identify leading sectors and gauge overall market health. Compare the sectors against one another to see where money are flowing in and also compare the overall performance in the index.
By utilizing the Eric Krull's Index and Sector Performance Indicator, you can make informed trading decisions based on the current market trends and sector performance. Stay ahead of the market by understanding which sectors are leading and use this knowledge to adapt your trading strategy accordingly.

Moon Phases + Daily, Weekly, Monthly, Quarterly & Yearly Breaks█ Moon Phases
From LuxAlgo description.
Trading moon phases has become quite popular among traders, believing that there exists a relationship between moon phases and market movements.
This strategy is based on an estimate of moon phases with the possibility to use different methods to determine long/short positions based on moon phases.
Note that we assume moon phases are perfectly periodic with a cycle of 29.530588853 days (which is not realistically the case), as such there exists a difference between the detected moon phases by the strategy and the ones you would see. This difference becomes less important when using higher timeframes.
█ Daily, Weekly, Monthly, Quarterly & Yearly Breaks
This indicator marks the start of the selected periods with a vertical line that help with identifying cycles.
It allows to enable or disable independently the daily, weekly, monthly, quarterly and yearly session breaks.
This script is based on LuxAlgo and kaushi / icostan scripts.
Moon Phases Strategy
Year/Quarter/Month/Week/Day breaks
Month/week breaks

[Antipanicos] Year-over-Year YoY ChangeYear-over-year growth compares a company's recent financial performance with its numbers for the same month one year earlier. This is considered more informative than a month-to-month comparison, which often reflects seasonal trends.
Yearly CandlesPlots yearly candles from monthly candles data. This indicator could also be used to view yearly candles of those symbols for which candlesticks are not available in TradingView (for e.g., ECONOMICS:USINTR , ECONOMICS:USIRYY , ECONOMICS:USWG etc)
As these are not out of the box candles they do have these shortcomings -
Last candle's data is not available in status line, a separate label lists OHLC and change details near its close level
The very first candle's width may vary based on how much data is available for that year
Works only with monthly timeframe
Only those indicators that can be added on other indicators can be applied, however, they may still not work as intended as this still technically is a monthly chart!

DateNow█ OVERVIEW
Library "DateNow"
TODO: Provide today's date based on UNIX time
█ INSPIRATIONS
Use pinescript v4 functions such as year(), month() and dayofmonth().
Use pinescript v5 function such as switch.
Export as string variables.
Not using any match function such as math.floor.
█ CREDITS
RicardoSantos
█ KNOWN ISSUES
Date for Day display incorrectly by shortage 1 value especially Year equal to or before 1984
Timezone issue. Example : I using GMT+8 for my timezone, try using other GMT will not work. Al least, GMT+2 to GMT+13 is working. GMT-0 to GMT+1 is not working, although already attempt using UTC-10 to UTC-1.
dateNow()
: DateNow
Parameters:
: : _timezone
Returns: : YYYY, YY, M, MM, MMM, DD

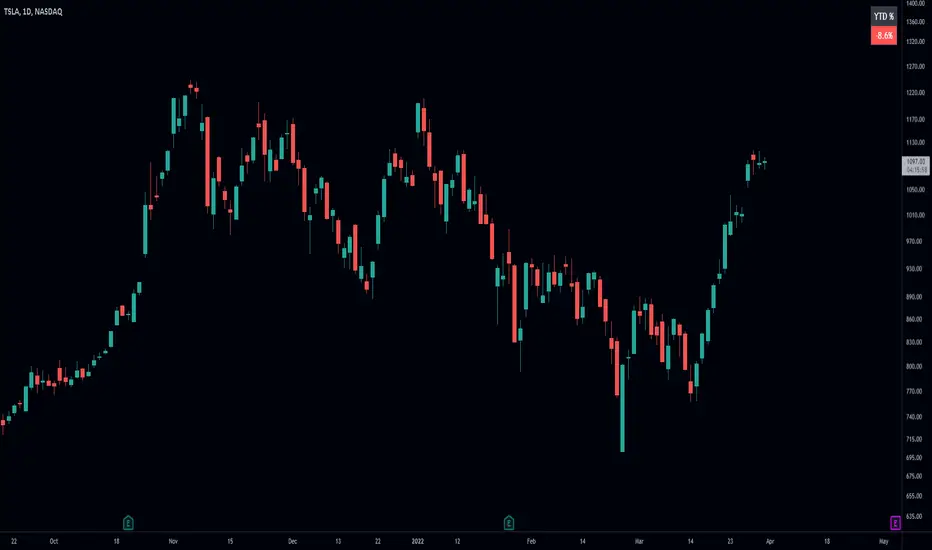
Year-to-Date (YTD) % ReturnYear-to-Date (YTD) return describes the return so far this year. It refers to the amount of profit made by an investment since the first day of the current year to the present day. Investors and analysts use YTD returns information to assess the performance of investments.
Additionally, the tool allows you to set custom (up to 6) levels to trigger alerts.

Year Open Price LevelAn utility tool that plots a dynamic level using the opening price of each year on the chart.
Allows to highlight the change in the price relative to this level.

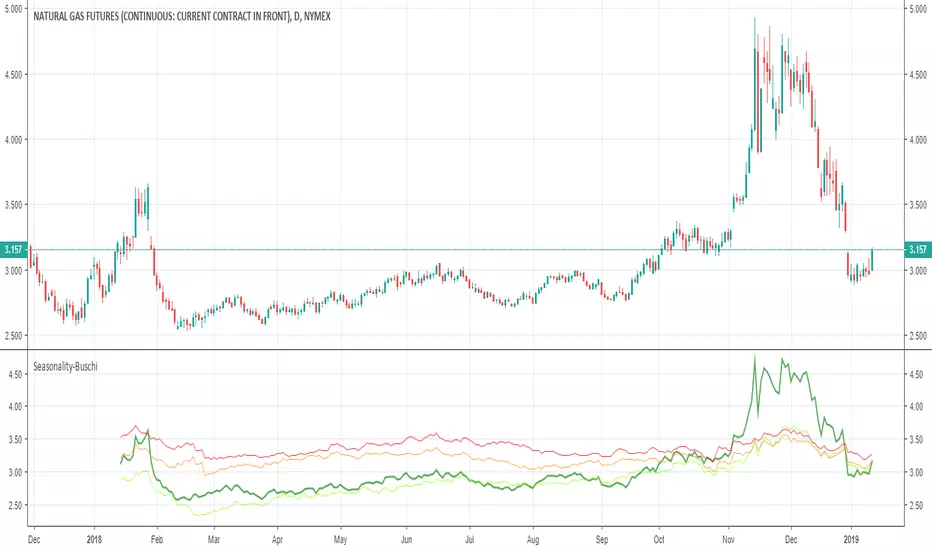
Seasonality-Buschi
English:
This script shows the price development over the last year (default: green) and mean prices over the last three (default: light green), six (default: orange) and nine (default: red) years and is therefore at least some kind of approach towards true seasonality.
Thanks to user "apozdnyakov" for providing most of the code!
Deutsch:
Dieses Skript zeigt den Kursverlauf über das letzte Jahr (Standard: grün) und die durchschnittlichen Verläufe über die letzten drei (Standard: hellgrün), sechs (Standard: orange) und neun (Standard: rot) Jahre und stellt damit zumindest eine Annäherung zu einer echten Saisonalität dar.
Dank an User "apozdnyakov", der den Großteil des Codes zur Verfügung gestellt hat!
Seasonality (advanced)Script show up to 7 previous values of 'source' input for a specified period of days. Use inputs to select period: 365 (approximately) for years, or any other period (1, 7, 30, 90...). You can hide extra plots, customize their colors, apply this to another indicator or enable 'trackprice'.
On showcase:
Top indicator shows a close price for previous 3 years, and curent year
Bottom: a volume ma for previous years.

High Low YearlySorry for the mess above. Not sure how to remove it. It was not what I was looking to post. I added the the clean chart below.
This was requested by "N". It displays the current yearly highs and lows along with the previous years highs and lows. Just a nice way to see the support resistance in all time frames.