EMA ConfirmatorShows if the cross of 2 EMAs is bullish or bearish and confirms with the cross of 2 others EMAs from the next upper timeframe.Indicador Pine Script®por Silver-WongActualizado 2525393
MAs SuperTrend Res&SupHi guys, This is a combination of MAs, Supertrend, and SP&RS Enjoy!!Indicador Pine Script®por markthang55229
GMS: Keltner ChannelsBasically I wanted to make this into one indicator instead of three while adding in some extra options as well... So this is just a Keltner Channel with three channels, all of which have the same length. I have also added in an option to select the moving average for the channel, the original is based on the EMA. The source code should be open so take a look around and enjoy! AndreIndicador Pine Script®por GlobalMarketSignalsActualizado 127
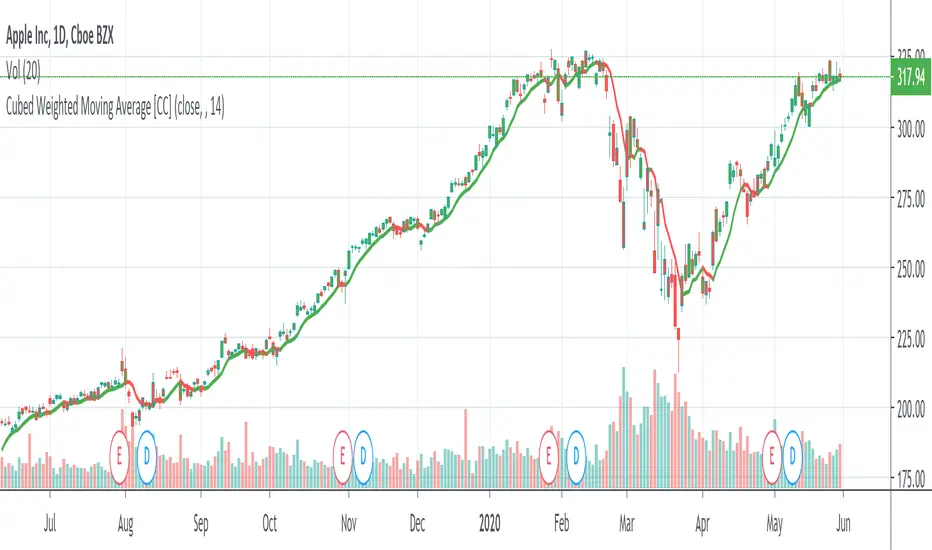
Cubed Weighted Moving AverageThis is another indicator that I have created that is my favorite script yet for a weighted moving average. This indicator is very similiar to a classic weighted moving average but in this version I'm cubing the weights. It hugs the price very closely as you can see and of course buy when the indicator line is green and sell when it is red. Let me know if you would like me to publish other scripts or if you want something custom done!Indicador Pine Script®por cheatcountryActualizado 1414124
WMA/LSMA - Simplified CalculationsLots of moving averages are based on a weighted sum, the most common ones being the simple (arithmetic) and linearly weighted moving average. The problems with the weighted sum approach is that when your moving average is a FIR filter then the number of operations increase with higher values of length, and when the weights are based on a complex calculation this number of operations can increase drastically! For the common technical analyst the calculation time of moving averages can be an insignificant factor, even more when using higher time frames, however its always a good practice to seek better performances. The SMA has already a calculation where the number of operations is independent of its length, as such it can be easy to do the same for the linearly weighted moving average (WMA). This post will describe the process toward calculating a simple and efficient WMA which will then be used to provide an efficient calculation of the least squares moving average (LSMA). Carving Impulses Responses Remember that impulses responses fully describe the properties of moving averages, the impulse response of the WMA is a linearly decreasing function, so we'll try to calculate it without using a weighted sum. We first need to use a cumulative sum, the cumulative sum can be described as a summation from the first element of a series to the n th element of the series, where n is the current bar number, one could say that this operation is actually super inefficient, however this is not the case, as a cumulative sum can be calculated recursively as follows: y = y + x The cumulative sum can be described as an amplifier and posses the following impulse response: Once the cumulative sum receive the impulse signal as input the result will always be equal to 1. This will form the basis of our simplified calculation, all we need to do transform this response into a linearly decreasing one. The full process is as follows: Get the impulse response of the cumulative sum Subtract this response from a linearly increasing impulse response of size length Normalize the result such that the sum of the resulting response is equal to 1 We need a linearly increasing response of size length , this can be done by using a running sum of the original cumulative sum response, however we must make sure that the value of this response is 0 when the one of the cumulative sum is first equal to 1. Because the resulting response as a maximum value of length we need to multiply our cumulative sum response with length , then we proceed to subtraction. Finally we need to normalize the result, the sum of a linear sequence of values starting at 1 and ending at n is given by the explicit formula : n(n+1)/2 , which in our case give length*(length+1)/2 , we divide our previous response with this result and we end up with the impulse response of a WMA. This process can be graphically described as follows: We can then replace the impulse function by the closing price in order to get the WMA of the closing price. Advantages And Disadvantages The big advantage of this calculation is its efficiency, in its non functional form (you can see it in the code) the calculation of the WMA only require 9 operations regardless of the value of length against length*2 + 4 for the weighted sum approach, as such both methods are equally efficient in terms of operations as long as the length of a standard WMA is inferior to 3, which is ridiculous, as such our approach is more appropriate. Another advantage is that Pinescript does not allow for series as length arguments in the WMA function, however here we can have a variable length for the WMA. Of course there are disadvantages to this approach, in terms of code we require more variables for the non functional form, which create a lengthier scripts. Another disadvantage is that we can be prone to rounding errors due to the cumulative sum, however they shouldn't be significants in our case. Getting The Least Squares Moving Average The LSMA is one of my favorite moving averages, and it can derived from a linear combination between the WMA and SMA described as follows : 3WMA - 2SMA. Since we proposed an alternative calculation of the WMA we can then calculate the LSMA without even using the SMA, why ? because the SMA can be calculated by computing the changes over length period of the cumulative sum of an input, this result is then divided by length . Remember that the impulse response of a cumulative sum is just a rectangular function, all we need is to truncate it such that only length values of the response are equal to 1, this is done thanks to the change function in Pine. In Summary A more efficient calculations for both the WMA and LSMA have been presented, while this on itself isn't super important you have learned what is the process toward calculating a filter without relying on a weighted sum. This calculation will soon be included in the Pinecoders script allowing series as length argument. Thank you for reading, your interest is always appreciated ! Indicador Pine Script®por alexgrover1313325
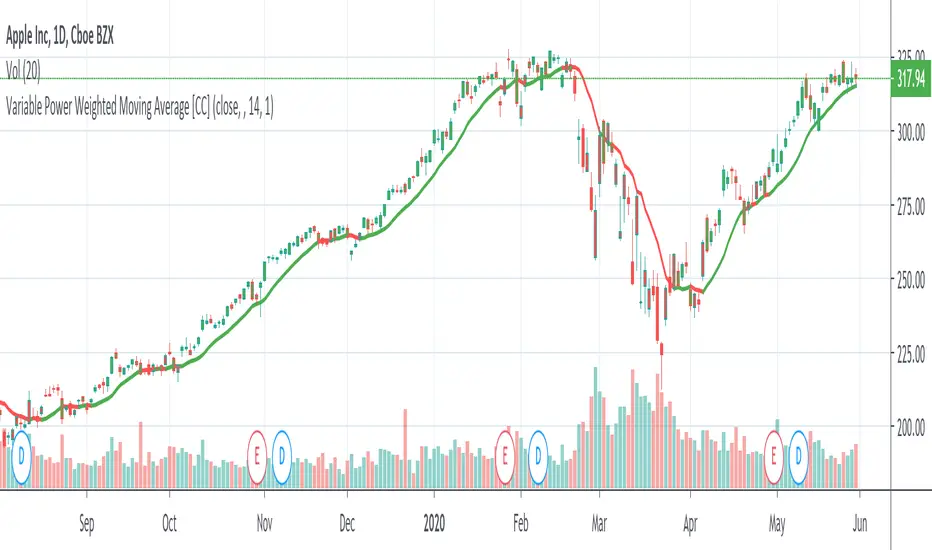
Variable Power Weighted Moving AverageThe Variable Power Weighted Moving Average was created by RedKTrader so make sure you follow them! This is a very handy indicator where you can change the weights of the weighted moving average yourself! For an easy guide here are common values to use to convert this indicator into other indicators: Power = 0 = Simple Moving Average Power = 0.5 = Square Root Weighted Moving Average Power = 1 = Weighted Moving Average Power = 2 = Squared Weighted Moving Average Try it out and let me know what you think! Let me know if you have other ideas for me or if you want something custom done!Indicador Pine Script®por cheatcountryActualizado 22153
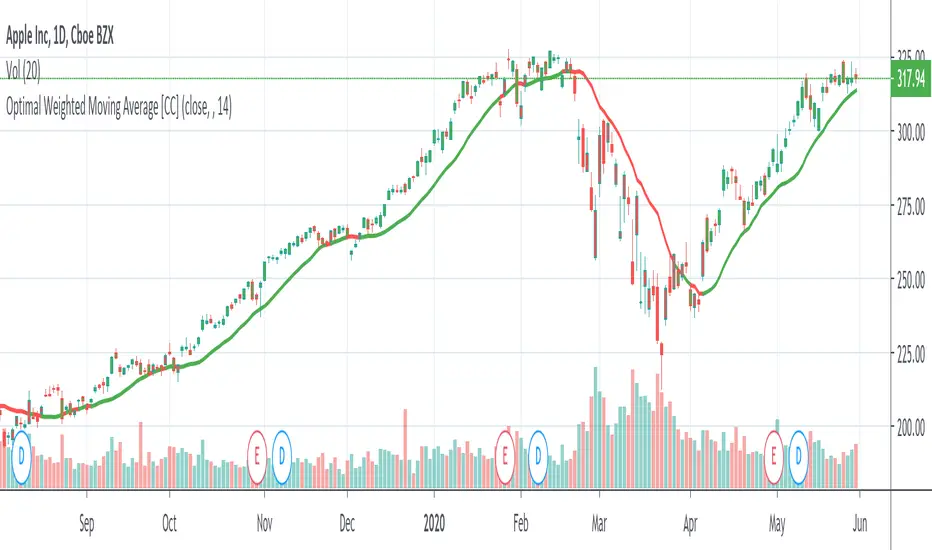
Optimal Weighted Moving AverageThe Optimal Weighted Moving Average was created by Thomas Hutchinson and Peter G. Zhang, Ph.D. (Stocks & Commodities V. 11:12 (500-505)) and it is very similar to a classic weighted moving average but it uses the correlation between the input and the optimal weighted moving average output to use as the weights. Buy when the line turns green and sell when it turns red. Let me know if you would like to see me publish any other scripts or if you want something custom done!Indicador Pine Script®por cheatcountryActualizado 1212433
Squared Weighted Moving AverageThe Squared Weighted Moving Average is similar to the classic Weighted Moving Average but the difference is that it squares the weights instead of the classic weight values. Buy if the indicator line is green and sell when it goes red. Let me know if you would like to see any more scripts from me or if you want something custom done!Indicador Pine Script®por cheatcountryActualizado 111159
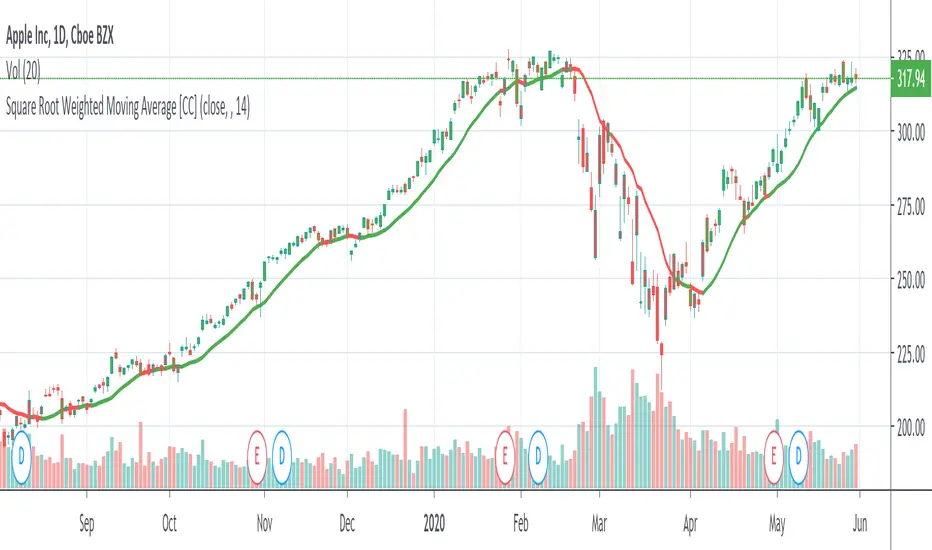
Square Root Weighted Moving AverageThe Square Root Weighted Moving Average is similar to the classic Weighted Moving Average but the difference is that it uses the square root of the weights instead of the classic weight values. Buy if the indicator line is green and sell when it goes red. Let me know if you would like to see any more scripts from me or if you want something custom done!Indicador Pine Script®por cheatcountryActualizado 66214
Moving Average RibbonMoving Average Ribbon: ----------------------------------------------------------- A series of moving averages of different lengths to create a ribbon-like indicator. Traders can determine trend strength by the distance between the moving averages, the overall balance of the coloured lines and determine price points. Price movements through the ribbon can be used to identify trend changes. SMA, EMA, WMA with user defined length, starting plot, number of plots to show, theme choice and colour calculation toggle. Inputs: ----------------------------------------------------------- Source: input value for MAs (close) Type: moving average type (ema) Theme: multiple colours/themes (theme 2) Length: MA length (13) Start: MA plot number to start ribbon on (1) No. of MAs: number of plots to show; maximum 32 (32) Colour option: unchecked then line colour is based on the source value crossing current MA otherwise the moving average below (false) Example: ----------------------------------------------------------- multiple MAs overlaid with different values give interesting results e.g. Ribbon1 : length: 13 start: 1 Ribbon2: length:1 start: 26 Notes: ----------------------------------------------------------- if increasing the length beyond around 150 results in "references too many candles in history" error then reduce the no. of MAs value to show less MA plots; the longer length MAs will go beyond the 5k max candle history.. Indicador Pine Script®por ViolentActualizado 2323 1.9 K
The V_Wave: Volatility Adaptive Moving AverageThis is work in progress - but i wanted to see if there's interest to use or test it - or if someone finds it useful. there's already a crowd of great moving averages out there :) This is a different type of zero-lag weighted moving average - and it's a concept that i have been working on for a while now. Given that this is WIP, i decided to keep the code protected for now. The idea is to create a moving average that responds faster to the changes in the underlying data - which is the case with other zero-lag moving averages - but in this case, i also wanted to make it adaptive, so it accelerate when the volatility increases and at the same time, maintain limited lag and reasonable smoothing, even at longer length. How Does it Compare to other MA's ============================== in the chart, we can see a comparison between the V_Wave (thick yellow line) and the 3 common MAs, Hull Moving Average (HMA, aqua), a Weighted Moving Average (WMA, brown) and an Exponential Moving Average (EMA, grey) the most important advantage in V_Wave, is because of the way the algorithm works, and that it maintains direct association with the underlying data and the given length, the V_Wave will have less overshoot when compared to other moving averages - i.e, it stays closer to the underlying data points at times of quick reversals or big changes - like the V reversal on the right of the chart. You can also test it against other MAs you may be already using and share your findings back with me. settings: ========= - the settings provide the ability to choose the source data (close vs hl2, ..etc), the length, and the ability to adjust the "aggressiveness" of the line (Accelerator) .. - this accelerator is the factor that tells the V_Wave how fast to respond to the volatility changes. when you increase the accelerator, the V_Wave is more aggressive, and will respond faster to changes in volatility -- it becomes more responsive to changes in the trend, but that will sacrifice the smoothness of the line. - i capped this value to 7, because beyond that, the accelerator will have a diminished effect. - Also note that due to association with volatility, the V_Wave will behave differently at lower time frames -- and becomes closer to an EMA but better (in responsiveness) than a WMA. - the smoothing is built-in for now, and will adjust based on the length, in a way similar to how HMA smoothing works (see my previous post on Evolving the Zero Lag MA for details on that) - in future versions, i may make it a manual entry or a selection between manual/automatic Usage: ======= Use the V_Wave as you use other moving averages - once you get to know how it behaves and adapts to underlying data changes. you can use it as a filter to generate signals once it crosses other MAs, or another V_Wave of a different length / acceleration. will be great if you share your test results and your use cases to help me improve how the V_Wave works. best of luck! Indicador Pine Script®por RedKTraderActualizado 22144
TA Basics: Evolving our Zero Lag Moving Average.In the previous Zero-Lag MA post, we introduced the "mirroring" technique and the associated calculation. In this post, we will see how we can use the same technique, with a slight variation, to evolve our zero lag moving average line, add more "smoothness" and still maintaining the low lag and fast response to data series changes. to use the "mirroring" technique, we need to use 2 MA lines with varying speeds - this is essential to produce the delta between the lines, that can then be mirrored around the fast line to produce the final line. in the first example, we used a Simple MA (slow) and a Weighted MA (fast) of the same length to achieve that. here we introduce a different way of doing that. we will use a Weighted MA of the length (slow) and another Weighted MA of half the length (fast) -- the difference in "speed" between these 2 lines should produce the delta we need, we mirror it around the fast line, and we get our desired Zero-lag line. Check! then while we're at it, why don't we introduce an additional smoothing just to ensure the new line is not too "broken" and jumpy .. and flows smoothly across the data series. but what length should we use for smoothing? smoothing length should be enough to make an actual smoothing effect, but not too large else it will introduce lagging on its own. how about 3? usually 3 or 4 are good values for smoothing. A brilliant idea here is to use a number related to the same input length of the original line, which can always be relatively small -- the square root (integer portion) of that original length - and in that case, the user will only need to enter 1 input for the moving average, just the length - everything will be calculated from there. Check again! I commented the code if you like to follow the simplified build-up of the formula, now that the concept is explained. the (more complex-looking) 1-line, condensed form of that formula to use is (alert: watch out for the ()'s -- they're tricky :) ) ---------------------------------------------- ZLMA_Line = wma((2*wma(close,int(length/2)) - wma(close,length)), int(sqrt(length))) ------------------------------------------ the one thing i do not like about this technique, is that we introduce the use of the half length MA. i do not like to build indicators that make decisions like this on behalf of the trader - the trader wants to analyze the data for a specific length, and we should continue to stick to that consistently across the moving average (or whatever indicator) calculation. I would always be caution about "hardcoding" some optional values (in this case 0.5 * length) within the indicator itself - others may not mind that. Now to a nice surprise for the patient folks who got so far in this post - Congratulations, we have just discovered the concept and the formula behind the famous Hull Moving Average .. the big thing here is, we just had the opportunity to learn how to create the whole thing ourselves from the ground up step by step, and had fun doing it (I hope!) -- these posts are meant to provide those who are new to the world of technical analysis and want to learn how and why to build their own technical indicators. i hope some of you find them useful and interesting, and i wish you the best of luck. Indicador Pine Script®por RedKTrader22121
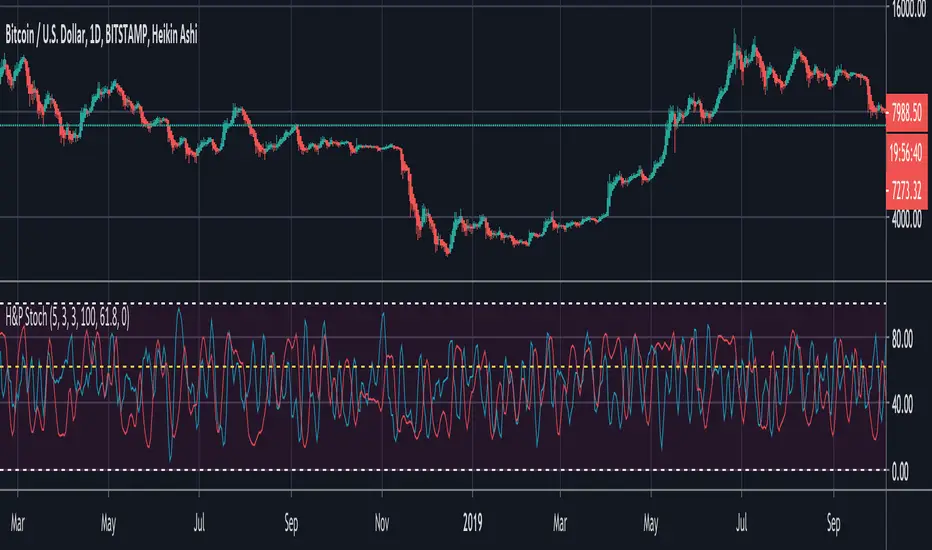
BTC Hash Rate & Price Stochastic IndiciatorFresh off the press, we have a new breed of indicators: Bitcoin's Hash Rate & Price. As many of you have read, roughly 80% of BTC's price movements can be correlated to its changes in hash rate volume. I decided to make a stochastic indicator that utilizes this principle to track divergence of the price from the hash rate. Let's break this down... In red is the CLOSE of BTC's Price, which is then smoothed by a SMA, and smoothed again by a WMA. In aqua is a STOCH of BTC's Hash Rate, which is then smoothed by a SMA, and smoothed again by a WMA. The reason why I chose to use the CLOSE of the Price versus a STOCH as I did with the Hash Rate, is because the price tends to signal trends via divergence from the Hash Rate, and eventually converge with the Hash Rate at some point. You will notice that anytime there is a significant divergence of the RED from the AQUA, a trend is closely aligned with it. This indicator does a remarkable job of indicating the beginnings and ends of both bullish and bearish price movements. Example Strategy: Enter long when RED (price) crosses over AQUA (hash rate), and close long when RED crosses under AQUA. The inverse can be done for shorts, just RED diverges downwards from AQUA versus upwards. Note: Unlike a normal Stochastic Indicator, the upper and lower bounds do not appear to hold any significance. In other words, the lines do not seem to reverse at 20/80. As a result, I just set them to 0/100 for aesthetics. DO NOT make trades based off of small divergences, or simply enter into positions based off the price divergences. Though this indicator times the start/end of movements very accurately, it also comes riddled with false breakouts . Proceed at your own pace, and please, toy around with the inputs values. I experimented with a few combinations, but I'm sure there are better value combinations that yield sharper results with fewer false signals. EASTER EGG: Notice the "Golden Line"? Any avid user of TV knows that Fibonacci ratios show up everywhere in markets. With that said, I plotted a horizontal line at 0.618, which is 1/Phi, an important level in Fibonacci retracements. Final Comments: First, this is not investment, merely my experimentation and observation of happenings in the analytical world. Second, please comment questions, improvements, etc. Dialogue opens up room for exploration! Indicador Pine Script®por Riester33101
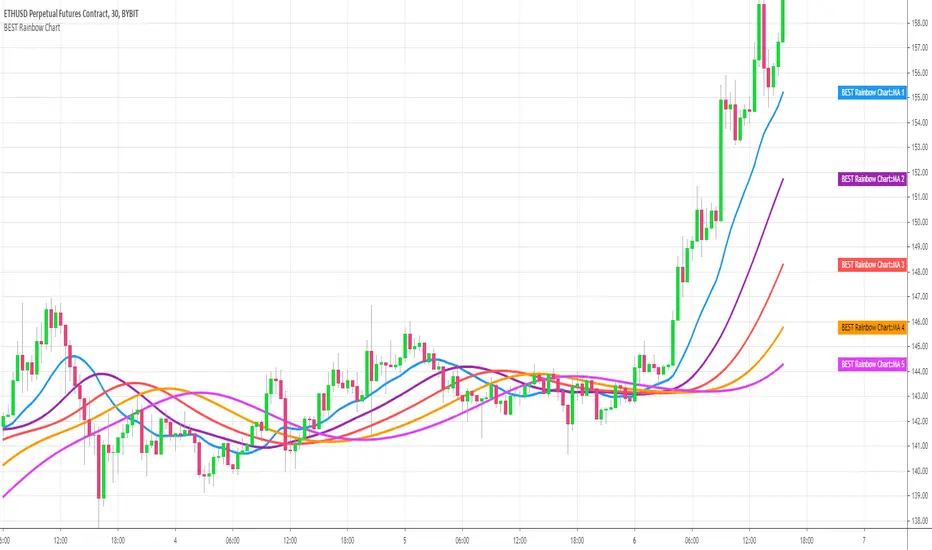
BEST Rainbow ChartHello traders This script is a Pinescript adaptation of this FXCM/LUA script Draws a flexible number of moving averages between 1 and 5 - with a end result looking like a rainbow Formula Each Moving Average is defined as a Moving Average of the previous MA The first MA is based on candle close MA = MA of Price MA = MA of MA .... MA = MA of MA Bonus You can select the MA type (EMA, SMA, SMMA, TEMA, DEMA, TMA, ALMA, VWMA, ...) and the MA period shared across all the moving averages Scaling If you have any issue with your scaling, you may follow this quick tutorial Hope you'll like it because it looks nice on your chart :) DaveIndicador Pine Script®por Daveatt1212617
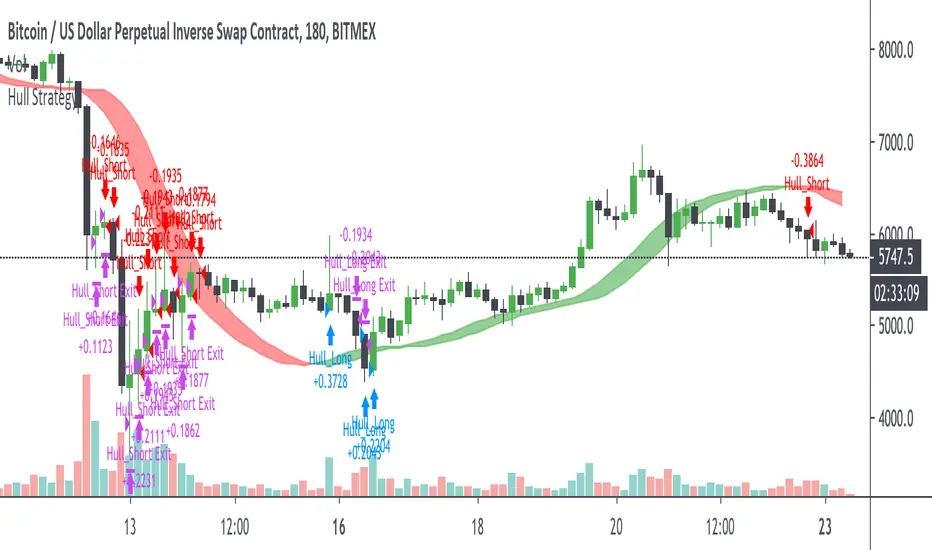
Hull Strategy [Bitduke]Description The Hull Moving Average (HMA) was developed by Alan Hull for the purpose of reducing lag, increasing responsiveness while at the same time eliminating noise. Its calculation is elaborate and makes use of the Weighted Moving Average (WMA). It uses two lagged hull moving averages at the intersection of which a change in trend is determined. Risk Management Risk is managed by limiting the loss per trade (in%) using stop loss variable. Improvements Can be improved by experiments with stop loss and take profit. Backtesting Bitmex XBTUSD Timeframe 3H Stop 2%, take profit : n/a 193.5% profit 22.42% drawdown FTX BTC-PERP Timeframe 3H Stop 2%, take profit : n/a 187.5% profit 14.79% (!) drawdown FTX SHIT-PERP Timeframe 3H Stop 2%, take profit : n/a 112.5% profit 13.79% (!) drawdown Estrategia Pine Script®por Bitduke1135
Trend Line_TradersStreamIn this Indicator you will find Multiple Trend Lines like SMA , EMA, RMA, WMA and VWMA. And this Trend lines shows Daily, Weekly and Monthly Trend on any time frame chart. So, that you can get overall trend of the Stock.Indicador Pine Script®por mohsinsait36
Bitcoin Cycle Top IndicatorBitcoin Cycle Top Indicator on the 1W Bitcoin Logarithmic chart. Called all 3 tops so far to a T, this indicator will be great use for the next upcoming cycle. I kept it sweet and simple, no need to overcomplicate. That's all this indicator does.Indicador Pine Script®por kyer77101
WMA + MACD strategy with trailing stopHi! That's my first strategy. I already learn pine, so i will work on it more. Now i search how to make trailing stop working. "WMA + MACD strategy with traiing stop" is very simple strategy which is designated for stocks market. It is created only to take long positions. Buy signal is when WMA(120) is below price and macd(10,20,10) histogram is higher than 0. Position should be automaticly closed when price hits stoploss level. One transaction should be max 20% of our capital and stoploss is set 3% lower than last closing price.Estrategia Pine Script®por heniu_111100
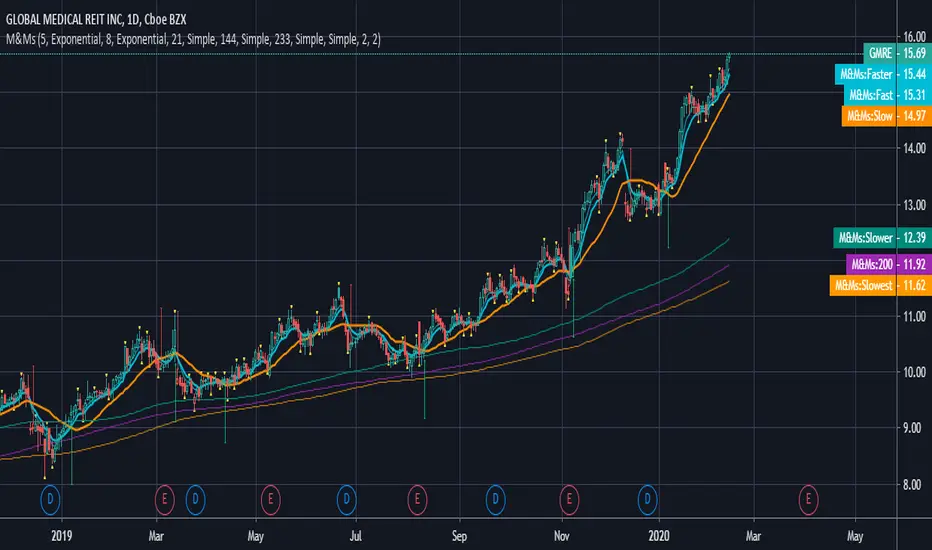
M&Ms - Multiple Moving Average Indicators This version includes Simple, Exponential and Weighted Moving Averages.Indicador Pine Script®por Aldovitch63
Average Price by Atilla YurtsevenHi Traders, This is one of the most important indicators i have developed and I use it all the time and would like to share it with you. What is Average Price? Average price basically shows you the average of the price for the selected period. Let's say you are analysing in hourly chart and you want to know what is the monthly or weekly average price. This indicator helps you to see the average price of selected period. This is not a VWAP but you can enable VWAP from options. Let's say your favorite period for Average price is 1 month. Average Price indicator will reset at the beginning of the each month and you can still enable volume weighted (I personally don't use VWAP). I have also added deviations of average price. This is very useful option. Works like Bollinger Bands. Optionally, previous period's average price can be plotted onto your charts and they work like support and resistance. Please remember to follow me on TradingView so you will be notified as soon as i share a new script or idea. Disclaimer: This is not financial or investment advice Trade safe, Atilla YurtsevenIndicador Pine Script®por AtillaYurtseven44249
[BA] Multi Time Frame Moving Averages for BTCThis is a multi time frame moving average script. It includes 7 moving averages. Most of them are SMAs and WMAs but EMA were also used. Time frame was set to 1 day. It means that you can change the time frame of your chart freely without losing your lines. Levels will not change. I wrote this script just to trade BTC. I prefer daily and weekly charts with this script but lower time frames are also preferable. Since some of the lengths are too high; older exchanges are recommended due to their relatively deep historical data. While MA1 is for taking actions like 'take profit' or 'stop loss' or just to follow 'price action' easily, other MAs are for seeing supports and resistances. MA6 and MA7 are disabled by default in order to minimize the confusion but you can enable them from settings if you need to. Since some newer exchanges have less historical data, you may not see MA4 and MA5 on the daily chart. In such circumstances MA6 and MA7 might be helpful to use as substitution. Some may like to use all of them. I am using this script just for BTC but it can be useful for other coins as well. Indicador Pine Script®por Bukinski22
5WMAs based on GANN numbers 5 13 49 73 198Plots 5 Weighted Moving Averages of 5 13 49 73 198 with source (High+Low+Close)/3 A Cross Appears when 13 WMA Crosses 49 WMAIndicador Pine Script®por vivek_trade22124
TriangularMA from different TimeFrameIndicator calculates TMA from different TF and shows it on current.Indicador Pine Script®por mashidaActualizado 3346