Time & volume point of control / Flowly IndicatorsWhat are TPOC & VPOC?
TPOC (time point of control) and VPOC (volume point of control) are points in price where highest amount of time/volume was traded. This is considered key information in a market profile, as it shows where market participant interest was highest. Unlike full fledged market profile that shows total time/volume distribution, this script shows the points of control for each candle, plotted with a line (time) and a dot (volume). The script hides your candles/bars by default and forms a line in the middle representing candle range. In case of candles, borders will still be visible. This feature can be turned off in the settings.
Volume and time data are fetched from a lower timeframe that is automatically adjusted to fit the timeframe you're using. By default, the following settings are applied:
Charts <= 30 min: 1 minute timeframe
Charts > 30 min & <= 3 hours : 5 minute timeframe
Charts > 3 hours & <= 8 hours : 15 minute timeframe
Charts > 8 hours & <= 1D: 1 hour timeframe
Charts > 1D & <= 3D : 2 hour timeframe
Charts > 3D: 4 hour timeframe
Timeframe settings can be changed via input menu. The lower the timeframe, the more precision you get but with the cost of less historical data and slower loading time. Users can also choose which source to use for determining price for points of control, e.g. using close as source, the point of control is set to match the value of lower timeframe candle close. This could be replaced with OHLC4 for example, resulting in a point of control based on OHLC average.
To identify more profound points of market participant interest, TPOC & VPOC as percentage of total time/volume thresholds can be set via input menu. When a point of control is equal to or greater than the set percentage threshold, visual elements will be highlighted in a different color, e.g. 50% VPOC threshold will activate a highlight whenever volume traded at VPOC is equal to or greater than 50% of total volume. All colors are customizable.
VPOC is defined by fetching lower timeframe candle with the most amount of volume traded and using its close (by default) as a mark for point of control. For TPOC, each candle is divided into 10 lots which are used for calculating amount of closes taking place within the bracket values. The lot with highest amount of closes will be considered a point of control. This mark is displayed in the middle point of a lot:
How to utilize TPOC & VPOC
Example #1: Trapped market participants
One or both points of control at one end of candle range (wick tail) and candle close at the other end serves as an indication of market participants trapped in an awkward position. When price runs away further from these trapped participants, they are eventually forced to cover and drive price even further to the opposite direction:
Example #2: Trend initiation
A large move that leaves TPOC behind while VPOC is supportive serves as an indication of a trend initiation. Essentially, this is one way to identify an event where price traded sideways most of the time and suddenly moved away with volume:
Example #3: POC supported trend
A trend is healthy when it's supported by a point of control. Ideally you want to see either time or volume supporting a trend:
Indicador de volumen

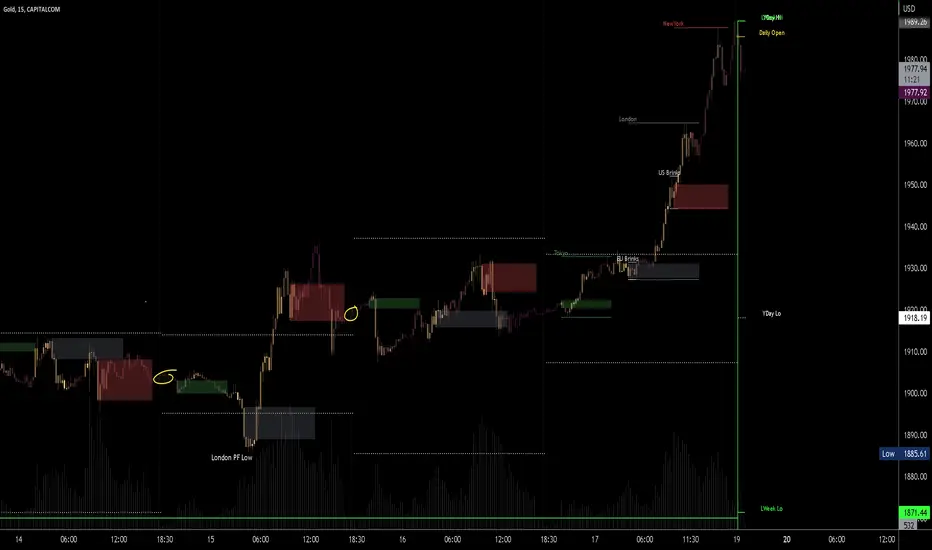
Market sessions and Volume profile - By LeviathanThis script allows you to keep track of Forex market sessions (Tokyo, London and New York), as well as Daily, Weekly and Monthly sessions. All of them are accompanied by Volume Profile options where you can view VP Histogram, Point of Control, Value Area High and Value Area Low.
Colors, lines and other design preferences are fully customizable.
* Volume Profile of shorter sessions (eg. Tokyo, London, New York) works better when using lower timeframes such as 15min, 5min, etc.
** Use timeframe higher than 15min when viewing Monthly sessions
Indicator settings overview:
SESSION TYPE
- Tokyo session (1:00 - 9:00 UTC/ GMT )
- London session (7:00 - 16:00 UTC/ GMT )
- New York session (13:00 - 22:00 UTC/ GMT )
- Daily session
- Weekly session
- Monthly session
DISPLAY
- Show Volume Profile (Show or hide Volume Profile histogram)
- Show POC (Show or hide Point Of Control line)
- Show VAL (Show or hide Value Area Low line)
- Show VAH (Show or hide Value Area High line)
- Show Live Zone (Show or hide the ongoing session)
VOLUME PROFILE SETTINGS
- Resolution (The higher the value, the more refined of a profile, but less profiles are shown on the chart)
- Smooth Volume Data (Useful for assets that have very large spikes in volume over large bars, helps create better profiles)
APPEARANCE
- Up Volume color (Pick a custom color for up/ bullish volume profile nodes)
- Down Volume color (Pick a custom color for down/ bearish volume profile nodes)
- POC color and thickness (Pick a custom color and thickness for Point Of Control line)
- VAH color and thickness (Pick a custom color and thickness for Value Area High line)
- VAL color and thickness (Pick a custom color and thickness for Value Area Low line)
- Session box thickness (Pick a custom thickness for the session box. Color is provided automatically with optimal contrast)
** Some VP elements are inspired by @LonesomeTheBlue's volume profile script

Volume HIGH/CLIMAX
Volume is the number of shares of a security traded during a given period of time.
Generally securities with more daily volume are more liquid than those without, since they are more "active".
Volume is an important indicator in technical analysis because it is used to measure the relative significance of a market move.
The higher the volume during a price move, the more significant the move and the lower the volume during a price move, the less significant the move.
A climax occurs at the end of a bull or bear market cycle and is characterized by escalated trading volume and sharp price movements.
Climaxes are usually preceded by extreme sentiment readings, either excessive euphoria at market peaks, or excessive pessimism at market bottoms.
Essentially, climaxes are a result of a resolution in supply and demand factors.
Buying Climaxes
One of the clearest signals of the end of a bull market is a buying climax, during which volume escalates to extreme levels and bullish euphoria permeates media coverage of stocks, market indices, or commodities . The key trait of a buying climax is the exhaustion of demand as the last buyers enter the market. The final surge of buying typically leads to price spikes, which may last for days, weeks, or months. As demand wanes, buyers become less willing to pay higher prices. There may be a brief period of stagnation in prices before a combination of profit-taking and new sellers set in motion the start of a sharp reversal.
Selling Climaxes
The beginning of a selling climax is often signaled by steadily increasing volume on the sell side of the market as growing pessimism accelerates the downtrend. As the selling climax approaches, the last buyers finally capitulate, driving shares sharply lower. Once the supply side of the market abates, demand at support levels can cause the price to level off before a combination of profit-taking and new buyers set in motion the start of a sharp reversal.
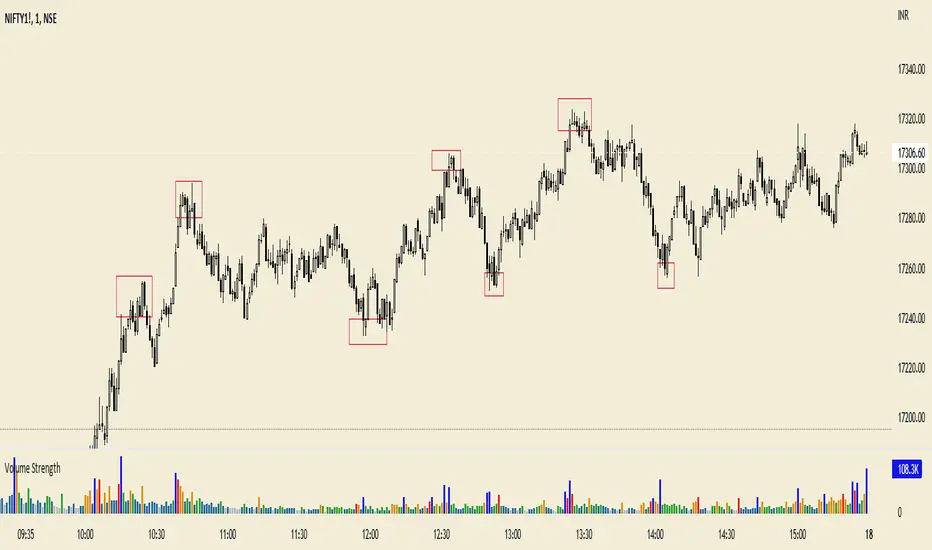
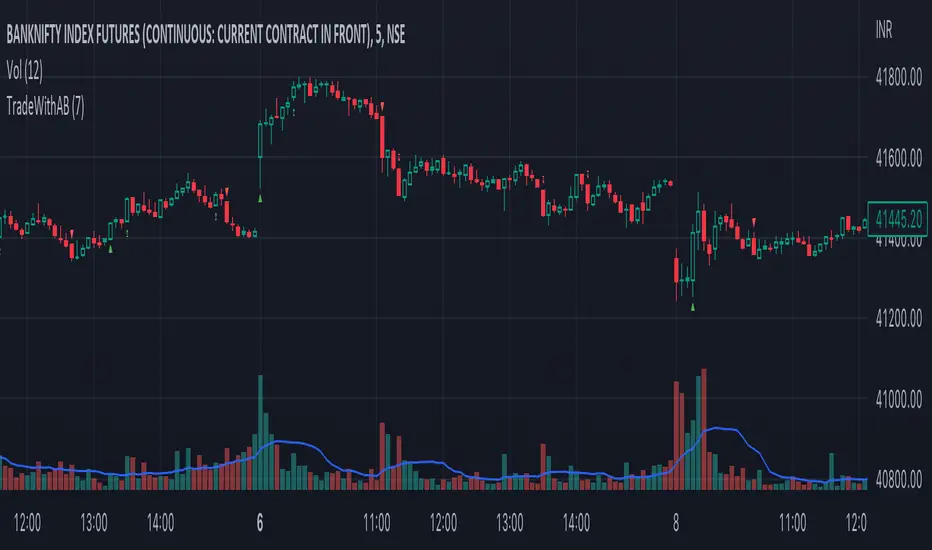
TradeWithAB SignalsThis indicator specifically designed for Momentum trading by an Intraday trader on index( Nifty , BankNifty ) and Equity stocks. This indicator works with DMI and PRICE ACTIONS which gives automated Buy and Sell signals along with Stop loss and Trailing Stop loss when certain criteria are met. It is not a Holy Grail system that gives you continuous profits and it has some limited downfalls also which can be controlled by proper risk Management and position sizing. This is a premium invite only indicator which can be use after given access to you by us. There are some guidelines on how to use this indicator which are given below and you have to follow these guidelines very strictly to get the maximum results.
Guidelines :-
1. Default Timeframe - 5 min
2. You have to take almost all the trade generated by this indicator on a particular stock/index for better results.
3. Signal confirmation is required for enter the trade as it will give you maximum profits.
4. GREEN TRIANGLE is represented as BUY Signal whereas RED TRIANGLE is represented as SELL Signal.
5. GREEN ARROW is considered as BUY TRAILING STOP LOSS as well as BUY RE-ENTRY for some scenarios.
6. RED ARROW is considered as SELL TRAILING STOP LOSS and SELL RE-ENTRY for some scenarios.
7. Ignore the signals(if any) of 1st candle(9:15)and last candle(3:25)of the day for better results.
BUY Trade Management :-
1. Trade should be initiated if and only if there is a buy signal(Green Triangle) is generated.
2. You should only enter the trade at the CLOSE of the signal generated candle.
3. Your Stop loss should be placed at the LOW of the signal generated candle.
4. There is a trailing Stop loss signal (Green Arrow) after the buying signal is generated.
5. You should trail your Stop loss at the LOW of the trailing Stop loss signal generated candle.
6. You should trail your Stop loss repeatedly until your trailing Stop loss got hit and hence Exit your buy trade.
7. After Exiting the trade you always have option to re-enter at the next trailing Stop loss signal(green arrow) generated candle CLOSE and put your Stop loss at LOW of that candle and repeat the same trailing stop loss procedures.
SELL Trade Management :-
1. Trade should be initiated if and only if there is a sell signal(Red Triangle) is generated.
2. You should only enter the trade at the CLOSE of the signal generated candle.
3. Your Stop loss should be placed at the HIGH of the signal generated candle.
4. There is a trailing Stop loss signal (Red Arrow) after the selling signal is generated.
5. You should trail your Stop loss at the HIGH of the trailing Stop loss signal generated candle.
6. You should trail your Stop loss repeatedly until your trailing Stop loss got hit and hence Exit your sell trade.
7. After Exiting the trade you have always option to re-enter at the next trailing Stop loss signal(red arrow) generated candle CLOSE and put your Stop loss at HIGH of that candle and repeat the same trailing stop loss procedures.
Disclaimer :-
*I am not a SEBI Registered Analyst and shall not be liable for any profit, loss or liability resulting, directly or indirectly from the use and results of the indicator. This is not a Holy Grail setup, sometimes the traders hit Stop loss and sometimes it gives amazing results as well.
Instructions to access to this invite-only script:-
*Send us a message if you wish to gain access to this indicator. The subscribers will get benefits of any future development or updates in the current script without any extra charges. Other trading style like swing and positional trading will also available in future updates.
NIFTY IT volumeKEY TAKEAWAYS
-Uses NIFTY IT Index Stocks Volume .
-NIFTY IT Volume Indicator is created by adding all 10 NIFTY IT Stocks Volume together.
-NIFTY IT Volume will be an important indicator in NIFTY IT Index technical analysis because it is used to measure the relative significance of a market move.
-The higher the volume during a NIFTY IT index price move, the more significant the move and the lower the volume during a NIFTY IT index price move, the less significant the move.
-Moving Average is also added.

BetterVolumeAvgPinescript 5 version of buy/sell volume indicator with average. This script is original in that there are no versions of this study written in Pinescript 5 that I know of and while I've seen other buy/sell volume scripts this one includes a moving average.

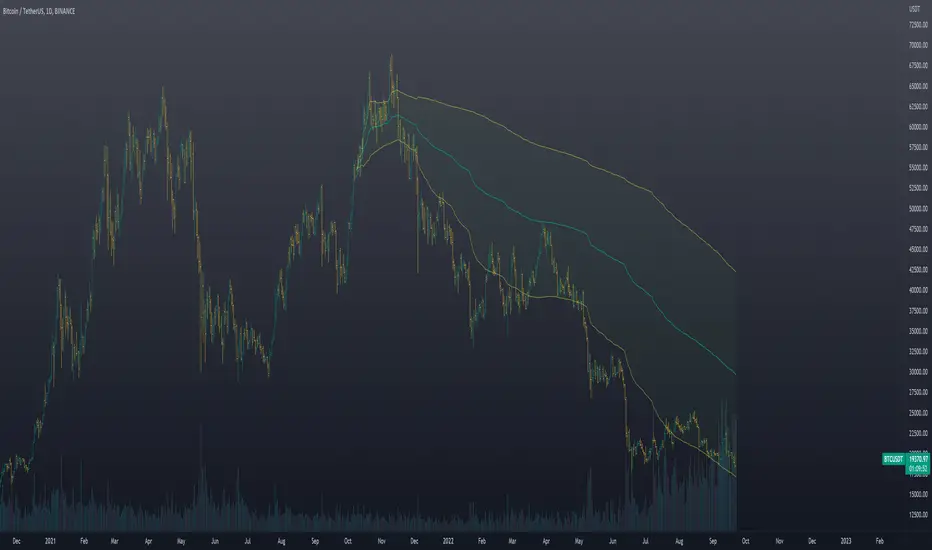
BTC Agg VolumeBTC Volumes for stablecoin trading pairs from multiple exchanges. Volume is grouped by exchanged and appears as stacked bars. Volume data can be filtered by exchange and stablecoin pair. Appearance can be resized over with an option to apply standard deviations.

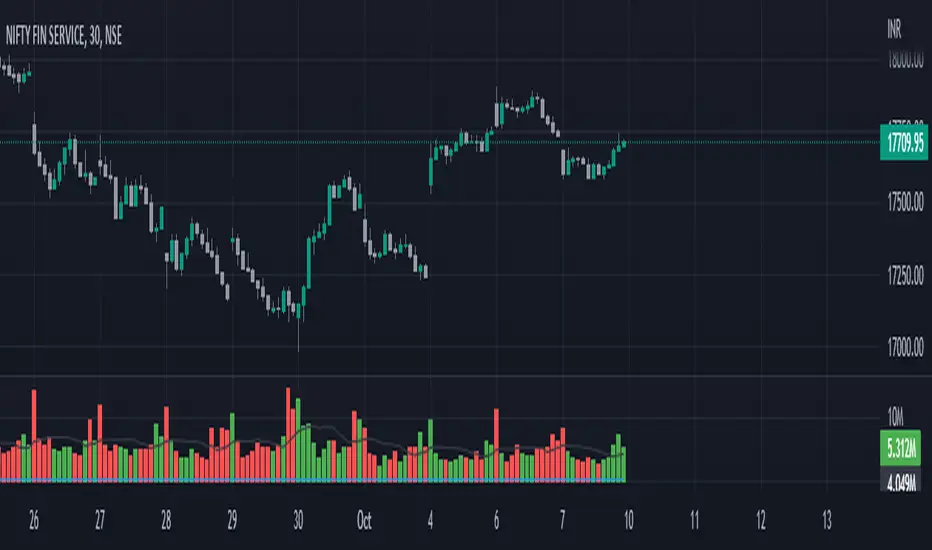
FinNifty VolumesKEY TAKEAWAYS
-Uses FinNifty Index Stocks Volume .
-FinNifty Volume Indicator is created by adding all 20 FinNifty Stocks Volume together.
-FinNifty Volume will be an important indicator in FinNifty Index technical analysis because it is used to measure the relative significance of a market move.
-The higher the volume during a FinNiftyy index price move, the more significant the move and the lower the volume during a FinNifty index price move, the less significant the move.
-Moving Average is also added.
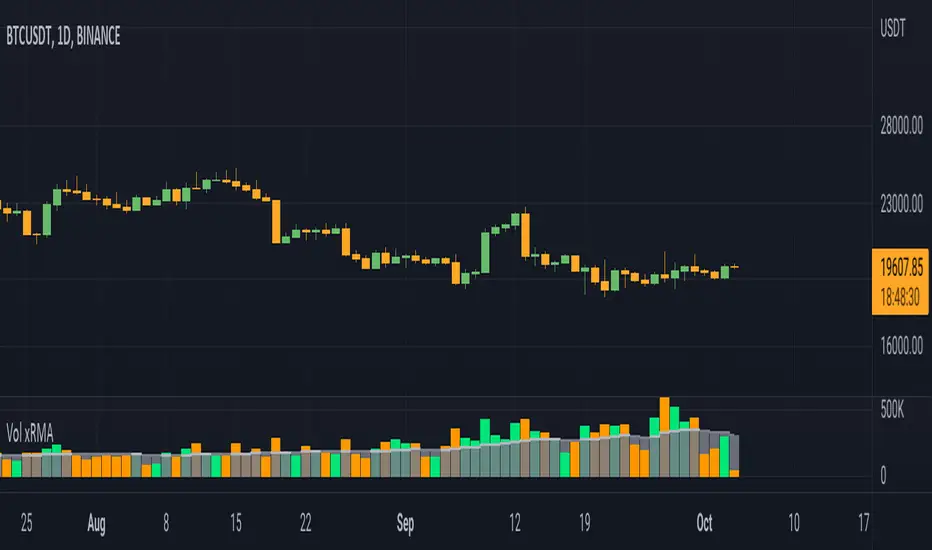
Volume xRMAInspired from Volume xSMA.
Few changes from Volume xSMA
1. MA changed from SMA to RMA (better smoothness and filtering)
2. xRMA plot modified to cloumn and stepline combined (for better visibility)
3. Color pallete changed (personal liking)
Thanks for the support.
Pro Rata Volume (PRV)Pro Rata Volume (PRV): pro rata volume is a volume indicator that extrapolates the volume of the current bar to the time span of the bar of a time-based chart.

Volume Density w/barcolorOpacity limit set to 70 min & barcolor overlay
The transparency of each candle is based on volume density.
Volume density is calculated as follows.
Volume density = Volume / Price range
Price range uses true range "max(high - low, abs(high - close), abs(low - close))".
Since volume density varies drastically by stock or time, the transparency is calculated based on the deviation rate from the average volume density.
Volume Weighted Reversal BandsThis is a vwap & vwma hybrid with upper & lower deviation bands that provide excellent price channels and reversal areas. It can be used on lower & higher timeframes, just increase the deviation % for higher timeframes. Try out the 1 minute timeframe with .5% deviation for great scalping levels.
Here is the calculation used for the main line.
(VWMA100 + VWMA500 + VWMA1000 + VWAP) / 4
So it combines 3 VWMAs with the VWAP and divides that number by 4 to give us a moving average. Then we add new levels above and below that moving average to get our channels. The channels are separated by the % deviation you choose in the settings. For tighter bands, lower the percentage deviation and for wider bands, increase the percentage deviation.
The fattest line in the middle is the main moving average and you can expect price to regularly return to this level. The thick lines are the main moving average plus or minus the percentage deviation you have set. There are 10 levels in each direction from the main moving average. The is also a thin short term moving average as well with a custom calculation. It takes 4 different length moving averages that are weighted and 4 more that are volume weighted and divides the total by 8.The lines will be green when price is above the line and red when price is below the line. The thin white line is the VWAP on its own.
These lines will act as dynamic support and resistance so you can scalp them back and forth. These levels work so well because they are volume weighted and the algos hedge their positions back and forth constantly.
For best results, use this indicator on tickers with the highest volume and trading action as the price will stick to these levels better when the big money players are hedging. Some great tickers for this indicator are APPL, SPY, BTC, ETH.
All colors and linewidths can be customized in the settings easily as well as turning off the VWAP or short moving average and adjusting the percentage deviation for the channels.
***MARKETS***
This indicator can be used on all markets, including stocks, crypto, futures and forex.
***TIMEFRAMES***
This indicator can be used on all timeframes.
***TIPS***
Try using numerous indicators of ours on your chart for extra confirmation. Our favorites to pair with these bands are the Scalper Ribbon and Trend Friend Signals. The 3 combined give you a lot of extra confirmation on whether the market is going to reverse at these levels.

MFI + Realtime DivergencesMoney Flow Index (MFI) + Realtime Divergences + Alerts
This version of the MFI indicator adds the following 5 additional features to the stock MFI:
- Optional divergence lines drawn directly onto the oscillator in realtime.
- Configurable alerts to notify you when divergences occur.
- Configurable lookback periods to fine tune the divergences drawn in order to suit different trading styles and timeframes, including the ability to enable automatic adjustment of pivot period per chart timeframe.
- Background colouring option to indicate when the MFI oscillator has crossed above or below its centerline, or optionally when both the MFI has crossed its centerline and an external oscillator, which can be linked via the settings, has also crossed its centerline.
- Alternate timeframe feature allows you to configure the oscillator to use data from a different timeframe than the chart it is loaded on.
This indicator adds additional features onto the standard MFI , whose core calculations remain unchanged. Namely the configurable option to automatically, quickly and clearly draw divergence lines onto the oscillator for you as they occur in realtime. It also has the addition of unique alerts, so you can be notified when divergences occur without spending all day watching the charts. Furthermore, this version of the TSI comes with configurable lookback periods, which can be configured in order to adjust the sensitivity of the divergences, in order to suit shorter or higher timeframe trading approaches.
What is the Money Flow Index ( MFI )?
Investopedia describes the True Strength Indicator as follows:
“The Money Flow Index ( MFI ) is a technical oscillator that uses price and volume data for identifying overbought or oversold signals in an asset. It can also be used to spot divergences which warn of a trend change in price. The oscillator moves between 0 and 100.
Unlike conventional oscillators such as the Relative Strength Index ( RSI ), the Money Flow Index incorporates both price and volume data, as opposed to just price. For this reason, some analysts call MFI the volume-weighted RSI .”
What are divergences?
Divergence is when the price of an asset is moving in the opposite direction of a technical indicator, such as an oscillator, or is moving contrary to other data. Divergence warns that the current price trend may be weakening, and in some cases may lead to the price changing direction.
There are 4 main types of divergence, which are split into 2 categories;
regular divergences and hidden divergences. Regular divergences indicate possible trend reversals, and hidden divergences indicate possible trend continuation.
Regular bullish divergence: An indication of a potential trend reversal, from the current downtrend, to an uptrend.
Regular bearish divergence: An indication of a potential trend reversal, from the current uptrend, to a downtrend.
Hidden bullish divergence: An indication of a potential uptrend continuation.
Hidden bearish divergence: An indication of a potential downtrend continuation.
Setting alerts.
With this indicator you can set alerts to notify you when any/all of the above types of divergences occur, on any chart timeframe you choose.
Configurable pivot periods.
You can adjust the default pivot periods to suit your prefered trading style and timeframe. If you like to trade a shorter time frame, lowering the default lookback values will make the divergences drawn more sensitive to short term price action.
How do traders use divergences in their trading?
A divergence is considered a leading indicator in technical analysis , meaning it has the ability to indicate a potential price move in the short term future.
Hidden bullish and hidden bearish divergences, which indicate a potential continuation of the current trend are sometimes considered a good place for traders to begin, since trend continuation occurs more frequently than reversals, or trend changes.
When trading regular bullish divergences and regular bearish divergences, which are indications of a trend reversal, the probability of it doing so may increase when these occur at a strong support or resistance level . A common mistake new traders make is to get into a regular divergence trade too early, assuming it will immediately reverse, but these can continue to form for some time before the trend eventually changes, by using forms of support or resistance as an added confluence, such as when price reaches a moving average, the success rate when trading these patterns may increase.
Typically, traders will manually draw lines across the swing highs and swing lows of both the price chart and the oscillator to see whether they appear to present a divergence, this indicator will draw them for you, quickly and clearly, and can notify you when they occur.
Disclaimer: This script includes code from the stock MFI by Tradingview as well as the Divergence for Many Indicators v4 by LonesomeTheBlue.

VWAP Anchored Date with multiplierA modified version from the default VWAP indicator with 2 major enhancements:
1- Start date: instead of being limited to applying the indicator on the entire chart, this script allows you to select the start time to show the VWAP. You can also use this option to show VWAP on an instrument starting from a specific time, all time high for example.
2- Multiplier: You can choose a period multiplier for VWAP, like 2 days, 4 month, 3 years and so on
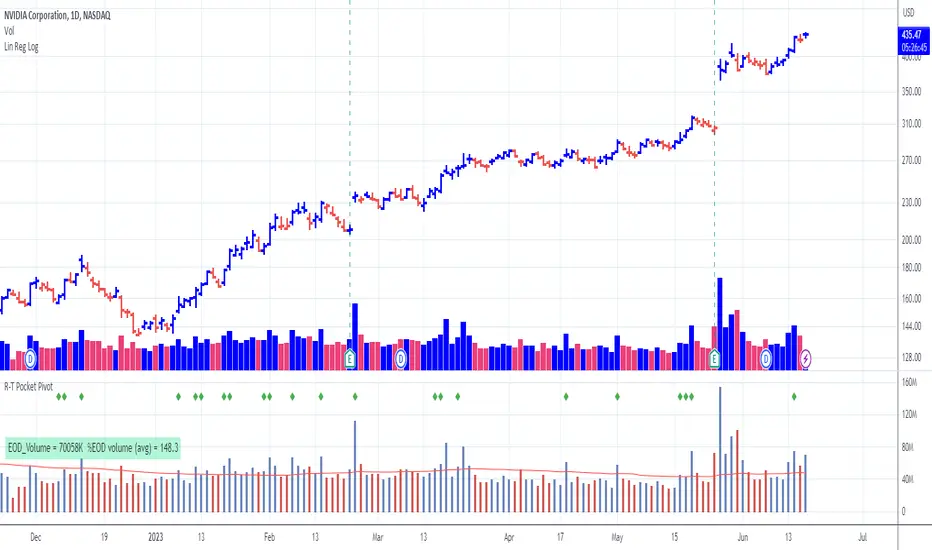
Pocket Pivot with extrapolated Volume and Moving AveragesThe script shows historical pocket pivots, much as other scripts with a green diamond shape on the volume pane.
When the market is open, the current bar, however, is extrapolated to the end of the day using a sixth-order polynomial.
Thus real-time pocket pivots are shown. To work properly, the user must input a time-zone offset parameter; the default is west coast USA.
Time-zone offset is -12 hours to +12 hours compared to the NYSE exchange time zone (USA west coast: -3.)
The volume extrapolation polynomial is based on a historical NASDAQ intraday volume model developed locally by a team.
Only ten-day lookback pocket pivots are computed as defined initially by Dr. Chris Kacher. (The default lookback can be changed by the user.)
Only pocket pivots are shown where the low of the daily bar is within user-defined proximity to the 50-day moving average or 10-day moving average (for continuation pocket pivots.)
Relative Volume IndicatorA simple indicator showing the relation of volume to highest volume for a define number of bars. Helps to differentiate periods of low and high volume.
Define the number of bars to find the highest volume used as a basis.
Apply a simple moving average to smoothen the volume. Set it to 1 to disable smoothing.
Define a threshold differentiating low and high volume.

OMXS30 Volume This indicator summarizes the volume for all stocks in the OMXS30 index. Wait until the candle closes before reading the volume.

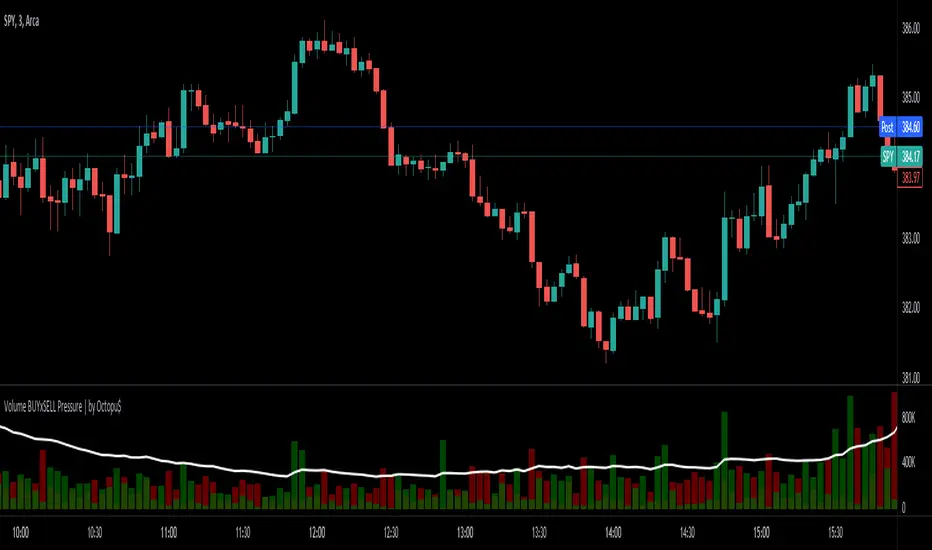
⚖ Volume BUYxSELL Pressure | by Octopu$⚖ Volume BUYxSELL Pressure | by Octopu$
Volume is the number of shares traded in a particular stock, index, or other investment over a specific period of time.
It can indicate market strength, as rising markets on increasing volume are typically viewed as strong and healthy.
In fact, the more, the better. Institutions tend to get more involved in a stock with daily dollar volume in the hundreds of millions or more
But also, when prices fall on increasing volume, the trend is gathering strength to the downside.
That's where BUYxSELL Pressure | by Octopu$ comes in.
Typically, Volume bars follow the candles.
If the Candle is Green (Close > Open), the Volume Bar is also Green.
Now if the Candle is Red (Close < Open) the Volume Bar is also Red.
You never know if it is being Bought or Sold.
This changes the game: along with Price Action, Trend Direction, and other factors. This is possible!
This indicator is composed of:
Volume itself (all of it), displayed by Gray bars;
Identifies Buying Pressure on Green Bars;
And Selling Pressure with Red Bars.
Volume Average as a White Line, for the last "X" Days
Additionally,
It presents a Yellow Triangle as and indication of when the Volume is above the Average in the current TF you are in.
Additionally, this can be set up via an Input: Means if you like to watch it 10% above Average, you got it. 25%? 50%?... You name it.
On top of that,
Includes an indication for Volume Spike as well. So if informs you visually on the Volume Bars of any surges on the TF you are in.
For example: 2x the Volume from the last Candle. Or maybe 3x? 5x... The way you like it the best.
This way, with the combination of your understanding as well as other Indicator and Factor as Confluence, you can improve your analysis and figure out what is going on.
www.tradingview.com
(SPY 5m as an example only)
SPY
Features:
• Total Volume
• Average Volume
• Buying Pressure
• Selling Pressure
• % Above Average
• Volume Spike/Surge (Multiplier)
• Custom Settings
Options:
• Show/Hide Average Line
• Change Length of Average (Days)
• Select/Personalize % of Above Avg
• Add Personalized X Multiplier
• Fully customizable on Style and Colors
• Change shapes and Location
Notes:
v1.0
Indicator release.
Changes and updates can come in the future for additional functionalities or per requests. Follow and Stay Tuned!
Did you like it? Please Support and Shoot me a message! I'd appreciate if you dropped by to say thanks! Thank you.
- Octopu$
🐙
[Kronorium] Volume-Based Regime ChangesColor coded indicator that depicts different types of unusual volume activity.
Arrows along the top will signify bearish or bullish presence. Blue arrows on the bottom indicate a bullish-regime entering, conversely, red arrows along the top will indicate a bearish-regime entering.
Unusual Volume is displayed along the top of the screen as yellow flags. This alert is agnostic-- no particular direction. At this point you must consult moving averages, or other price related indicators to decide a direction.
Volume alerts are calculated against the variable "Volume Lookback" -- volume within this window will be referenced against itself. Whenever volume expands or contracts beyond the windowed-range, alerts will be dispatched accordingly in that direction.

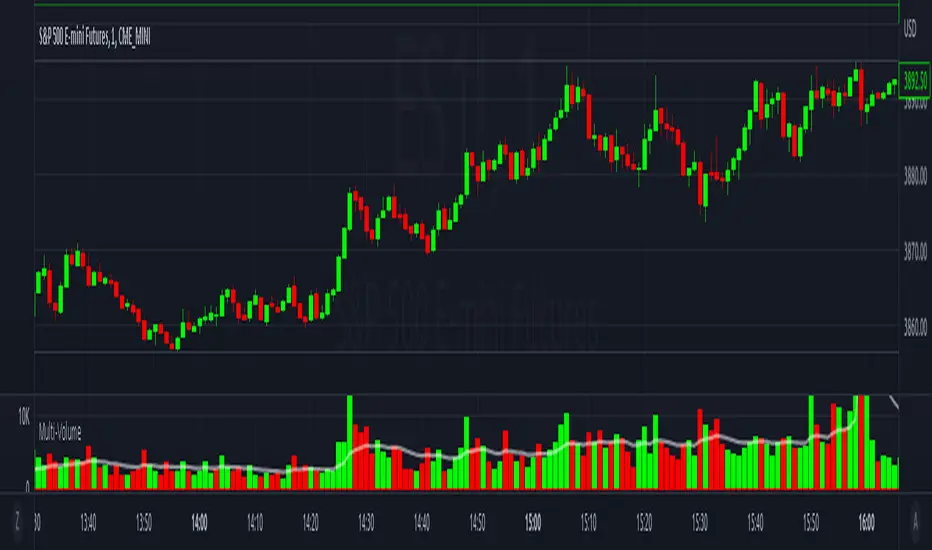
Multi-VolumeThis indicator displays volume in several formats:
Volume Bar Format:
Normal Volume: Shows the normal volume bar colors based on each candle's price direction
Up/Down Volume: Breaks down each volume bar into buying volume (volume added when price goes up) and selling volume (volume added when price goes down)
Volume Pressure: Breaks down each volume bar based on the length of the candle and its "pressure wick". See below for more information.
Flip Down Volume:
The down volume bar will be displayed below the center line.
Show Delta:
When selected with "Up/Down Volume" or "Volume Pressure", a small line will be displayed at the net volume (difference between up and down volume).
Projected Volume:
Instead of current volume, it will show expected volume at end of candle based on volume per second.
Volume Pressure:
On a green candle:
The red part represents the upper wick, the volume as the price comes back down from its high
The green part represents the rest of the candle, the volume as the price goes up from its low to the close
On a red candle:
The green part represents the lower wick, the volume as the price comes back up from its low
The red part represents the rest of the candle, the volume as the price goes down from its high to the close
To Update to Latest Version:
To update to the latest version, just close the indicator and add it again.
Candles - The WhaleThe strategy is based on candle patterns, with confluence indicators. Note some of the candles are rare, they can be found only a specific timeframe, or within specific stocks.
The added patterns are as follows:
- Bullish Engulfing
It is formed by two candles, the second candlestick engulfing the first candlestick. The first candle is a bearish candle that indicates the continuation of the downtrend.
The second candlestick is a long bullish candle that completely engulfs the first candle and shows that the bulls are back in the market.
- Bullish Harami
It consists of two candlestick charts, the first candlestick being a tall bearish candle, and the second, being a small bullish candle which should be in the range of the first candlestick.
The first bearish candle shows the continuation of the bearish trend and the second candle shows that the bulls are back in the market.
- Piercing Line
Two candles from it, the first candle being a bearish candle which indicates the continuation of the downtrend.
The second candle is a bullish candle that opens the gap down but closes more than 50% of the real body of the previous candle, which shows that the bulls are back in the market and a bullish reversal is going to take place.
- Bullish Belt
A Bullish Belt Hold, known as “yorikiri” in Japanese, is a single Japanese candlestick pattern that suggests a possible reversal of the current downtrend.
- Bullish Kicker
A bullish kicker is a two candlestick pattern that’s usually formed after a significant downtrend, but could also appear after an uptrend.
- Abandoned Baby
The abandoned baby candlestick pattern is a three-bar reversal pattern. It is similar to the morning and evening star formations and is a very reliable reversal signal when it occurs after a sharp rise or drop.
- Homing Pigeon
The bullish homing pigeon is a two-candle bullish reversal pattern that occurs at the end of a bearish trend. Both candles are negative, but the second candle is confined within the range of the previous candle.
- Breakaway
Breakaway patterns are multi-candle formations found on Japanese candlestick charts that suggest a market reversal may be in the offing. An actual breakaway is a five candlestick formation that occurs in either an upward or downward trend.
- Concealing Baby Swallow
The Concealing Baby Swallow candlestick pattern is a four-candlestick pattern that can signal a bullish reversal price movement or a bearish continuation move, depending on where it occurs in the overall market structure. However, the pattern is quite rare, and you may not encounter it in your trading.
- Doji Dragonfly
A dragonfly doji can be an indicator of a reversal in price. When the price of a security has shown a downward trend, it might signal an upcoming price increase.
- Doji Gravestone
The Gravestone Doji forms when the price closes at relatively the same level where it opened, providing that the open coincides with the low or at least the two are very close
- Doji Star
Consists of a long bullish candle, followed by a Doji that gaps up, then a third bearish candle that gaps down and closes well within the body of the first candle. An Evening Doji Star is a three-candle bearish reversal pattern similar to the Evening Star.
- Kicker
A kicker pattern is a two-bar candlestick pattern that predicts a change in the direction of an asset's price trend. This pattern is characterized by a sharp reversal in price over the span of two candlesticks. Traders use it to determine which group of market participants is in control of the direction.
- Ladder Bottom
Is a five-candle bullish reversal pattern that occurs at the end of a bullish trend. The four first candles are bearish and followed by a positive candle that starts with a positive gap.
- MatHold
A bullish pattern begins with a large bullish candle followed by a gap higher and three smaller candles which move lower.
- Matching Low
A matching low is a bullish two-candle reversal pattern that forms in an ongoing downtrend. As to its appearance, a matching low consists of two candlesticks that are negative, but the close at or around the same price.
- Meeting Lines
Bullish meeting lines are a two-candle bullish reversal pattern that occurs in a downtrend and signals a reversal of the trend. The first candle of the bullish meeting lines is bearish, and followed by a positive candle that closes very near the close of the previous candle.
- Morning Doji Star
It is made of 3 candlesticks, the first being a bearish candle, the second, a Doji, and the third being a bullish candle.
The first candle shows the continuation of the downtrend. The second candle being a doji indicates indecision in the market. The third bullish candle shows that the bulls are back in the market and a reversal will take place. The second candle should be completely out of the real bodies of the first and third candles.
- Rising Three Method1
Rising three methods is a bullish continuation pattern that appears in an ongoing uptrend. The Rising three methods pattern consists of five candles. where the first and last candles are long and bullish, with three small bearish candles in between.
- Rising Three Method2
It is the same as "Rising Three Method1" but with a different calculation
- Upside Tasuki Gap1
Is a bullish continuation candlestick pattern that forms in an ongoing uptrend. It consists of three candles, where the two first are bullish with a positive gap in-between, and followed by a negative candle that closes in the gap formed between the first two candles.
- Upside Tasuki Gap2
It is the same as "Upside Tasuki Gap1" but with a different calculation
- Three Line Strike1
Is a four-candle bullish continuation candlestick pattern. It forms a bullish trend and is believed to signal the continuation of the bullish trend.
- Three Line Strike2
It is the same as "Three Line Strike2" but with a different calculation
The confluence indicators:
Movement Averages: multi options checks, you can select what to check to open a position, and the description of each open is in the strategy.
Volume Oscillator: positive signal if the volume is above zero.
EMA: positive signal if the candle source is above EMA.
VWAP: positive signal if the candle source is above VWAP.
BTC Trend: it is an equation to track the BTC price movement
The profit is based on TSL, while the stop loss is based on ATR, or lowest candle.
The recommended time frame is 4 hours.

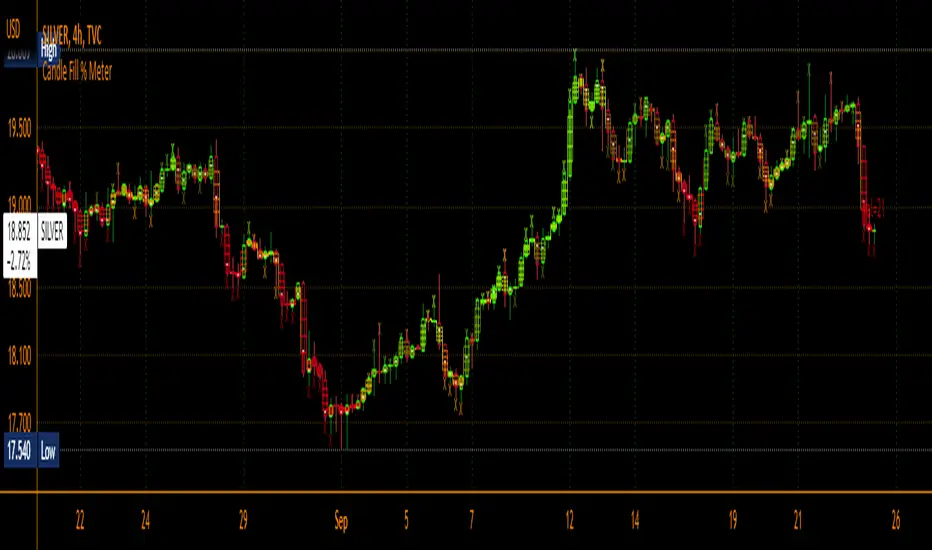
Candle Fill % MeterFor use with Hollow Candles
Fills Candles based on either the value of the RSI or coppock scaled to fit properly between the open and close. Makes for a compact visual with lot's of information given. Toggle bells and whistles in settings such as arrows to indicate the direction of the value being measured, dividing levels, fill from candle open all the time instead of the bottom up and more.
Volume Buy/Sell (by iammaximov)Buy/Sell Volume
Buy/Sell volume based on total bar amplitude (high/low price) and close/open (for calculate vbuy > vsell or vbuy < vsell)
