Icaro [VekiSeba]
Icaro Indicator: Monitoring Price Extensions
Overview
The Icarus Indicator is a tool designed to help traders identify critical points in the price movements of financial assets. Inspired by the Greek myth of Icarus , this indicator alerts on potential exhaustions in bullish movements or significant price extensions. It is ideal for traders looking to optimize profitability and make strategic decisions on when to exit a position, thereby minimizing the risk of dramatic price reversals.
How the Indicator Works: The Icarus Indicator combines various volatility and trend metrics to provide signals:
ATR (Average True Range): Measures the asset’s volatility, providing insight into the intensity of price movements. This component is crucial for understanding the strength behind the asset’s fluctuations.
Gain from Average Trend: This metric calculates how much the current price has deviated from an average trend line. It helps identify how extended or overvalued the price might be in relation to its overall trend.
ATR Acceleration: Assesses how the pace of volatility change compares to its recent average, indicating rapid changes in volatility that might suggest an increase in momentum or an early warning of overextension.
Visual Signals:
Wing Momentum (Purple Cross): Indicates a significant increase in volatility acceleration, suggesting that the price may be entering a phase of unusual momentum. There is also the potential that this signal could lead to a correction.
Solar Roof (Red Circle): Activates when the price reaches an exhaustion level as defined by the user’s threshold, indicating a possible turning point or correction.
NASDAQ:SMCI
Configuration and Use: Users can customize the "Flight Threshold" to adjust the sensitivity of the indicator to their specific trading strategies. Modifying this threshold allows the indicator to be less or more reactive to the asset’s fluctuations.
Originality and Utility of the Indicator: Icarus stands out from other indicators with its unique focus on measuring volatility, offering a dynamic perspective on the asset's conditions. A notable feature of Icarus is its ability to reduce the number of false signals through its specialized formula, which prioritizes accuracy over the frequency of alerts. Although this may mean that the indicator does not react to all price extensions and might occasionally overlook some, it is intentionally designed to provide a higher percentage of correct signals when it does issue an alert. This "lower frequency, higher accuracy" approach is particularly valuable for traders who prefer the quality of signals over quantity, thus minimizing reactions to incorrect market movements and optimizing trading decisions based on highly reliable indicators. However, it is important to note that no indicator, including Icarus, can guarantee 100% effectiveness. Indeed, we cannot quantify the exact success rate of Icarus, as its performance can vary widely depending on the volatility of each asset and the market context at any given time.
Volatilty

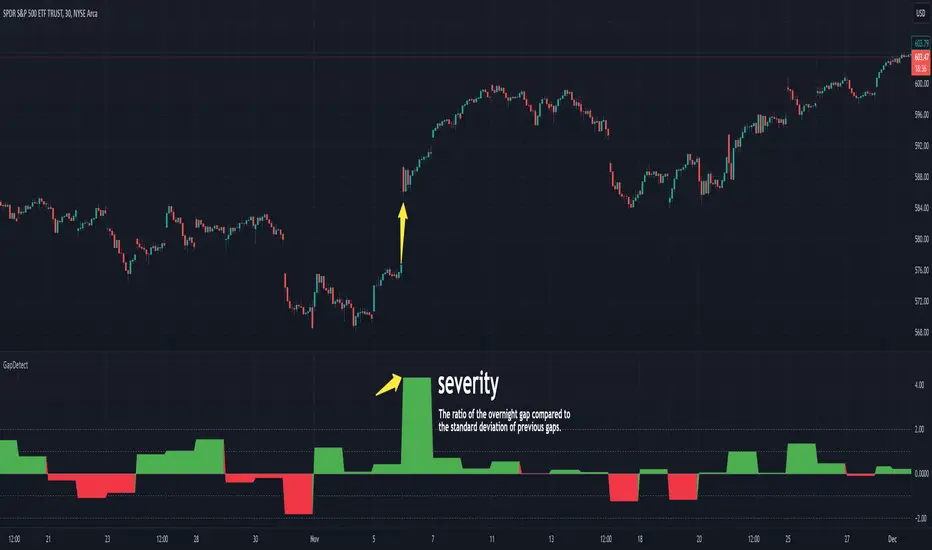
GapDetectGap Severity Analysis Library
This library, GapDetect , simplifies the identification and evaluation of overnight gaps by leveraging statistical metrics such as standard deviation and percentage moves. It is ideal for detecting large abnormal gaps which may be used to modify how strategies may decide to enter or exit.
Key Features:
Overnight Gap Detection
Provides two core functions:
today : Computes the value of today's overnight gap.
todayPercent : Computes the percentage change for today's overnight gap.
Volatility Analysis
Includes functions for statistical gap analysis:
normal : Calculates the normal daily standard deviation of the overnight gap, filtering outliers using customizable thresholds.
normalPercent : Similar to normal , but for percentage-based gap moves.
Gap Severity Metric
severity : a positive or negative value that represents the ratio of the current overnight move compared to the standard deviation of previous ones.
Customizable Parameters
Supports custom session specifications, resolutions, and outlier thresholds.
Beta CoefficientThe Beta indicator is a technical analysis tool designed to calculate and display the beta coefficient of a specific instrument relative to a chosen benchmark. Beta is a measure of the volatility or systematic risk of an asset compared to the overall market (or a specific benchmark). This indicator helps traders and investors understand how much the price of the instrument moves relative to the benchmark, which is useful for assessing market risk exposure.
Input Parameters:
Beta Measurement Period (length1) :
This parameter defines the look back period for calculating beta, which is typically the number of days (or bars) over which the beta coefficient is computed. The longer the period, the more reliable the measurement of beta will be, as it averages out short-term fluctuations. The default value is 200, but this can be adjusted by the user.
Benchmark Instrument :
The default benchmark in this indicator is the Bitcoin (BTC/USD) index, though this can be adjusted to any other market or asset (e.g., S&P 500, Dow Jones) by modifying the symbol in the script.
Interpretation:
A Beta > 1: The instrument is more volatile than the benchmark. If the benchmark increases or decreases, the instrument is likely to experience larger price movements in the same direction.
A Beta < 1: The instrument is less volatile than the benchmark, meaning its price movements will be smaller relative to the benchmark's changes.
A Beta = 1: The instrument moves in close correlation with the benchmark.
Usage:
This indicator is particularly useful for:
Portfolio Risk Management :
By understanding an asset's beta, traders and investors can assess how much exposure they have to the risk associated with the benchmark.
Market Timing :
The beta coefficient can signal the level of market sensitivity of an asset, which is useful for determining when to take more or less aggressive positions.

HMA Gaussian Volatility AdjustedOverview
The "HMA Gaussian Volatility Adjusted" indicator introduces a unique combination of HMA smoothing with a Gaussian filter and two components to measure volatility (Average True Range (ATR) and Standard Deviation (SD)). This tool provides traders with a stable and accurate measure of price trends by integrating a Gaussian Filter smoothed using HMA with a customized calculation of volatility. This innovative approach allows for enhanced sensitivity to market fluctuations while filtering out short-term price noise.
Technical Composition and Calculation
The "HMA Gaussian Volatility Adjusted" indicator incorporates HMA smoothing and dynamic standard deviation calculations to build upon traditional volatility measures.
HMA & Gaussian Smoothing:
HMA Calculation (HMA_Length): The script applies a Hull Moving Average (HMA) to smooth the price data over a user-defined period, reducing noise and helping focus on broader market trends.
Gaussian Filter Calculation (Length_Gaussian): The smoothed HMA data is further refined by putting it into a Gaussian filter to incorporate a normal distribution.
Volatility Measurement:
ATR Calculation (ATR_Length, ATR_Factor): The indicator incorporates the Average True Range (ATR) to measure market volatility. The user-defined ATR multiplier is applied to this value to calculate upper and lower trend bands around the Gaussian, providing a dynamic measure of potential price movement based on recent volatility.
Standard Deviation Calculation (SD_Length): The script calculates the standard deviation of the price over a user-defined length, providing another layer of volatility measurement. The upper and lower standard deviation bands (SDD, SDU) act as additional indicators of price extremes.
Momentum Calculation & Scoring
When the indicator signals SHORT:
Diff = Price - Upper Boundary of the Standard Deviation (calculated on a Gaussian filter).
When the indicator signals LONG:
Diff = Price - Upper Boundary of the ATR (calculated on a Gaussian filter).
The calculated Diff signals how close the indicator is to changing trends. An EMA is applied to the Diff to smooth the data. Positive momentum occurs when the Diff is above the EMA, and negative momentum occurs when the Diff is below the EMA.
Trend Detection
Trend Logic: The indicator uses the calculated bands to identify whether the price is moving within or outside the standard deviation and ATR bands. Crosses above or below these bands, combined with positive/negative momentum, signals potential uptrends or downtrends, offering traders a clear view of market direction.
Features and User Inputs
The "HMA Gaussian Volatility Adjusted" script offers a variety of user inputs to customize the indicator to suit traders' styles and market conditions:
HMA Length: Allows traders to adjust the sensitivity of the HMA smoothing to control the amount of noise filtered from the price data.
Gaussian Length: Users can define the length at which the Gaussian filter is applied.
ATR Length and Multiplier: These inputs let traders fine-tune the ATR calculation, affecting the size of the dynamic upper and lower bands to adjust for price volatility.
Standard Deviation Length: Controls how the standard deviation is calculated, allowing further customization in detecting price volatility.
EMA Confluence: This input lets traders determine the length of the EMA used to calculate price momentum.
Type of Plot Setting: Allows users to determine how the indicator signal is plotted on the chart (Background color, Trend Lines, BOTH (backgroung color and Trend Lines)).
Transparency: Provides users with customization of the background color's transparency.
Color Long/Short: Offers users the option to choose their preferred colors for both long and short signals.
Summary and Usage Tips
The "HMA Gaussian Volatility Adjusted" indicator is a powerful tool for traders looking to refine their analysis of market trends and volatility. Its combination of HMA smoothing, Gaussian filtering, and standard deviation analysis provides a nuanced view of market movements by incorporating various metrics to determine direction, momentum, and volatility. This helps traders make better-informed decisions. It's recommended to experiment with the various input parameters to optimize the indicator for specific needs.

FRAMA Channel [BigBeluga]This is a trend-following indicator that utilizes the Fractal Adaptive Moving Average (FRAMA) to create a dynamic channel around the price. The FRAMA Channel helps identify uptrends, downtrends, and ranging markets by examining the relationship between the price and the channel's boundaries. It also marks trend changes with arrows, optionally displaying either price values or average volume at these key points.
🔵 IDEA
The core idea behind the FRAMA Channel indicator is to use the fractal nature of markets to adapt to different market conditions. By creating a channel around the FRAMA line, it not only tracks price trends but also adapts its sensitivity based on market volatility. When the price crosses the upper or lower bands of the channel, it signals a potential shift in trend direction. If the price remains within the channel and crosses over the upper or lower bands without a breakout, the market is likely in a ranging phase with low momentum. This adaptive approach makes the FRAMA Channel effective in both trending and ranging market environments.
🔵 KEY FEATURES & USAGE
◉ Dynamic FRAMA Channel with Trend Signals:
The FRAMA Channel uses a fractal-based moving average to create an adaptive channel around the price. When the price crosses above the upper band, it signals an uptrend and plots an upward arrow with the price (or average volume) value. Conversely, when the price crosses below the lower band, it signals a downtrend and marks the point with a downward arrow. This dynamic adaptation to market conditions helps traders identify key trend shifts effectively.
◉ Ranging Market Detection:
If the price remains within the channel, and only the high crosses the upper band or the low crosses the lower band, the indicator identifies a ranging market with low momentum. In this case, the channel turns gray, signaling a neutral trend. This is particularly useful for avoiding false signals during periods of market consolidation.
◉ Color-Coded Candles and Channel Bands:
Candles and channel bands are color-coded to reflect the current trend direction. Green indicates an upward trend, blue shows a downward trend, and gray signals a neutral or ranging market. This visual representation makes it easy to identify the market condition at a glance, helping traders make informed decisions quickly.
◉ Customizable Display of Price or Average Volume:
On trend change signals, the indicator allows users to choose whether to display the price at the point of trend change or the average volume of 10 bars. This flexibility enables traders to focus on the information that is most relevant to their strategy, whether it's the exact price entery or the volume context of the market shift. Displaying the average volume allows to see the strength of the trend change.
Price Data:
Average Volume of points:
🔵 CUSTOMIZATION
Length & Bands Distance: Adjust the length for the FRAMA calculation to control the sensitivity of the channel. A shorter length makes the channel more reactive to price changes, while a longer length smooths it out. The Bands Distance setting determines how far the bands are from the FRAMA line, helping to define the breakout and ranging conditions.
Signals Data: Choose between displaying the price or the average volume on trend change arrows. This allows traders to focus on either the exact price level of trend change or the market volume context.
Color Settings: Customize the colors for upward momentum, downward momentum, and neutral states to suit your charting preferences. You can also toggle whether to color the candles based on the momentum for a clearer visual of the trend direction.
The FRAMA Channel indicator adapts to market conditions, providing a versatile tool for identifying trends and ranging markets with clear visual cues.

Same Day Price Volatility [5ema]Indicator visualizes the price volatility of the current day alongside historical volatility patterns of the same weekday across previous weeks. It highlights high, low, and total volatility ranges with interactive boxes, labels, and average lines for easy analysis.
=====
A. How to Calculate?
*Current Day Volatility:
High Volatility: High − Open
Low Volatility: Low − Open
Total Volatility: High − Low
*Historical Volatility:
The script scans historical data for the same weekday over the past number weeks (default: 12 weeks).
It calculates the high, low, and total volatility for each historical same day.
Average Lines:
Averages for high, low, and total volatility are calculated from historical values and plotted as dotted lines.
=====
B. How to Set Up?
Inputs:
Weeks Back (nb): Number of past weeks to include in historical calculations (default: 12).
Position (pos): Horizontal offset for displaying boxes and labels (default: 50).
Colors: Customize box colors for high, low, and total volatility ranges.
=====
C. How to Use?
Analyze Current Day Volatility:
The script displays boxes for today's high, low, and total volatility relative to the opening price.
Labels provide detailed tooltips for easy interpretation.
Compare Historical Patterns:
Historical volatility boxes for the same weekday are plotted for up to number weeks.
Labels display the exact date and volatility values for each historical day.
Utilize Average Volatility Lines:
Use the average lines to compare today's performance against historical averages for high, low, and total volatility.
Customizing Visualization:
Adjust the pos input to reposition the boxes and labels if overlapping with price data.
Modify the colors to suit your preferred visual style.
=====
This indicator is for reference only, you need your own method and strategy.
If you have any questions, please let me know in the comments.

Volatility % (Standard Deviation of Returns)This script takes closing prices of candles to measure the Standard Deviation (σ) which is then used to calculate the volatility by taking the stdev of the last 30 candles and multiplying it by the root of the trading days in a year, month and week. It then multiplies that number by 100 to show a percentage.
Default settings are annual volatility (252 candles, red), monthly volatility (30 candles, blue) and weekly volatility (5 candles, green) if you use daily candles. It is open source so you can increase the number of candles with which the stdev is calculated, and change the number of the root that multiplies the stdev.

Multifactor Buy/Sell Strategy V2 | RSI, MACD, ATR, EMA, Boll.BITGET:1INCHUSDT
This Pine Script code for TradingView is a multifactor Buy/Sell indicator that combines several technical factors to generate trading signals based on trend, volatility, and volume conditions. Here’s a breakdown of the main components and functionality:
Indicator Name
- Multifactor Buy/Sell Strategy V2 — an overlay indicator applied directly on the price chart.
### Input Parameters
The script includes multiple customizable parameters:
- RSI, EMA, MACD parameters — for setting periods and signals of MACD and RSI.
- ATR and Bollinger Bands — used for volatility analysis and level determination.
- Minimum Volatility Threshold — sets a minimum Bollinger Band width threshold for determining high volatility.
Core Indicators
1. RSI — calculated to identify oversold (below 30) and overbought (above 70) conditions.
2. EMA and MACD — calculates exponential moving averages and MACD histogram to determine trend direction.
3. ATR and Bollinger Bands — used to assess current volatility and establish dynamic upper and lower bands.
Volatility and Volume Analysis
- Determines the current ATR level and Bollinger Band width to evaluate high volatility.
- Calculates the volume moving average to track periods of increased volume during high volatility.
Trend Analysis
The script uses the difference between fast and slow EMAs to define strong trends:
- Uptrend — when the fast EMA is above the slow EMA, the price is above the fast EMA, and the trend is strong.
- Downtrend — when the fast EMA is below the slow EMA, the price is below the fast EMA, and the trend is strong.
Momentum Filter
- Based on the price change over the last three bars and compared against the minimum volatility threshold to identify strong momentum.
Buy and Sell Signal Generation
- Buy Signal: Uptrend with RSI oversold, positive MACD histogram, high volatility and volume, strong momentum, and sufficient Bollinger Band width.
- Sell Signal: Downtrend with RSI overbought, negative MACD histogram, high volatility and volume, strong momentum, and sufficient Bollinger Band width.
Visualization
- Buy and sell signals are displayed as green and red triangles on the chart.
- Plots for fast and slow EMAs, upper and lower bands, and Bollinger Bands.
Alerts
The script includes alert conditions for buy and sell signals, allowing notifications to be sent via email or mobile app.
Information Panel
A small table on the chart displays current volatility dataThis Pine Script code for TradingView is a multifactor Buy/Sell indicator that combines several technical factors to generate trading signals based on trend, volatility, and volume conditions. Here’s a breakdown of the main components and functionality:
Indicator Name
- Multifactor Buy/Sell Strategy V2 — an overlay indicator applied directly on the price chart.
Input Parameters
The script includes multiple customizable parameters:
- **RSI, EMA, MACD parameters** — for setting periods and signals of MACD and RSI.
- **ATR and Bollinger Bands** — used for volatility analysis and level determination.
- **Minimum Volatility Threshold** — sets a minimum Bollinger Band width threshold for determining high volatility.
Core Indicators
1. RSI — calculated to identify oversold (below 30) and overbought (above 70) conditions.
2. EMA and MACD — calculates exponential moving averages and MACD histogram to determine trend direction.
3. ATR and Bollinger Bands — used to assess current volatility and establish dynamic upper and lower bands.
Volatility and Volume Analysis
- Determines the current ATR level and Bollinger Band width to evaluate high volatility.
- Calculates the volume moving average to track periods of increased volume during high volatility.
Trend Analysis
The script uses the difference between fast and slow EMAs to define strong trends:
- Uptrend — when the fast EMA is above the slow EMA, the price is above the fast EMA, and the trend is strong.
- Downtrend — when the fast EMA is below the slow EMA, the price is below the fast EMA, and the trend is strong.
Momentum Filter
- Based on the price change over the last three bars and compared against the minimum volatility threshold to identify strong momentum.
Buy and Sell Signal Generation
- Buy Signal: Uptrend with RSI oversold, positive MACD histogram, high volatility and volume, strong momentum, and sufficient Bollinger Band width.
- Sell Signal: Downtrend with RSI overbought, negative MACD histogram, high volatility and volume, strong momentum, and sufficient Bollinger Band width.
Visualization
- Buy and sell signals are displayed as green and red triangles on the chart.
- Plots for fast and slow EMAs, upper and lower bands, and Bollinger Bands.
Alerts
The script includes alert conditions for buy and sell signals, allowing notifications to be sent via email or mobile app.
Information Panel
A small table on the chart displays current volatility
- Volatility Status — indicates high or low volatility.
- Bollinger Band Width — current width as a percentage.
- ATR Ratio — ratio of current ATR to long-term average ATR.
This script is suitable for trading in high-volatility conditions, combining multiple filters and factors to generate precise buy and sell signals.

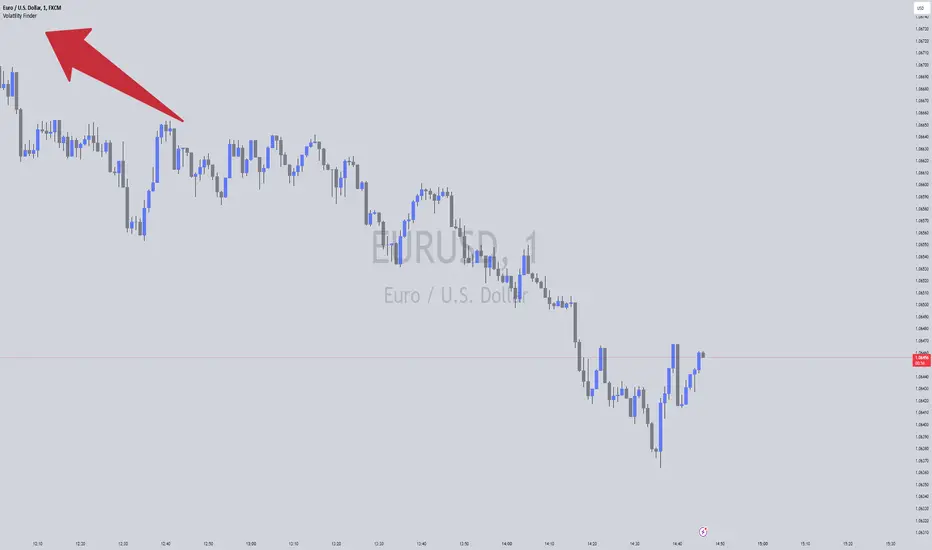
Volatility FinderVolatility Finder / Daily Range.
This indicator will measure the Average amount of Pips/Points movement of price, over an X amount of time.
This is often referred to as "Forex Volatility" Most pairs have different amounts of volatility. Exotics pairs are considered very volatile, Forex Majors is less volatile.
So this Indicator, will measure the amount of ADR/Average Daily Range.
Average amount of Pips/Points of movement, within a specific period of time, and tell you that.
- In the settings, you can choose how many days you want the indicator to measure from, and it will tell you the average amount of pips, based on the average movement on those days.
The Default setting is set to 90 days/3 months.
IMPORTANT:
To see the number the indicator tells you, you have to RIGHT-click up in the Left-side corner, where you see the Pair you have open on your Chart. And make sure to Enable "INDICATOR VALUES". Then if you However over the Indicator area, where the indicators you have open. You will see the number that the indicator has found. Based on the Settings you have set in the Settings Menu.
* One applicable way to use this information is if you are inside a trade, and price has moved past the Daily Range. It could be less probable it will continue in the same direction when it has Met the Daily Range.
* Another is to use this, to find pairs that you might want to trade. If the Average Price movement over the time you input, is High, you can use this information to help you decide if this pair is to Volatile for you to consider trading, or if it moving to slow for you.
It's very accurate, if you want to compare, you can go to 3rd party websites like
Mataf / mataf.net/en/forex/tools/volatility
Investing.com / investing.com/tools/forex-volatility-calculator
VolbandsThe Volbands indicator dynamically plots upper and lower volatility bands based on implied daily moves derived from volatility indices. This tool provides a visual forecast of the next trading day's price range, helping traders anticipate potential price movement boundaries.
Key Features:
1. Auto-Detect Volatility Index: Volbands automatically detects the appropriate volatility index based on the current symbol. For example, it uses the VIX for S&P 500, VXN for Nasdaq 100, and custom indexes like VXAPL for Apple. Users can also manually select a specific volatility index if preferred.
2. Projected Bands:
- The indicator plots the projected upper and lower bands for the next trading day using the implied move from the volatility index.
- Displays today’s projected bands as a reference and overlays next day’s bands with a slight offset, visually indicating the anticipated range.
3. Dynamic Updates: The indicator updates automatically as new bars are added, ensuring that users have up-to-date projections based on the latest volatility data.
4. Highlighting Extreme Price Action: Candles that close outside of the projected bands are colored in yellow, highlighting moments of higher-than-expected volatility.
5. Informative Table: A customizable table displays relevant information, including:
- The selected or auto-detected volatility index
- Implied daily move percentage
- Projected upper and lower levels
Potential Applications:
- Risk Management: The Volbands indicator can help traders set more informed stop-loss and take-profit levels based on volatility-driven price projections.
- Identifying Overbought/Oversold Conditions: Price movement outside the projected bands may indicate overbought or oversold conditions, potentially signaling trade opportunities.
-Enhancing Entry and Exit Points: The projected bands act as soft support and resistance levels, assisting traders in timing entries and exits in anticipation of volatility-driven price reactions.
Future Enhancements:
Potential improvements to expand functionality could include:
- Additional Volatility Indices: Expanding coverage to include more assets and volatility indices.
- Alerts: Setting alerts for when prices breach the projected bands, enabling traders to react quickly to unexpected price movements.
- Customization of Bands: Adding options for users to adjust the implied move percentage, creating customized bands that reflect individual trading strategies.
This indicator combines implied volatility with price action, offering valuable insights to traders on expected price ranges and volatility.

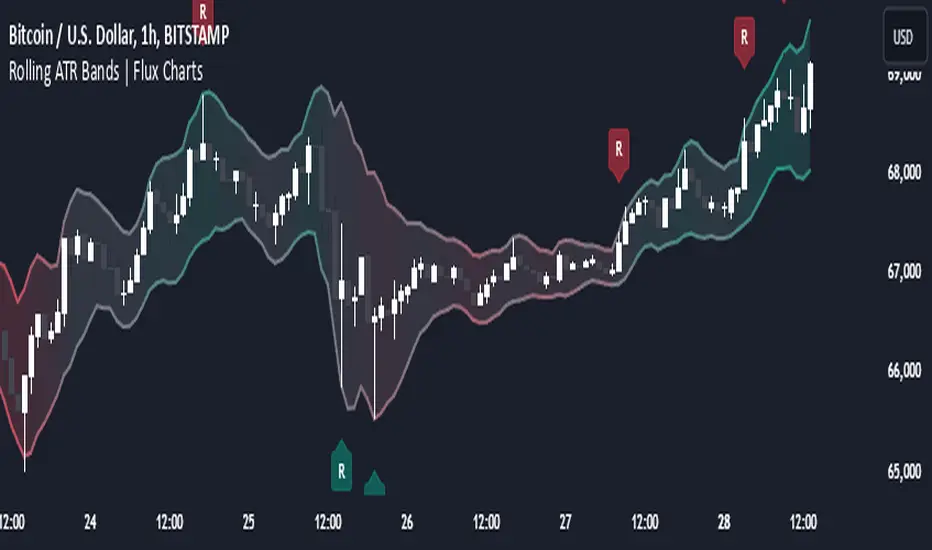
Rolling ATR Bands | Flux Charts💎 GENERAL OVERVIEW
Introducing the Rolling ATR Bands indicator! This indicator overlays adaptive bands around the price, using the Average True Range (ATR) to define dynamic support and resistance levels. The Rolling ATR Bands are color-coded to visually indicate potential trend strength, shifting between bearish, neutral, and bullish colors. This tool can help traders interpret price volatility, as well as identify probable trend changes, continuations, or reversals. For more information about the process, check the "HOW DOES IT WORK ?" section.
Features of the new Rolling ATR Bands:
ATR Bands With Customizable ATR Length & Multiplier
Smooth Trend Strength With Adjustable Smoothing Options
Color-coded bands Representing Bearish, Neutral, or Bullish Trends
Alerts for Retests & Breaks
Customizable Visuals
📌 HOW DOES IT WORK?
The Rolling ATR Bands indicator calculates the ATR based on the specified length and multiplier to form upper and lower bands around the price. These bands adapt with market volatility, widening during high volatility and contracting during lower volatility periods.
In addition, the indicator calculates a "trend strength" score by combining an interpolated RSI, Supertrend, and EMA crossover. This score is smoothed with a customizable length, and a color gradient is applied to visually denote the strength of bearish, neutral, or bullish conditions.
Here's how to interpret the bands:
Upper Band: Acts as dynamic resistance; when price approaches or touches it, this often suggests potential overbought conditions.
Lower Band: Acts as dynamic support; touching or nearing this band might indicate potential oversold conditions.
Color Shifts: Color changes indicate shifts in trend direction. For example, a green color suggests a bullish trend, while red hints at bearish tendencies.
🚩 UNIQUENESS
What sets the Rolling ATR Bands apart is the combined use of interpolated RSI, Supertrend, and EMA cross values, creating a weighted trend strength score. This integration allows for nuanced, color-coded visual cues that respond quickly to trend changes without excessive noise, offering traders an intuitive view of both trend direction and potential momentum. You can also set up alerts for retest & alerts for upper and lower bands to get informed of potential movements.
⚙️ SETTINGS
1. General Configuration
ATR Length : Controls the ATR calculation length for the bands.
Smoothing: Adjusts the trend strength smoothing to control sensitivity to trend changes.
ATR Multiplier : Sets the width of the bands by multiplying the ATR value.
Trend Smoothing : Higher settings will result in longer periods of time required for trend to change direction from bullish to bearish and vice versa.
Relative Measured Volatility (RMV) – Spot Tight Entry ZonesTitle: Relative Measured Volatility (RMV) – Spot Tight Entry Zones
Introduction
The Relative Measured Volatility (RMV) indicator is designed to highlight tight price consolidation zones , making it an ideal tool for traders seeking optimal entry points before potential breakouts. By focusing on tightness rather than general volatility, RMV offers traders a practical way to detect consolidation phases that often precede significant market moves.
How RMV Works
The RMV calculates short-term tightness by averaging three ATR (Average True Range) values over different lookback periods and then normalizing them within a specified lookback window. The result is a percentage-based scale from 0 to 100, indicating how tight the current price range is compared to recent history.
Here’s the breakdown:
Three ATR values are computed using user-defined short lookback periods to represent short-term price movements. An average of the ATRs provides a smoothed measure of current tightness. The RMV normalizes this average against the highest and lowest values over the defined lookback period, scaling it from 0 to 100.
This approach helps traders identify consolidation zones that are more likely to lead to breakouts.
Key Features of RMV
Multi-Period ATR Calculation : Uses three ATR values to effectively capture market tightness over the short term. Normalization : Converts the tightness measure to a 0-100 scale for easy interpretation. Dynamic Histogram and Background Colors : The RMV indicator uses a color-coded system for clarity.
How to Use the RMV Indicator
Identify Tight Consolidation Zones:
a - RMV values between 0-10 indicate very tight price ranges, making this the most optimal zone for potential entries before breakouts.
b - RMV values between 11-20 suggest moderate tightness, still favorable for entries.
Monitor Potential Breakout Areas:
As RMV moves from 21-30 , tightness reduces, signaling expanding volatility that may require wider stops or more flexible entry strategies.
Adjust Trading Strategies:
Use RMV values to identify tight zones for entering trades, especially in trending markets or at key support/resistance levels.
Customize the Indicator:
a - Adjust the short-term ATR lookback periods to control sensitivity.
b - Modify the lookback period to match your trading horizon, whether short-term or long-term.
Color-Coding Guide for RMV
ibb.co
How to Add RMV to Your Chart
Open your chart on TradingView.
Go to the “Indicators” section.
Search for "Relative Measured Volatility (RMV)" in the Community Scripts section.
Click on the indicator to add it to your chart.
Customize the input parameters to fit your trading strategy.
Input Parameters
Lookback Period : Defines the period over which tightness is measured and normalized.
Short-term ATR Lookbacks (1, 2, 3) : Control sensitivity to short-term tightness.
Histogram Threshold : Sets the threshold for differentiating between bright (tight) and dim (less tight) histogram colors.
Conclusion
The Relative Measured Volatility (RMV) is a versatile tool designed to help traders identify tight entry zones by focusing on market consolidation. By highlighting narrow price ranges, the RMV guides traders toward potential breakout setups while providing clear visual cues for better decision-making. Add RMV to your trading toolkit today and enhance your ability to identify optimal entry points!

Supertrend StrategyThe Supertrend Strategy was created based on the Supertrend and Relative Strength Index (RSI) indicators, widely respected tools in technical analysis. This strategy combines these two indicators to capture market trends with precision and reliability, looking for optimizing exit levels at oversold or overbought price levels.
The Supertrend indicator identifies trend direction based on price and volatility by using the Average True Range (ATR). The ATR measures market volatility by calculating the average range between an asset’s high and low prices over a set period. It provides insight into price fluctuations, with higher ATR values indicating increased volatility and lower values suggesting stability. The Supertrend Indicator plots a line above or below the price, signaling potential buy or sell opportunities: when the price closes above the Supertrend line, an uptrend is indicated, while a close below the line suggests a downtrend. This line shifts as price movements and volatility levels change, acting as both a trailing stop loss and trend confirmation.
To enhance the Supertrend strategy, the Relative Strength Index (RSI) has been added as an exit criterion. As a momentum oscillator, the RSI indicates overbought (usually above 70) or oversold (usually below 30) conditions. This integration allows trades to close when the asset is overbought or oversold, capturing gains before a possible reversal, even if the percentage take profit level has not been reached. This mechanism aims to prevent losses due to market reversals before the Supertrend signal changes.
### Key Features
1. **Entry criteria**:
- The strategy uses the Supertrend indicator calculated by adding or subtracting a multiple of the ATR from the closing price, depending on the trend direction.
- When the price crosses above the Supertrend line, the strategy signals a long (buy) entry. Conversely, when the price crosses below, it signals a short (sell) entry.
- The strategy performs a reversal if there is an open position and a change in the direction of the supertrend occurs
2. **Exit criteria**:
- Take profit of 30% (default) on the average position price.
- Oversold (≤ 5) or overbought (≥ 95) RSI
- Reversal when there is a change in direction of the Supertrend
3. **No Repainting**:
- This strategy is not subject to repainting, as long as the timeframe configured on your chart is the same as the supertrend timeframe .
4. **Position Sizing by Equity and risk management**:
- This strategy has a default configuration to operate with 35% of the equity. At the time of opening the position, the supertrend line is typically positioned at about 12 to 16% of the entry price. This way, the strategy is putting at risk about 16% of 35% of equity, that is, around 5.6% of equity for each trade. The percentage of equity can be adjusted by the user according to their risk management.
5. **Backtest results**:
- This strategy was subjected to deep backtesting and operations in replay mode, including transaction fees of 0.12%, and slippage of 5 ticks.
- The past results in deep backtest and replay mode were compatible and profitable (Variable results depending on the take profit used, supertrend and RSI parameters). However, it should be noted that few operations were evaluated, since the currency in question has been created for a short time and the frequency of operations is relatively small.
- Past results are no guarantee of future results. The strategy's backtest results may even be due to overfitting with past data.
Default Settings
Chart timeframe: 2h
Supertrend Factor: 3.42
ATR period: 14
Supertrend timeframe: 2 h
RSI timeframe: 15 min
RSI Lenght: 5 min
RSI Upper limit: 95
RSI Lower Limit: 5
Take Profit: 30%
BYBIT:1000000MOGUSDT.P

Relative VolatilityRelative Volatility is a technical indicator designed to assess changes in market volatility by comparing fast and slow Average True Range (ATR) values. It operates by subtracting a slower ATR (e.g., 50-period ATR) from a faster ATR (e.g., 20-period ATR) and visualizing the result as a histogram. This enables traders to determine whether volatility is increasing or decreasing over time.
This indicator can help traders recognize volatility trends, which can inform decisions related to trade entries, exits, and risk management.
Interpreting Volatility Changes
Increasing Volatility: When the histogram is above zero, it indicates that the fast ATR is greater than the slow ATR, signifying an increase in short-term volatility compared to the long-term average. This may suggest heightened market activity and potential trading opportunities.
Decreasing Volatility: When the histogram is below zero, it shows that the fast ATR is less than the slow ATR, indicating a decrease in short-term volatility relative to the long-term average. This may suggest consolidating markets or reduced trading activity.
Relative Volatility assists traders in monitoring and analyzing changes in market volatility, providing insights that can enhance trading strategies and decision-making processes.

Alternative Shark Harmonic Pattern [TradingFinder] ALT Shark🔵 Introduction
The Alternative Shark harmonic pattern, similar to the original Shark harmonic pattern introduced by Scott Carney, is a powerful tool in technical analysis used to identify potential reversal zones (PRZ) in financial markets.
These harmonic patterns help traders spot key turning points in market trends by relying on specific Fibonacci ratios. The Alternative Shark pattern is particularly unique due to its distinct Fibonacci retracements within the PRZ, which differentiate it from the standard Shark pattern and provide traders with more precise entry and exit signals.
By focusing on harmonic patterns and utilizing tools like the Harmonic Pattern Indicator, traders can easily identify both the Shark and Alternative Shark patterns, making it easier to find PRZs and capture potential trend reversals. This enhanced detection of potential reversal zones allows for better trade optimization and improved risk management.
Incorporating the Alternative Shark pattern into your technical analysis strategy enables you to enhance your trading performance by identifying market reversals with greater accuracy, improving the timing of your trades, and reducing risks associated with sudden market shifts.
🟣 Understanding the Types of Alternative Shark Pattern
The Alternative Shark harmonic pattern, much like the original Shark pattern, forms at the end of price trends and is divided into two types: Bullish and Bearish Alternative Shark patterns.
Bullish Alternative Shark Pattern :
This pattern typically forms at the end of a downtrend, signaling a potential reversal into an uptrend. Traders can use this pattern to identify buy entry points. The image below illustrates the core components of the Bullish Alternative Shark Pattern.
Bearish Alternative Shark Pattern :
Conversely, the Bearish Alternative Shark Pattern appears at the end of an uptrend and signals a potential reversal to a downtrend. This variation allows traders to adjust their strategies for selling. The image below outlines the characteristics of the Bearish Alternative Shark Pattern.
🟣 Differences Between Shark and Alternative Shark Patterns
Although both patterns share similar structures and serve as tools for identifying price reversals, there is one key difference between them :
AB to XA Ratio : In the Shark pattern, the AB leg retraces between 1 and 2 of the XA leg, whereas in the Alternative Shark pattern, this retracement is reduced to 0.382 to 0.618 of the XA leg. This difference in the retracement ratio leads to slightly different trade signals and can affect the timing of entry and exit points.
Other ratios and reversal signals remain consistent between the two patterns, but this difference in the AB to XA ratio provides traders with more nuanced opportunities to optimize their trades.
🔵 How to Use
🟣 Trading with the Bullish Alternative Shark Pattern
The Bullish Alternative Shark Pattern functions similarly to the traditional Bullish Shark, acting as a reversal pattern that helps traders recognize the end of a downtrend and the beginning of an uptrend.
The main distinction lies in the reduced AB retracement, which can offer more refined entry signals. Once the pattern completes, traders can look to enter buy trades and place a stop-loss below the lowest point of the pattern for effective risk management.
🟣 Trading with the Bearish Alternative Shark Pattern
The Bearish Alternative Shark Pattern operates much like the Bearish Shark pattern but with the adjusted AB to XA ratio. This difference provides traders with unique entry points for sell trades. Once the pattern is fully identified, traders can enter short positions, placing a stop-loss above the highest point of the pattern to safeguard against market fluctuations.
🔵 Setting
🟣 Logical Setting
ZigZag Pivot Period : You can adjust the period so that the harmonic patterns are adjusted according to the pivot period you want. This factor is the most important parameter in pattern recognition.
Show Valid Forma t: If this parameter is on "On" mode, only patterns will be displayed that they have exact format and no noise can be seen in them. If "Off" is, the patterns displayed that maybe are noisy and do not exactly correspond to the original pattern.
Show Formation Last Pivot Confirm : if Turned on, you can see this ability of patterns when their last pivot is formed. If this feature is off, it will see the patterns as soon as they are formed. The advantage of this option being clear is less formation of fielded patterns, and it is accompanied by the latest pattern seeing and a sharp reduction in reward to risk.
Period of Formation Last Pivot : Using this parameter you can determine that the last pivot is based on Pivot period.
🟣 Genaral Setting
Show : Enter "On" to display the template and "Off" to not display the template.
Color : Enter the desired color to draw the pattern in this parameter.
LineWidth : You can enter the number 1 or numbers higher than one to adjust the thickness of the drawing lines. This number must be an integer and increases with increasing thickness.
LabelSize : You can adjust the size of the labels by using the "size.auto", "size.tiny", "size.smal", "size.normal", "size.large" or "size.huge" entries.
🟣 Alert Setting
Alert : On / Off
Message Frequency : This string parameter defines the announcement frequency. Choices include: "All" (activates the alert every time the function is called), "Once Per Bar" (activates the alert only on the first call within the bar), and "Once Per Bar Close" (the alert is activated only by a call at the last script execution of the real-time bar upon closing). The default setting is "Once per Bar".
Show Alert Time by Time Zone : The date, hour, and minute you receive in alert messages can be based on any time zone you choose. For example, if you want New York time, you should enter "UTC-4". This input is set to the time zone "UTC" by default.
🔵 Conclusion
The Alternative Shark harmonic pattern, despite its structural similarity to the traditional Shark pattern, introduces a key difference in the AB to XA ratio, making it a valuable addition to the trader’s toolkit. This subtle variation enables traders to pinpoint reversal points with greater accuracy and fine-tune their trading strategies.
As with any technical pattern, it is crucial to use the Alternative Shark pattern in combination with other technical indicators and strong risk management practices. Incorporating this pattern into a broader trading strategy can help traders enhance their ability to detect and capitalize on market reversals more effectively.

ATR Range Pivot LinesDescription:
This Pine Script calculates and plots pivot lines based on ATR (Average True Range) value and closing price. It uses the previous trading day's ATR value to set static pivot levels for the current trading day. These pivot lines help traders identify potential support and resistance levels based on historical volatility. The script includes two main pivot lines—ATR High and ATR Low —and two midpoint lines between them for additional context. Labels are added to show the exact pivot values, with options to customize label positions.
Intended Use:
The script is designed to help traders forecast potential price ranges for the current trading day based on the previous day’s volatility. By adding and subtracting the previous day's ATR from the prior close, the script identifies key levels where price action may encounter support or resistance. It is useful for setting realistic price targets or entry/exit points. Since the ATR-based pivot lines are static for the entire day, they provide a reliable range for intraday trading strategies.
Disclosure:
This script was generated using AI. It is recommended to review and test the script thoroughly before applying it in live trading scenarios.

The Bar Counter Trend Reversal Strategy [TradeDots]Overview
The Bar Counter Trend Reversal Strategy is designed to identify potential counter-trend reversal points in the market after a series of consecutive rising or falling bars.
By analyzing price movements in conjunction with optional volume confirmation and channel bands (Bollinger Bands or Keltner Channels), this strategy aims to detect overbought or oversold conditions where a trend reversal may occur.
🔹How it Works
Consecutive Price Movements
Rising Bars: The strategy detects when there are a specified number of consecutive rising bars (No. of Rises).
Falling Bars: Similarly, it identifies a specified number of consecutive falling bars (No. of Falls).
Volume Confirmation (Optional)
When enabled, the strategy checks for increasing volume during the consecutive price movements, adding an extra layer of confirmation to the potential reversal signal.
Channel Confirmation (Optional)
Channel Type: Choose between Bollinger Bands ("BB") or Keltner Channels ("KC").
Channel Interaction: The strategy checks if the price interacts with the upper or lower channel lines: For short signals, it looks for price moving above the upper channel line. For long signals, it looks for price moving below the lower channel line.
Customization:
No. of Rises/Falls: Set the number of consecutive bars required to trigger a signal.
Volume Confirmation: Enable or disable volume as a confirmation factor.
Channel Confirmation: Enable or disable channel bands as a confirmation factor.
Channel Settings: Adjust the length and multiplier for the Bollinger Bands or Keltner Channels.
Visual Indicators:
Entry Signals: Triangles plotted on the chart indicate potential entry points:
Green upward triangle for long entries.
Red downward triangle for short entries.
Channel Bands: The upper and lower bands are plotted for visual reference.
Strategy Parameters:
Initial Capital: $10,000.
Position Sizing: 80% of equity per trade.
Commission: 0.01% per trade to simulate realistic trading costs.
🔹Usage
Set up the number of Rises/Falls and choose whether if you want to use channel indicators and volume as the confirmation.
Monitor the chart for triangles indicating potential entry points.
Consider the context of the overall market trend and other technical factors.
Backtesting and Optimization:
Use TradingView's Strategy Tester to evaluate performance.
Adjust parameters to optimize results for different market conditions.
🔹 Considerations and Recommendations
Risk Management:
The strategy does not include built-in stop-loss or take-profit levels. It's recommended to implement your own risk management techniques.
Market Conditions:
Performance may vary in different market environments. Testing and adjustments are advised when applying the strategy to new instruments or timeframes.
No Guarantee of Future Results:
Past performance is not indicative of future results. Always perform due diligence and consider the risks involved in trading.

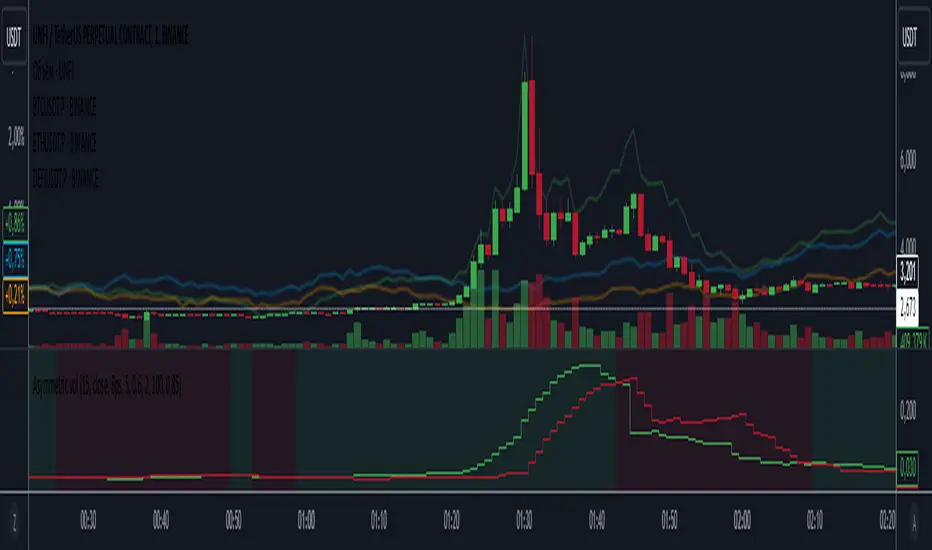
Asymmetric volatilityThe "Asymmetric Volatility" indicator is designed to visualize the differences in volatility between upward and downward price movements of a selected instrument. It operates on the principle of analyzing price movements over a specified time period, with particular focus on the symmetrical evaluation of both price rises and falls.
User Parameters:
- Length: This parameter specifies the number of bars (candles) used to calculate the average volatility. The larger the value, the longer the time period, and the smoother the volatility data will be.
- Source: This represents the input data for the indicator calculations. By default, the close value of each bar is used, but the user can choose another data source (such as open, high, low, or any custom value).
Operational Algorithm:
1. Movement Calculation:
- UpMoves: Computed as the positive difference between the current bar value and the previous bar value, if it is greater than zero.
- DownMoves: Computed as the positive difference between the previous bar value and the current bar value, if it is greater than zero.
2. Volatility Calculation:
- UpVolatility: This is the arithmetic mean of the UpMoves values over the specified period.
- DownVolatility: This is the arithmetic mean of the DownMoves values over the specified period.
3. Graphical Representation:
- The indicator displays two plots: upward and downward volatility, represented by green and red lines, respectively.
- The background color changes based on which volatility is dominant: a green background indicates that upward volatility prevails, while a red background indicates downward volatility.
The indicator allows traders to quickly assess in which direction the market is more volatile at the moment, which can be useful for making trading decisions and evaluating the current market situation.
ATR Bands with ATR Cross + InfoTableOverview
This Pine Script™ indicator is designed to enhance traders' ability to analyze market volatility, trend direction, and position sizing directly on their TradingView charts. By plotting Average True Range (ATR) bands anchored at the OHLC4 price, displaying crossover labels, and providing a comprehensive information table, this tool offers a multifaceted approach to technical analysis.
Key Features:
ATR Bands Anchored at OHLC4: Visual representation of short-term and long-term volatility bands centered around the average price.
OHLC4 Dotted Line: A dotted line representing the average of Open, High, Low, and Close prices.
ATR Cross Labels: Visual cues indicating when short-term volatility exceeds long-term volatility and vice versa.
Information Table: Displays real-time data on market volatility, calculated position size based on risk parameters, and trend direction relative to the 20-period Smoothed Moving Average (SMMA).
Purpose
The primary purpose of this indicator is to:
Assess Market Volatility: By comparing short-term and long-term ATR values, traders can gauge the current volatility environment.
Determine Optimal Position Sizing: A calculated position size based on user-defined risk parameters helps in effective risk management.
Identify Trend Direction: Comparing the current price to the 20-period SMMA assists in determining the prevailing market trend.
Enhance Decision-Making: Visual cues and real-time data enable traders to make informed trading decisions with greater confidence.
How It Works
1. ATR Bands Anchored at OHLC4
Average True Range (ATR) Calculations
Short-Term ATR (SA): Calculated over a 9-period using ta.atr(9).
Long-Term ATR (LA): Calculated over a 21-period using ta.atr(21).
Plotting the Bands
OHLC4 Dotted Line: Plotted using small circles to simulate a dotted line due to Pine Script limitations.
ATR(9) Bands: Plotted in blue with semi-transparent shading.
ATR(21) Bands: Plotted in orange with semi-transparent shading.
Overlap: Bands can overlap, providing visual insights into changes in volatility.
2. ATR Cross Labels
Crossover Detection:
SA > LA: Indicates increasing short-term volatility.
Detected using ta.crossover(SA, LA).
A green upward label "SA>LA" is plotted below the bar.
SA < LA: Indicates decreasing short-term volatility.
Detected using ta.crossunder(SA, LA).
A red downward label "SA LA, then the market is considered volatile.
Display: Shows "Yes" or "No" based on the comparison.
b. Position Size Calculation
Risk Total Amount: User-defined input representing the total capital at risk.
Risk per 1 Stock: User-defined input representing the risk associated with one unit of the asset.
Purpose: Helps traders determine the appropriate position size based on their risk tolerance and current market volatility.
c. Is Price > 20 SMMA?
SMMA Calculation:
Calculated using a 20-period Smoothed Moving Average with ta.rma(close, 20).
Logic: If the current close price is above the SMMA, the trend is considered upward.
Display: Shows "Yes" or "No" based on the comparison.
How to Use
Step 1: Add the Indicator to Your Chart
Copy the Script: Copy the entire Pine Script code into the TradingView Pine Editor.
Save and Apply: Save the script and click "Add to Chart."
Step 2: Configure Inputs
Risk Parameters: Adjust the "Risk Total Amount" and "Risk per 1 Stock" in the indicator settings to match your personal risk management strategy.
Step 3: Interpret the Visuals
ATR Bands
Width of Bands: Wider bands indicate higher volatility; narrower bands indicate lower volatility.
Band Overlap: Pay attention to areas where the blue and orange bands diverge or converge.
OHLC4 Dotted Line
Serves as a central reference point for the ATR bands.
Helps visualize the average price around which volatility is measured.
ATR Cross Labels
"SA>LA" Label:
Indicates short-term volatility is increasing relative to long-term volatility.
May signal potential breakout or trend acceleration.
"SA 20 SMMA?
Use this to confirm trend direction before entering or exiting trades.
Practical Example
Imagine you are analyzing a stock and notice the following:
ATR(9) Crosses Above ATR(21):
A green "SA>LA" label appears.
The info table shows "Yes" for "Is ATR-based price volatile."
Position Size:
Based on your risk parameters, the position size is calculated.
Price Above 20 SMMA:
The info table shows "Yes" for "Is price > 20 SMMA."
Interpretation:
The market is experiencing increasing short-term volatility.
The trend is upward, as the price is above the 20 SMMA.
You may consider entering a long position, using the calculated position size to manage risk.
Customization
Colors and Transparency:
Adjust the colors of the bands and labels to suit your preferences.
Risk Parameters:
Modify the default values for risk amounts in the inputs.
Moving Average Period:
Change the SMMA period if desired.
Limitations and Considerations
Lagging Indicators: ATR and SMMA are lagging indicators and may not predict future price movements.
Market Conditions: The effectiveness of this indicator may vary across different assets and market conditions.
Risk of Overfitting: Relying solely on this indicator without considering other factors may lead to suboptimal trading decisions.
Conclusion
This indicator combines essential elements of technical analysis to provide a comprehensive tool for traders. By visualizing ATR bands anchored at the OHLC4, indicating volatility crossovers, and providing real-time data on position sizing and trend direction, it aids in making informed trading decisions.
Whether you're a novice trader looking to understand market volatility or an experienced trader seeking to refine your strategy, this indicator offers valuable insights directly on your TradingView charts.
Code Summary
The script is written in Pine Script™ version 5 and includes:
Calculations for OHLC4, ATRs, Bands, SMMA:
Uses built-in functions like ta.atr() and ta.rma() for calculations.
Plotting Functions:
plotshape() for the OHLC4 dotted line.
plot() and fill() for the ATR bands.
Crossover Detection:
ta.crossover() and ta.crossunder() for detecting ATR crosses.
Labeling Crossovers:
label.new() to place informative labels on the chart.
Information Table Creation:
table.new() to create the table.
table.cell() to populate it with data.
Acknowledgments
ATR and SMMA Concepts: Built upon standard technical analysis concepts widely used in trading.
Pine Script™: Leveraged the capabilities of Pine Script™ version 5 for advanced charting and analysis.
Note: Always test any indicator thoroughly and consider combining it with other forms of analysis before making trading decisions. Trading involves risk, and past performance is not indicative of future results.
Happy Trading!

ATR Price Targets (Daily, Weekly, Monthly)This indicator calculates and displays dynamic price targets based on the Average True Range (ATR) for daily, weekly, and monthly timeframes. It’s designed to help traders set volatility-based price targets for more precise stop-losses, take-profit levels, and trade management.
Features:
Daily, Weekly, and Monthly ATR Targets: Automatically calculates and plots upper and lower price targets based on ATR values for each timeframe.
Risk Management Tool: Ideal for setting stop-loss and take-profit levels based on market volatility.
Customizable Settings: You can adjust the ATR length and multiplier to match your preferred trading style and risk tolerance.
Visual Alerts: Background colors change when price reaches or exceeds the calculated targets, providing easy visual cues for decision-making.
How to Use:
Use the upper and lower price targets to set realistic exit points for your trades.
Adjust the ATR multiplier for more or less conservative targets based on market volatility.
Apply this across multiple timeframes to combine long-term and short-term volatility trends.
This indicator is perfect for traders looking to incorporate volatility analysis into their trading strategy using ATR.

[BRAIN] Absolute Volatility of Price
Hello traders!
Today I want to share with you a series of scripts and strategies that I developed a few years ago. This is one of my first works, born from the curiosity of seeing a candlestick representation in a different way, without considering the price movement along the y-axis.
Imagine observing the price movement in dollars and percentages, always starting from the same reference point: the 0 axis. This approach can offer new insights and ideas on how and how much prices move.
To explain it better, the open of each candle does not start from the previous close negotiations but always starts from the 0 axis . In this way, it is possible to clearly compare the bodies of the candles with each other.
Script Visualization Methods and Input
- Study Normal: Simply reports the prices, including the negative ones of the red candles, on the same scale in absolute terms (ABS), as shown in the first indicator above.
- Study Normal Neg: In this version, the red candles vary negatively below zero, instead of in absolute terms above zero, as shown in the second indicator above.
- Study Perc: Similar to "Study Normal" but uses percentage values instead of dollars, useful for very low timeframes and low variations with many decimals, such as 1 minute on EUR/USD.
- Study Perc Neg: Similar to "Study Normal Neg" but uses percentage values.
Additionally, I have added the possibility to display or not, through two buttons, an average of the candle bodies adjustable in length via input and the range of each candle, always correlated in dollars or percentages, as per the main study setting.
I hope this work can be useful to many of you. I invite you to like if you appreciate my scripts and want to see more like these. Do not hesitate to comment or contact me for any doubts or questions.
PS: If you notice that in the script the sum of the percentage values between the shadow and the body of the candle does not correspond to the range, it is only a rounding issue. Change the precision setting to a lower value and you will see that the rounding disappears.
PS: In the script, to better visualize the percentage growth and decline of the instrument on very high timeframes, I decided to represent it as follows:
- If close ≥ open: (high - low) / low * 100
- If close < open: (high - low) / high * 100
The same method is also applied for calculating the percentage variations of the shadows relative to themselves.
I hope you like this version! If you need any further modifications or adjustments, let me know. Good luck with your project!
(In the photos below I show 3 versions of the indicator open on 3 different tickers as an example: from top to bottom in the 3 indicators are set these Study: Study Normal, Study Perc and Study Perc Neg)

Volatility Trend Bands [UAlgo]The Volatility Trend Bands is a trend-following indicator that combines the concepts of volatility and trend detection. Built using the Average True Range (ATR) to measure volatility, this indicator dynamically adjusts upper and lower bands around price movements. The bands act as dynamic support and resistance levels, making it easier to identify trend shifts and potential entry and exit points.
With the ATR multiplier, this indicator effectively captures volatility-based shifts in the market. The use of midline values allows for accurate trend detection, which is displayed through color-coded signals on the chart. Additionally, this tool provides clear buy and sell signals, accompanied by intuitive graphical markers for ease of use.
The Volatility Trend Bands is ideal for traders seeking an adaptive trend-following method that responds to changing market conditions while maintaining robust volatility control.
🔶 Key Features
Dynamic Support and Resistance: The indicator utilizes volatility to create dynamic bands. The upper band acts as resistance, and the lower band acts as support for the price. Wider bands indicate higher volatility, while narrower bands indicate lower volatility.
Customizable Inputs
You can tailor the indicator to your strategy by adjusting the:
Price Source: Select the price data (e.g., closing price) used for calculations.
ATR Length: Define the lookback period for the Average True Range (ATR) volatility measure.
ATR Multiplier: This factor controls the width of the volatility bands relative to the ATR value.
Color Options: Choose colors for the bands and signal arrows for better visualization.
Visual Signals: Arrows ("▲" for buy, "▼" for sell) appear on the chart when the trend changes, providing clear entry point indications.
Alerts: Integrated alerts for both buy and sell conditions, allowing you to receive notifications for potential trade opportunities.
🔶 Interpreting Indicator
Upper and Lower Bands: The upper and lower bands are dynamic, adjusting based on market volatility using the ATR. These bands serve as adaptive support and resistance levels. When price breaks above the upper band, it indicates a potential bullish breakout, signaling a strong uptrend. Conversely, a break below the lower band signals a bearish breakout, indicating a downtrend.
Buy/Sell Signals: The indicator provides clear buy and sell signals at breakout points. A buy signal ("▲") is generated when the price breaks above the upper band, suggesting the start of a bullish trend. A sell signal ("▼") is triggered when the price breaks below the lower band, indicating the beginning of a bearish trend. These signals help traders identify potential entry and exit points at key breakout levels.
Color-Coded Bars: The bars on the chart change color based on the trend direction. Teal bars represent bullish momentum, while purple bars signify bearish momentum. This color coding provides a quick visual cue about the market's current direction.
🔶 Disclaimer
Use with Caution: This indicator is provided for educational and informational purposes only and should not be considered as financial advice. Users should exercise caution and perform their own analysis before making trading decisions based on the indicator's signals.
Not Financial Advice: The information provided by this indicator does not constitute financial advice, and the creator (UAlgo) shall not be held responsible for any trading losses incurred as a result of using this indicator.
Backtesting Recommended: Traders are encouraged to backtest the indicator thoroughly on historical data before using it in live trading to assess its performance and suitability for their trading strategies.
Risk Management: Trading involves inherent risks, and users should implement proper risk management strategies, including but not limited to stop-loss orders and position sizing, to mitigate potential losses.
No Guarantees: The accuracy and reliability of the indicator's signals cannot be guaranteed, as they are based on historical price data and past performance may not be indicative of future results.

Bollinger Bands ForLoopBollinger Bands ForLoop
OVERVIEW
BB ForLoop is an improved version of Bollinger Bands it is designed to calculate an array of values 1 or -1 depending if soruce for calculations is above or below basis.
It takes avereage of values over a range of lengths, providing trend signals smothed based on various moving averages in order to get rid of noise.
It offers flexibility with different signal modes and visual customizations.
TYPE OF SIGNALS
-FAST (MA > MA or MA > 0.99)
-SLOW (MA > 0)
-THRESHOLD CROSSING (when cross above/below treshold set independently for both directions)
-FAST THRESHOLD (when there's change in signal by set margin e.g (0.4 -> 0.2) means bearsih when FT is set to 0.1, when MA is > 0.99 it will signal bullish, when MA < -0.99 it will signal bearish)
Generaly Lime color of line indicates Bullish, Fuchsia indicates Bearish.
This colors are not set in stone so you can change them in settings.
-Bullish Trend, line color is lime
-Bearish Trend, line color is fuchsia
Credit
Idea for this script was from one of indicators created by www.tradingview.com
Warning
Be careful when using this indicator especialy combining DEMA with FT (Fast Treshold).
This indicator can be really noisy depending on the settings, signal mode so it should be used preferably as a part of an strategy not as a stand alone indicator
Remember the lower the timeframe you use the more noise there is.
No single indicator should be used alone when making investment decisions.
