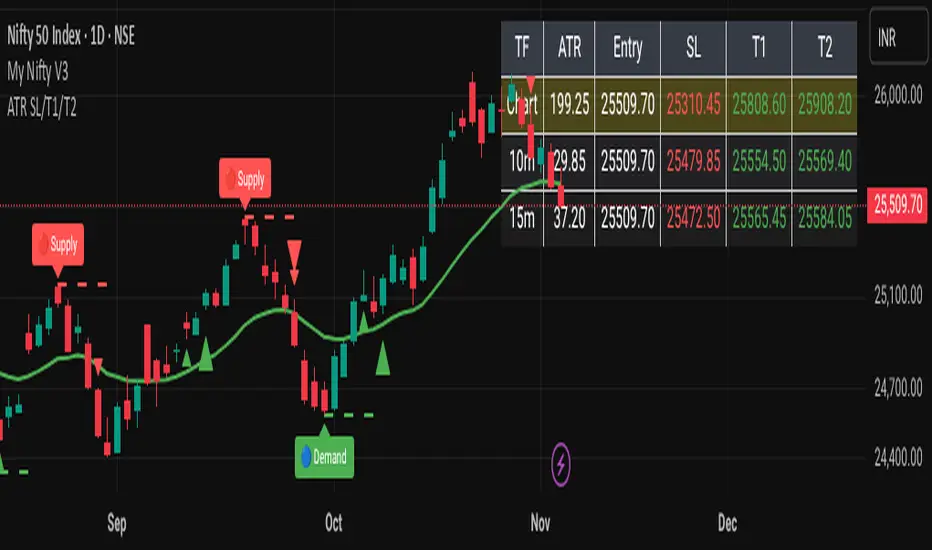
Risk Management Plan (Shares)What it does
This indicator displays a compact risk-management panel on the chart (middle-right). It helps you size positions, quantify risk in % and $, estimate shares to buy, and derive suggested stop/target prices from your chosen risk and R/R ratio. It also shows the % move from entry to stop/target and a “Max. Share Price (per system)” threshold derived from your accepted loss and R/R.
Why it’s useful
Many losses come from oversizing and inconsistent risk. This panel keeps the key numbers in one place—capital exposure, shares, stop/target math, and % distances—so your trade planning remains disciplined and repeatable.
Inputs
1. Capital Size ($)
2. Position Size (%)
3. Defined Risk (%) on capital
4. R/R Ratio (R:1) – enter R
5. Entry Price ($) (optional; if 0, the script uses close
Calculations (key formulas)
1. Position Size ($) = Capital × Position Size (%)
2. Shares to Buy = floor(Position Size ($) ÷ Entry Price)
3. Defined Risk ($) = Capital × Defined Risk (%)
4. Suggested Stop Price = (Position Size ($) − Defined Risk ($)) ÷ Shares
5. Suggested Target Price = (Position Size ($) + Defined Risk ($) × R) ÷ Shares
6. Entry → Stop (%) = (Entry − Stop) ÷ Entry × 100 (displayed negative)
7. Entry → Target (%) = (Target − Entry) ÷ Entry × 100
8. Max. Share Price (per system) = Position Size ($) × R ÷ |Defined Risk ($)|
How to use
1. Set Capital Size, Position Size (%), Defined Risk (%), and R/R.
2. Optionally set Entry Price (otherwise the script uses the chart’s close).
3. Read the panel: entry (blue), stop values (red), target values (green), risk (%) and ($) displayed negative for clarity.
4. Use Max. Share Price (per system) as a quick threshold check under your risk assumptions.
Note: If the Suggested Target or Suggested Stop is not aligned with your trading plan, adjust Position Size (%), R/R Ratio, and/or Defined Risk (%). The panel will update the levels accordingly so you can match your plan.
Notes & limitations
* Indicator only (no signals or strategy backtest).
* No lookahead/repainting; values depend on user inputs and current chart data.
* Educational use only; trading involves risk. Consider fees, slippage, and market conditions.
Version: v1.0 – Initial release (Pine Script v6)
Stop de volatilidad
ADR(20)% - Qullamagi (corner value) v6This indicator displays the 20-bar Average Daily Range (ADR) either as a percentage of price or in raw dollar terms, shown in a clean corner box on the chart.
Switch between % ADR and $ ADR with a single checkbox.
Place the output box in any chart corner.
Useful for volatility assessment, stop-loss sizing, and stock selection.
Inspired by the trading approach of Kristjan Qullamägi (Qullamaggie), who uses ADR(20) both to filter high-momentum stocks and to size risk (stops should generally be ≤ 1×ADR).
ADR(20)% - Qullamagi (corner value) v6Description:
This indicator calculates the 20-day Average Daily Range (ADR) as a percentage (or in raw $) and displays it in a clean corner table on the chart.
Formula: average of (High ÷ Low – 1) over the last 20 bars.
Use % or $ mode via settings.
Position the box in any chart corner.
Inspired by Kristjan Qullamägi (Qullamaggie), who uses ADR to filter strong movers and size stop-losses (stops should generally be ≤ 1×ADR).
ADR(20) % ValueDisplays the 20-day Average Daily Range (ADR) as a % of price, following the method popularized by Kristjan Qullamägi (Qullamaggie). The ADR value updates dynamically and is printed directly on the chart for quick reference.
ATR Position Size Calc+Stop guessing your position size. This indicator automatically calculates the optimal number of contracts or shares for each trade.
It is designed for one purpose: to help you maintain consistent risk management by adjusting your trade size based on current market volatility (ATR) and your fixed monetary risk.
// KEY FEATURES
Consistent Risk : Set your max risk in dollars (e.g., $300), and the script calculates the exact position size to match it.
Volatility-Based Stops : Uses the ATR to define a logical stop loss that adapts to market conditions.
Stable Calculation : The calculation is based on the previous closed candle, so the value is reliable and doesn't change intra-bar.
// HOW TO USE
In the settings, simply define your max risk per trade ($) and your ATR parameters. The indicator does the rest.
The essential tool for disciplined trading.
Skully ATR Stoploss LevelsA comprehensive ATR-based stop loss indicator designed for precise risk management across all trading styles.
✨ KEY FEATURES:
- Live Price Levels: Display up to 3 real-time stop loss lines above/below current candle
- Historical Analysis: Scroll back to see ATR levels at any historical candle
- Triple ATR System: Three customizable ATR multipliers (1.0x, 1.5x, 2.0x default)
- Long/Short Separation: Independent controls for bullish and bearish setups
- Clean Interface: Minimal visual clutter with smart default settings
🎯 PERFECT FOR:
- Swing traders setting daily/weekly stops
- Day traders needing quick, precise risk management
- Position sizing based on volatility
- Multi-timeframe stop analysis (customizable in settings)
📊 HOW IT WORKS:
The indicator calculates Average True Range over your chosen period and displays stop loss levels at 1x, 1.5x, and 2x ATR distances (also customizable). Toggle individual levels on/off, and use historical steplines to analyze/backtest past setups.
⚙️ SMART DEFAULTS:
- Only ATR1 Long Level (Live Price) visible by default (to keep charts clean)
- Historical data available but invisible until needed
- Works across any timeframe and asset class
- Default colors will display cleanly on both Dark and Light charts
Perfect for traders who want professional-grade stop placement without chart clutter.
ATR Dynamic Stop (Table + Plot + ATR %)📊 This script displays dynamic stop levels based on ATR, designed for active traders.
Features:
- Shows long and short stop levels (price ± ATR × multiplier).
- Displays values as a floating table on the top-right corner.
- Optional plot lines directly on the chart.
- Option to calculate based on realtime price or last close.
- Displays the ATR value both in price units and as a percentage of the selected price.
- Fully customizable table: text size, text color, background color.
Inputs:
- ATR Multiplier and Length.
- Show/hide stop lines on the chart.
- Select price source (realtime or last close).
- Table appearance options.
Ideal for:
- Traders who want a clear visual stop guide.
- Combining volatility with risk management.
Capital Risk OptimizerCapital Risk Optimizer 🛡️
The Capital Risk Optimizer is an educational tool designed to help traders study capital efficiency, risk management, and scaling strategies when using leverage.
This script calculates and visualizes essential metrics for managing leveraged positions, including:
Entry Price – The current market price.
Stop Loss Level – Automatically derived using the 30-bar lowest low minus 1 ATR (default: 14-period ATR), an approach designed to create a dynamic, volatility-adjusted stop loss.
Stop Loss Distance (%) – The percentage distance between entry and stop.
Maximum Safe Leverage – The highest leverage allowable without risking liquidation before your stop is reached.
Margin Required – The amount of collateral necessary to support the desired position size at the calculated leverage.
Position Size – The configurable notional value of your trade.
These outputs are presented in a clean, customizable table overlay so you can quickly understand how position sizing, volatility, and leverage interact.
By default, the script uses a 14-period ATR combined with the lowest low of the past 30 bars, providing an optimal balance between sensitivity and noise for defining stop placement. This methodology helps traders account for market volatility in a systematic way.
The Capital Risk Optimizer is particularly useful as a portfolio management tool, supporting traders who want to study how to scale into positions using risk-adjusted sizing and capital efficiency principles. It pairs best with backtested strategies, and does not directly produce signals of any kind.
How to Use:
Set your desired position size.
Adjust the ATR and lookback settings to fine-tune stop loss placement.
Study the resulting leverage and margin requirements in real time.
Use this information to simulate and visualize potential trade scenarios and capital allocation models.
Disclaimer:
This script is provided for educational and informational purposes only. It does not constitute financial advice and should not be relied upon for live trading decisions. Always do your own research and consult with a qualified professional before making any trading or investment decisions.
ATR Buy, Target, Stop + OverlayATR Buy, Target, Stop + Overlay
This tool is to assist traders with precise trade planning using the Average True Range (ATR) as a volatility-based reference.
This script plots buy, target, and stop-loss levels on the chart based on a user-defined buy price and ATR-based multipliers, allowing for objective and adaptive trade management.
*NOTE* In order for the indicator to initiate plotted lines and table values a non-zero number must be entered into the settings.
What It Does:
Buy Price Input: Users enter a manual buy price (e.g., an executed or planned trade entry).
ATR-Based Target and Stop: The script calculates:
Target Price = Buy + (ATR × Target Multiplier)
Stop Price = Buy − (ATR × Stop Multiplier)
Customizable Timeframe: Optionally override the ATR timeframe (e.g., use daily ATR on a 1-hour chart).
Visual Overlay: Lines are drawn directly on the price chart for the Buy, Target, and Stop levels.
Interactive Table: A table is displayed with relevant levels and ATR info.
Customization Options:
Line Settings:
Adjust color, style (solid/dashed/dotted), and width for Buy, Target, and Stop lines.
Choose whether to extend lines rightward only or in both directions.
Table Settings:
Choose position (top/bottom, left/right).
Toggle individual rows for Buy, Target, Stop, ATR Timeframe, and ATR Value.
Customize text color and background transparency.
How to Use It for Trading:
Plan Your Trade: Enter your intended buy price when planning a trade.
Assess Risk/Reward: The script immediately visualizes the potential stop-loss and target level, helping assess R:R ratios.
Adapt to Volatility: Use ATR-based levels to scale stop and target dynamically depending on current market volatility.
Higher Timeframe ATR: Select a different timeframe for the ATR calculation to smooth noise on lower timeframe charts.
On-the-Chart Reference: Visually track trade zones directly on the price chart—ideal for live trading or strategy backtesting.
Ideal For:
Swing traders and intraday traders
Risk management and trade planning
Traders using ATR-based exits or scaling
Visualizing asymmetric risk/reward setups
How I Use This:
After entering a trade, adding an entry price will plot desired ATR target and stop level for visualization.
Adjusting ATR multiplier values assists in evaluating and planning trades.
Visualization assists in comparing ATR multiples to recent support and resistance levels.
ATR Screener with Labels and ShapesWeekly Daily ATR Pine Scanner
To find out tightness or contraction in a stock we needs to check if volatality is decreasing as well as compared to previous 14 or 10 bars volatility . we check this for weekly and then for Daily , so that we can enter in a stock which is tightest in recent times.
Condition is :
1. Weekly Candle ATR x 0.8 < 10 Week ATR
2. Daily Candle ATR x 0.6 < 14 Day ATR
When both of the conditions are met then they signifies that the stock has tightened in weekly and daily aswell . so now we can find ways to enter during max squeeze.
How to scan in Pine Scanner ?
FIrst add indicator as favourite and Go to pine scanner page in trading view and then scan your watchlist and there you will see 3 columns 1 with only Weekly conditions met , 2 with only Daily and 3rd with Both conditions met .
Select stocks and move to new watchlist and now you have those stocks which has contracted the most in recent times .
AsturRiskPanelIndicator Summary
ATR Engine
Length & Smoothing: Choose how many bars to use (default 14) and the smoothing method (RMA/SMA/EMA/WMA).
Median ATR: Computes a rolling median of ATR over a user-defined look-back (default 14) to derive a “scalp” target.
Scalp Target
Automatically set at ½ × median ATR, snapped to the nearest tick.
Optional rounding to whole points for simplicity.
Stop Calculation
ATR Multiplier: Scales current ATR by a user input (default 1.5) to produce your stop distance in points (and ticks when appropriate).
Distortion Handling: Switches between point-only and point + tick displays based on contract specifications.
Risk & Sizing
Risk % of account per trade (default 2 %).
Calculates dollar risk per contract and optimal contract count.
Displays all metrics (scalp, stop, risk/contract, max contracts, max risk, account size) in a customizable on-chart table.
ATR-Based Stop Placement Guidelines
Trade Context ATR Multiplier Notes
Tight Range Entry 1.0 × ATR High-conviction, precise entries. Expect more shake-outs.
Standard Trend Entry 1.5 × ATR Balanced for H2/L2, MTR, DT/DB entries.
Breakouts/Microchannels 2.0 × ATR Wide stops through chop—Brooks-style breathing room.
How to Use
Select ATR Settings
Pick an ATR length (e.g. 14) and smoothing (RMA for stability).
Adjust the median length if you want a faster/slower scalp line.
Align Multiplier with Your Setup
For tight-range entries, set ATR Multiplier ≈ 1.0.
For standard trend trades, leave at 1.5.
For breakout/pullback setups, increase to 2.0 or more.
Customize Risk Parameters
Enter your account size and desired risk % per trade (e.g. 2 %).
The table auto-calculates how many contracts you can take.
Read the On-Chart Table
Scalp shows your intraday target.
Stop gives Brooks-style stop distance in points (and ticks).
Risk/Contract is the dollar risk per contract.
Max Contracts tells you maximum position size.
Max Risk confirms total dollar exposure.
Visual Confirmation
Place your entry, then eyeball the scalp and stop levels against chart structure (e.g. swing highs/lows).
Adjust the ATR multiplier if market context shifts (e.g. volatility spikes).
By blending this sizing panel with contextual ATR multipliers, you’ll consistently give your trades the right amount of “breathing room” while keeping risk in check.
Realtime ATR-Based Stop Loss Numerical OverlayRealtime ATR-Based Stop Loss Numerical Overlay
A simple, effective tool for dynamic risk management based on ATR (Average True Range) without adding cluttered and distracting lines all over your chart.
📌 Description
This script plots a real-time stop loss level using the Average True Range (ATR) on your chart, helping you set consistent, volatility-based stops. It supports both:
✅ Current chart timeframe
✅ Custom fixed timeframe inputs (1m, 5m, 15m, 1h, etc.)
The stop level is calculated as:
Stop = ATR × Multiplier
and updates in real-time. An overlay table displays on the bottom-right of your chart with the calculated stop value in a clean, simple way.
⚙️ Settings
ATR Timeframe Source:
Choose between using the current chart's timeframe or a fixed one (e.g. 5, 15, 60, D, etc).
ATR Length:
Period used to calculate the ATR (default is 14).
Stop Loss Multiplier:
Multiplies the ATR value to define your stop (e.g., 1.5 × ATR).
Wait for Timeframe Closes:
If enabled, the ATR value waits for the selected timeframe’s candle to close before updating. If unselected, it will update in real time.
🛠️ How to Use
Add this script to your chart from your indicators list.
Configure your desired timeframe, ATR length, and multiplier in the settings panel.
Use the value shown in the table overlay as your suggested stop loss distance from entry.
Adjust your position sizing accordingly to fit your risk tolerance.
This tool is especially useful for traders looking for adaptive risk management that evolves with market volatility — whether scalping intraday or swing trading.
💡 Pro Tip
The ATR stop can also be used to dynamically trail your stop behind price movement.
Risk ModuleRisk Module
This indicator provides a visual reference to determine position sizing and approximate stop placement. It is designed to support trade planning by calculating equalized risk per trade based on a stop distance derived from volatility. The tool offers supportive reference points that allow for quick evaluation of risk and position size consistency across varying markets.
Equalized Risk Per Trade
The indicator calculates the number of shares that can be traded to maintain consistent monetary risk. The formula is based on the distance between the current price and the visual stop reference, adjusting the position size proportionally.
Position Size = Dollar Risk / (Entry Price – Stop Price)
The risk is calculated as a percentage of account size; both of which can be set in the indicator’s settings tab. This creates a consistent risk exposure across trades regardless of volatility or structural stop distance.
Stop Placement Reference
The visual stop reference is derived from the Average True Range (ATR), providing a volatility-based anchor. The default value is set to 2 × ATR, but this can be customized.
Price Model: Uses the current price ± ATR × multiplier. This model reacts to price movement and is set as the default option.
EMA Model: Uses the 20-period EMA ± ATR × multiplier. This model is less reactive and can be an option when used in combination with an envelope indicator.
Chart Elements
Stop Levels: Plotted above and below either the current price or EMA, depending on the selected model. These serve as visual reference points for stop placement; the lower level a sell stop for long trades, the upper level a buy stop for short trades.
Information Table: Displays the number of shares to trade, stop level and percentage risk. A compact mode is available to reduce the table to essential information (H/L and Shares).
Settings Overview
Stop Model: Choose between “Price” or “EMA” stop calculation logic.
ATR Multiplier: Change the distance between price/EMA and the stop reference.
Account Size / Risk %: These risk parameters are used to calculate dollar risk per trade.
Visible Bars: Number of recent bars to show stop markers on.
Compact Mode: Minimal table view for reduced chart footprint.
Table Position / Size: Controls table placement and scale on the chart.
Circuit Breaker LevelsThis indicator will show the Previous Day's Close and +/- 4.5% (Warning Level for Prop Firms), 5% (Prop Firm Trading Halted), 7% (First CME Circuit Breaker), 13% (Second CME Circuit Breaker), and 20% (Final CME Circuit Breaker All Trading Halted for the Day).
Profit Trailing BBandsProfit Trailing Trend BBands v4.7.5 with Double Trailing SL
A TradingView Pine Script Strategy
Created by Kevin Bourn and refined with the help of Grok 3 (xAI)
Overview
Welcome to Profit Trailing Trend BBands v4.7.5, a dynamic trading strategy designed to ride trends and lock in profits with a unique double trailing stop-loss mechanism. Built for TradingView’s Pine Script v6, this strategy combines Bollinger Bands for trend detection with a smart trailing system that doubles down on profit protection. Whether you’re trading XRP or any other asset, this tool aims to maximize gains while keeping risk in check—all with a clean, visual interface.
What It Does
Identifies Trends: Uses Bollinger Bands to spot uptrends (price crossing above the upper band) and downtrends (price crossing below the lower band).
Enters Positions: Opens long or short trades based on trend signals, with customizable position sizing and leverage.
Trails Profits: Employs a two-stage trailing stop-loss:
Initial Trailing SL: Acts as a take-profit level, set as a percentage (%) or dollar ($) distance from the entry price.
Tightened Trailing SL: Once the initial profit target is hit, the stop-loss tightens to half the initial distance, locking in gains as the trend continues.
Manages Risk: Includes a margin call feature to exit losing positions before they blow up your account.
Visualizes Everything: Plots Bollinger Bands (blue upper, orange lower) and a red stepped trailing stop-loss line for easy tracking.
Why Built It?
Captures Trends: Bollinger Bands are a proven way to catch momentum, and we tuned them for responsiveness (short length, moderate multiplier).
Secures Profits: Traditional trailing stops often leave money on the table or exit too early. The double trailing SL first takes a chunk of profit, then tightens up to ride the rest of the move.
Stays Flexible: Traders can tweak price sources, stop-loss types (% or $), and position sizing to fit their style.
Looks Good: Clear visuals help you see the strategy in action without cluttering your chart.
Originally refined for XRP, it’s versatile enough for most markets — crypto, forex, stocks, you name it.
How It Works
Core Components
Bollinger Bands:
Calculated using a simple moving average (SMA) and standard deviation.
Default settings: 6-period length, 1.66 multiplier.
Upper Band (blue): SMA + (1.66 × StdDev).
Lower Band (orange): SMA - (1.66 × StdDev).
Trend signals: Price crossing above the upper band triggers a long, below the lower band triggers a short.
Double Trailing Stop-Loss:
Initial SL: Set via "Trailing Stop-Loss Value" (default 6% or $6). Trails the price at this distance and doubles as the first profit target.
Tightened SL: Once price hits the initial SL distance in profit (e.g., +6%), the SL tightens to half (e.g., 3%) and continues trailing, locking in gains.
Visualized as a red stepped line, only visible during active positions.
Position Sizing:
Choose "% of Equity" (default 30%) or "Amount in $" to set trade size.
Leverage (default 10x) amplifies positions, capped by available equity to avoid overexposure.
Margin Call:
Exits positions if drawdown exceeds the "Margin %" (default 10%) to protect your account.
Backtesting Filter:
Starts trading after a user-defined date (default: Jan 1, 2020) for focused historical analysis.
Trade Logic
Long Entry: Price crosses above the upper Bollinger Band → Closes any short position, opens a long.
Short Entry: Price crosses below the lower Bollinger Band → Closes any long position, opens a short.
Exit: Position closes when price hits the trailing stop-loss or triggers a margin call.
How to Use It
Setup
Add to TradingView:
Open TradingView, go to the Pine Editor, paste the script, and click "Add to Chart."
Ensure you’re using Pine Script v6 (the script includes @version=6).
Configure Inputs:
Start Date for Backtesting: Set the date to begin historical testing (default: Jan 1, 2020).
BB Length & Mult: Adjust Bollinger Band sensitivity (default: 6, 1.66).
BB Price Source: Choose the price for BBands (default: Close).
Trend Price Source: Choose the price for trend detection (default: Close).
Trailing Stop-Loss Type: Pick "%" or "$" (default: Trailing SL %).
Trailing Stop-Loss Value: Set the initial SL distance (default: 6).
Margin %: Define the max drawdown before exit (default: 10%).
Order Size Type & Value: Set position size as % of equity (default: 30%) or $ amount.
Leverage: Adjust leverage (default: 10x).
Run It:
Use the Strategy Tester tab to backtest on your chosen asset and timeframe.
Watch the chart for blue/orange Bollinger Bands and the red trailing SL line.
Tips for Traders
Timeframes: Works on any timeframe, but test 1H or 4H for XRP—great balance of signals and noise.
Assets: Optimized for XRP, but tweak slValue and mult for other markets (e.g., tighter SL for low-volatility pairs).
Risk Management: Keep marginPercent low (5-10%) for volatile assets; adjust leverage based on your risk tolerance.
Visuals: The red stepped SL line shows only during trades—zoom in to see its tightening in action.
Visuals on the Chart
Blue Line: Upper Bollinger Band (trend entry for longs).
Orange Line: Lower Bollinger Band (trend entry for shorts).
Red Stepped Line: Trailing Stop-Loss (shifts tighter after the first profit target).
Order Labels: Short tags like "OL" (Open Long), "CS" (Close Short), "LSL" (Long Stop-Loss), etc., mark trades.
Disclaimer
Trading involves risk. This strategy is for educational and experimental use—backtest thoroughly and use at your own risk. Past performance doesn’t guarantee future results. Not financial advice—just a tool from traders, for traders.
SUPeR TReND 2.718An evolved version of the classic Supertrend, SUPeR TReND 2.718 is built to deliver elegant, high-precision trend detection using Euler's constant (e = 2.718) as its default multiplier. Designed for clarity and visual flow, this indicator brings together smooth line work, intelligent color logic, and a minimalistic tally system that tracks trend persistence — all in a highly customizable, overlay-ready format.
Unlike traditional implementations, this version maintains line visibility regardless of fill opacity, ensuring crisp tracking even in complex environments. Ideal for traders who value both aesthetics and actionable structure.
__________________________________________________________
🔑 Key Features:
- 📐 ATR-based Supertrend with default multiplier = e (2.718)
- 📉 Dynamic trend line with optional fill beneath price
- ⏳ Trend duration tally label (count-only or full format)
- ⬆️ Higher-timeframe Supertrend overlay (optional)
- 🟢 Directional candle coloring for clarity
- 🟡 Subtle anchor line to guide perception without clutter
- ⚙️ PineScript v6 compliant, efficient and modular
__________________________________________________________
🧠 Interpretation Guide:
- The Supertrend line tracks trend support or resistance — beneath price in uptrends, above in downtrends.
- The shaded fill reflects direction with 70% transparency.
- The trend tally label counts how long the current trend has lasted.
- Candle colors confirm direction without overtaking price action.
- The optional HTF line shows higher-timeframe context.
- A soft yellow anchor line stabilizes the fill relationship without distraction.
__________________________________________________________
⚙️ Inputs & Controls:
- ✏️ ATR Length – Volatility lookback
- 🧮 Multiplier – Default = 2.718 (Euler's number)
- 🕰️ Higher Timeframe – Choose your bias frame
- 👁️ Show HTF / Main – Toggle each trend layer
- 🧾 Show Label / Simplify – Show trend duration, with or without arrows
- 🎨 Color Candles – Turn directional bar coloring on or off
- 🪄 Show Fill – Toggle the shaded visual rhythm
- 🎛️ All visuals use tuned colors and transparencies for clarity
__________________________________________________________
🚀 Best Practices:
- ✅ Works on any time frame; shines on 1h v. 1D
- 🔁 Use the HTF line for macro bias filtering
- 📊 Combine with volume or liquidity overlays for edge
- 🧱 Use as a structural base layer with minimalist stacks
__________________________________________________________
📈 Strategy Tips:
- 🧭 MTF Trend Alignment: Enable the HTF line to filter trades. If the HTF trend is up, only take longs on the lower frame, and vice versa.
- 🔁 Pullback Entries: During a strong trend, consider short-term dips below the Supertrend line as possible re-entry zones — only if HTF remains aligned.
- ⏳ Tally for Exhaustion: When the bar count exceeds 15+, look for confluence (volume divergence, key levels, reversal signals).
- ⚠️ HTF Flip + Extended Trend: When the HTF trend reverses while the main trend is extended, that may be a macro exit or fade signal.
- 🚫 Solo Mode: Disable HTF and use the main trend + tally as a standalone signal layer.
- 🧠 Swing Setup Friendly: Especially powerful on 1D or 1h in swing systems or trend-based grid strategies.
Smart Stop-Loss (SSL)Smart Stop-Loss (SSL) Indicator
Overview
The Smart Stop-Loss (SSL) indicator is an advanced risk management tool designed to help traders set dynamic stop-loss levels based on market structure, volatility, and momentum. Unlike traditional fixed stop-loss methods, SSL adapts to changing market conditions, helping to avoid premature exits while protecting capital during true reversals.
Key Features
1. Volatility-Based Adjustments
- Uses Average True Range (ATR) to measure market volatility
- Automatically widens stop-loss during volatile periods and tightens during calm markets
- Customizable ATR multiplier (default: 1.5x) to adjust sensitivity
2. Market Structure Integration
- Identifies significant swing highs and lows to establish support/resistance levels
- Places stop-loss levels beyond these structural points to avoid common stop hunts
3. Fair Value Gap (FVG) Detection
- Identifies imbalances in order flow that often lead to strong directional moves
- Bullish FVG: A gap up where the current high is below previous low
- Bearish FVG: A gap down where the current low is above previous high
4. Smart Stop-Loss Tightening
- Automatically tightens stop-loss when FVGs are mitigated (filled)
- Uses RSI as a momentum filter to prevent premature adjustments
- Creates a trailing effect that locks in profits as trades move favorably
How to Use
For Long Positions:
1. **Entry**: Look for bullish FVG formations (green step line appears)
2. **Stop-Loss Placement**: Set your stop at or slightly below the green step line
3. **Stop Adjustment**: When price closes above the FVG zone and RSI > 50, the stop will automatically tighten
4. **Exit**: Exit the position when price closes below the green line or when your profit target is reached
For Short Positions:
1. **Entry**: Look for bearish FVG formations (red step line appears)
2. **Stop-Loss Placement**: Set your stop at or slightly above the red step line
3. **Stop Adjustment**: When price closes below the FVG zone and RSI < 50, the stop will automatically tighten
4. **Exit**: Exit the position when price closes above the red line or when your profit target is reached
Real-World Examples
Example 1: Trend Continuation
In an uptrend, when a bullish FVG appears, it often indicates institutional buying pressure. The SSL will place a stop below the swing low with an ATR buffer. As price continues upward and mitigates the FVG, the SSL tightens to protect profits while allowing the trend to continue.
Example 2: Avoiding Premature Exits
During normal market fluctuations, traditional fixed stops might get triggered too early. The SSL's adaptive nature accounts for volatility, keeping you in profitable trades longer by positioning stops beyond noise levels.
Example 3: Protecting Against Reversals
When a true reversal occurs, the momentum filter (RSI) will confirm the change in direction, allowing the SSL to maintain wider protection rather than prematurely tightening in a false move.
Tips for Best Results
1. **Timeframe Selection**: Works best on 1H, 4H and daily charts where market structure is more reliable
2. **Combine with Trend Analysis**: Use in conjunction with trend identification tools
3. **ATR Adjustment**: Increase the ATR multiplier for more volatile instruments
4. **Alert Setup**: Configure the built-in alerts to notify you when stop levels are breached
5. **Visual Confirmation**: The labels show exact stop values to help with order placement
Disclaimer
This indicator is provided for informational and educational purposes only. While it uses advanced techniques to determine potential stop-loss levels, no indicator can predict market movements with certainty. Always manage your risk appropriately and never risk more than you can afford to lose. Past performance is not indicative of future results. The developer of this indicator accepts no liability for trading losses incurred from its use. Always test thoroughly on demo accounts before using in live trading.
Custom SL/TP ZonesThe "Please Don't Stop Me Now" Indicator 📊
Ever found yourself staring at a chart, thinking "This is DEFINITELY the bottom!" only to watch your stop loss get hit faster than your ex replacing you? Well, this indicator won't stop that from happening, but at least you'll know exactly where you're going to be wrong! 🎯
How it works:
See a setup you like? Pick your candle of choice (make sure it's closed - we're not fortune tellers here)
Hit either Bull or Bear (choose wisely, or don't - we all know it's 50/50 anyway)
3. Marvel at the beautiful boxes showing your:
Take Profit Zone (where you'll exit too early)
Stop Loss Zone (where you'll probably exit, let's be honest)
Features:
Uses ATR for dynamic zones because "one size fits all" only works in disappointing Halloween costumes
Extends 10 bars into the future, giving you plenty of time to watch your prediction go wrong
Price labels included so you know exactly where to set your alerts (and subsequently ignore them)
Customizable multipliers for when you're feeling extra brave (or foolish)
Clean interface that won't distract you from your bad decisions
Remember: The market can stay irrational longer than you can stay solvent, but at least with this indicator, you'll know exactly where your rationality ends and your "This time it's different" begins!
Happy Trading! (Results may vary, tears not included)
Settings:
TP Multiplier: How far to your dreams (Default: 4.0)
SL Multiplier: How far to your nightmares (Default: 2.0)
Bar Offset: Pick your poison (1 = last closed bar)
Colors: Because trading isn't painful enough in grayscale
4 EMA & MACDThe indicator that combines Moving Average and MACD into one is very useful for providing a more complete picture of the market. Here's how it works:
Moving Average (MA): This is a trend indicator that smooths the price to show the dominant trend direction. MA helps traders determine whether the market is in an uptrend, downtrend, or sideways. For example, if the price is above the MA, it might indicate an uptrend, while if the price is below the MA, it might indicate a downtrend.
MACD (Moving Average Convergence Divergence): MACD measures market momentum and can provide entry and exit signals based on the difference between two moving averages (fast MA and slow MA). A buy signal occurs when the MACD crosses above the signal line, and a sell signal occurs when the MACD crosses below the signal line.
Combining both gives traders a more complete view:
MA provides an overview of the larger trend direction.
MACD helps identify moments when momentum supports a position for entering or exiting.
Common usage:
Entry: If the price is above the Moving Average (uptrend) and the MACD shows a buy signal (for example, MACD crossing above the signal line), it can be a signal to buy.
Exit: If the price starts moving below the MA and the MACD shows a sell signal, it can be a signal to sell or exit the position.
There is an indicator called MACD + Moving Average Cross, which combines both elements, providing stronger signals and making it easier to follow the market.
Triple Power Stop [CHE]Triple Power Stop
This indicator provides a comprehensive multi-timeframe approach for stop level and trend analysis, tailored for traders who want enhanced precision and adaptability in their trading strategies. Here's what makes the Triple Power Stop (CHE) stand out:
Key Features:
1. ATR-Based Stop Levels:
- Uses the Average True Range (ATR) to dynamically calculate stop levels, ensuring sensitivity to market volatility.
- Adjustable ATR multiplier for fine-tuning the stop levels to fit different trading styles.
2. Multi-Timeframe Analysis:
- Evaluates trends across three different timeframes with user-defined multipliers.
- Enables deeper insight into the market's broader context while keeping the focus on precision.
3. Dynamic Volatility Adjustment:
- Introduces a unique volatility factor to enhance stop-level calculations.
- Adapts to market conditions, offering reliable support for both trending and ranging markets.
4. Clear Trend Visualization:
- Stop levels and trends are visually represented with color-coded lines (green for uptrend, red for downtrend).
- Seamlessly integrates trend changes and helps identify potential reversals.
5. Signal Alerts:
- Long and short entry signals are plotted directly on the chart for actionable insights.
- Eliminates guesswork and provides clarity in decision-making.
6. Customizability:
- Adjustable parameters such as ATR length, multipliers, and label counts, allowing traders to tailor the indicator to their strategies.
Practical Use:
The Triple Power Stop (CHE) is ideal for traders who want to:
- Manage risk effectively: With dynamically calculated stop levels, traders can protect their positions while allowing room for natural market fluctuations.
- Follow the trend: Multi-timeframe trend detection ensures alignment with broader market movements.
- Simplify decisions: Clear visual indicators and signals make trading decisions more intuitive and less stressful.
How to Use:
1. Set the ATR length and multiplier values based on your risk tolerance and trading strategy.
2. Choose multipliers for different timeframes to adapt the indicator to your preferred resolutions.
3. Use the color-coded trend lines and entry signals to time your trades and manage positions efficiently.
Disclaimer:
The content provided, including all code and materials, is strictly for educational and informational purposes only. It is not intended as, and should not be interpreted as, financial advice, a recommendation to buy or sell any financial instrument, or an offer of any financial product or service. All strategies, tools, and examples discussed are provided for illustrative purposes to demonstrate coding techniques and the functionality of Pine Script within a trading context.
Any results from strategies or tools provided are hypothetical, and past performance is not indicative of future results. Trading and investing involve high risk, including the potential loss of principal, and may not be suitable for all individuals. Before making any trading decisions, please consult with a qualified financial professional to understand the risks involved.
By using this script, you acknowledge and agree that any trading decisions are made solely at your discretion and risk.
Enhance your trading precision and confidence with Triple Power Stop (CHE)! 🚀
Happy trading
Chervolino
ATR ReadoutDisplays a readout on the bottom right corner of the screen displaying ATR average (not of the individual candlestick, but of the current rolling period, including the candlestick in question).
Due to restrictions with Pine Script (or my knowledge thereof) only the current and previous candlestick data is shown, rather than the one currently hovered over.
The data is derived via the standard calculation for ATR.
Using this, one can quickly and easily get the proper data needed to calculate one's stop loss, rather than having to analyze the line graph of the basic ATR indicator.
Settings are implemented to change certain variables to your liking.
ka66: Candle Range MarkThis is a simple trailing stop loss tool using bar ranges, to be used with some discretion and understanding of basic price action.
Given a configurable percentage value, e.g. 25%:
A bullish bar (close > open) will be marked at the lower 25%
A bearish bar (close < open) will be marked at the upper 25%
The idea is to move your stop loss after each completed bar in the direction of the trade, at the configured percentage value.
If you have an inside bar, or something very close to it, or a doji-type bar, don't trail that, because there is no clarity of what the bar means, we can only wait.
The chart shows an example use, with trailing at 10% of the bar, from the initial stop loss after entry, trailing till we get stopped out. Some things to note:
Because this example focuses on a short trade, we ignore the bullish candles, and keep our trailing stop at the last bearish candle.
We ignore doji-esque candles and inside bars, where the body is in the range of the prior candle. Some definitions of inside bars include the wicks as well. I don't have a strong opinion, and this example is just for illustration. Furthermore, the inside bar will likely be the opposite of the swing bars (e.g. bullish bar in a range of bearish bars), so our stop remains unchanged.
One could use this semi-systematic approach in scalping on any timeframe, for example to maximise gains, adjusting the bar percentage as needed.
Visual ATR StopThis indicator uses the Average True Range (ATR) to display a visual range for stop placement. Two multiplier values (example, 1 and 3) can be set to create a filled area below the price. This area represents the range between the two ATR levels, adjusted by subtracting the current price, providing a simple way to visualize stop-loss placement based on volatility.
The indicator is customizable; for example, negative values can place the area above the price for short positions. The filled color can also be removed, which allows precise levels to be marked above and below.