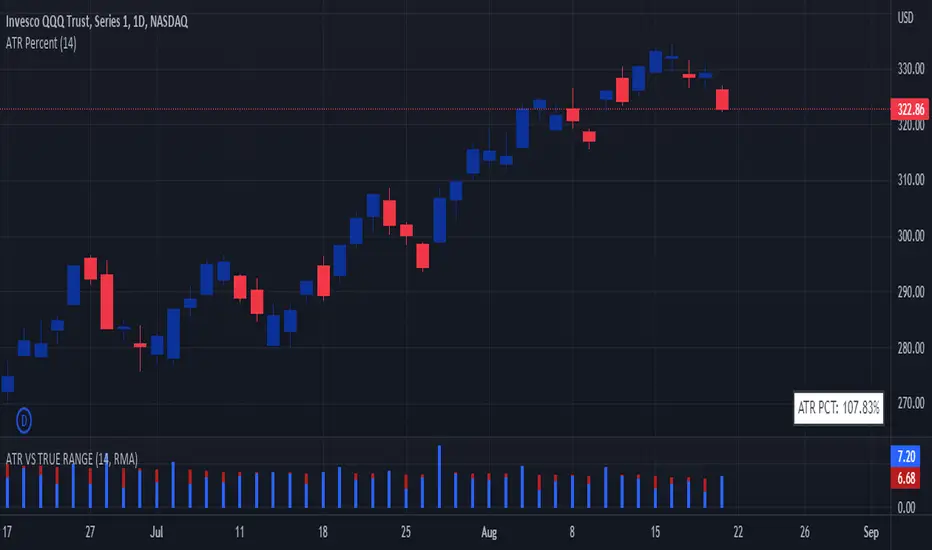
ATR VS TRUE RANGEDisplays ATR and True Range on the same panel.
Adjust the input and style settings to your liking.
Truerange

ATR PercentDisplays daily percentage on the bottom right corner of chart.
Formula:
True Range / ATR * 100
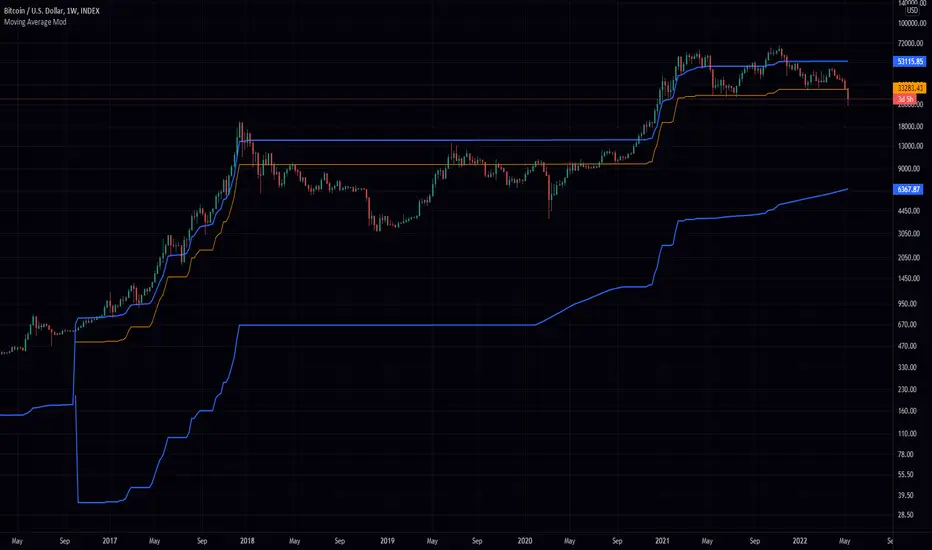
Greedy MA & Greedy Bollinger Bands This moving average takes all of the moving averages between 1 and 700 and takes the average of them all. It also takes the min/max average (donchian) of every one of those averages. Also included is Bollinger Bands calculated in the same way. One nice feature I have added is the option to use geometric calculations for. I also added regular bb calculations because this can be a major hog. Use this default setting on 1d or 1w. Enjoy!
ps, I call it greedy because the default settings wont work on lower time frames
[MACLEN] TRUE RANGEThis is a true range (TR) based strategy with weighted moving average (WMA) smoothing to remove noise.
In addition, it includes a risk management strategy using 4 "safes" in the same operation to always seek to make a profit.
This is for evaluation only, and it is not recommended to use with real money.
It is a work in progress. I read your comments.

Volatility ChannelThis script is based on an idea I have had for bands that react better to crypto volatility. It calculates a Donchian Channel, SMMA-Smoothed True Range, Bollinger Bands (standard deviation), and a Keltner Channel (average true range) and averages the components to construct its bands/envelopes. This way, hopefully band touches are a more reliable indicator of a temporary bottom, and so on. Secondary coloring for strength of trend is given as a gradient based on RSI.

ATR TREXTry to visualize TREX method.
-4 types of candle based on TR :
1. Spinning ( Candle < 0.8*ATR )
2. Standard ( 0.8*ATR < Candle < 1.2*ATR )
3. Long bar ( 1.2*ATR < Candle < 2.5*ATR )
4. Spike ( 2.5*ATR < Candle )
ATR length is different base on FRACTAL timeframes.
you can now find what is type of candle as colored ATR.
-Time frames :
1 Min
5 Min
15 Min
1 Hour
4 Hour
1 Day
1 Week
1 Month
I am working on TREX method and this indicator will change and improve . (V1.0)
Br
Amin
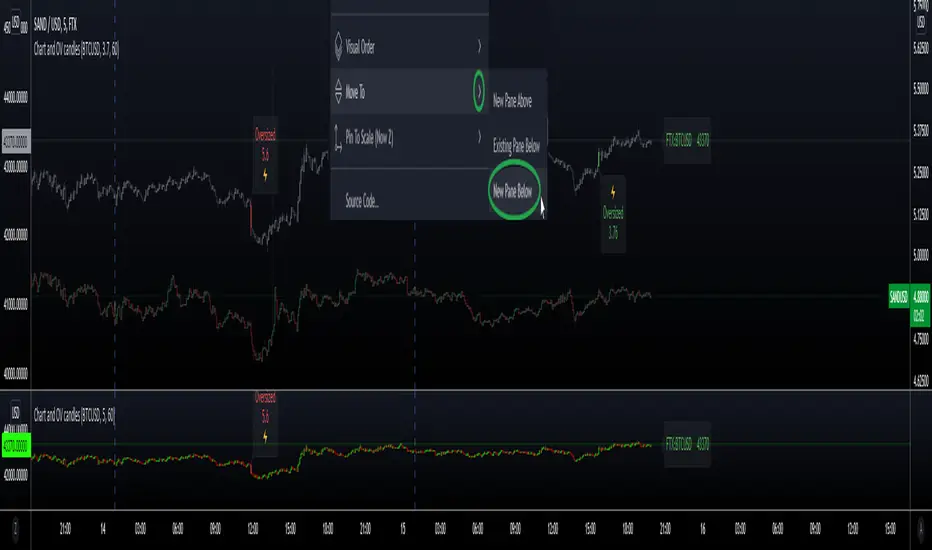
Secondary Chart with OverSized CandlesHi everyone, I'm sharing a simple script I made for a friend. He was looking for a way to add another asset to his chart, and monitor relevant movements \ spot eventual correlation, especially when trading Cryptocurrencies.
We couldn't find a similar script already available so here it is - the code is commented and I hope it's clear enough :)
Notes:
- The parameter scale = scale.left keeps the scales separated and therefore the chart is more organized, otherwise the chart would appear flat if the price difference is too big (e.g. BTC vs XRP)
- It is possible to have the script running in a separate panel (instead of overlay) by moving it to a new pane (when added to the chart) or by removing the parameter overlay = true at the beginning of the code.
- In case you wish to add indicators to this sub-chart (e.g. Bollinger Bands, EMA, etc..) you can do that by adding the relevant code and feed it with the variables OPEN \ HIGH \ LOW \ CLOSE as well as using the same method to retrieve new variables from the target asset with the request.security function.
Hope this comes handy.
Val - Protervus
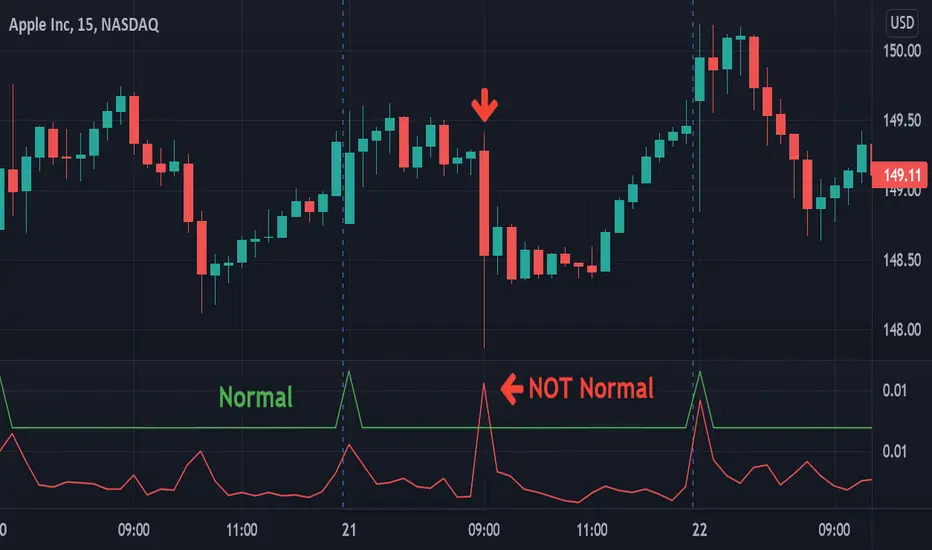
VolatilityLibrary "Volatility"
Functions for determining if volatility (true range) is within or exceeds normal.
The "True Range" (ta.tr) is used for measuring volatility.
Values are normalized by the volume adjusted weighted moving average (VAWMA) to be more like percent moves than price.
current(len) Returns the current price adjusted volatitlity ratio.
Parameters:
len : Number of bars to get a volume adjusted weighted average price.
normal(len, maxDeviation, level, gapDays, spec, res) Returns the normal upper range of volatility. Compensates for overnight gaps within a regular session.
Parameters:
len : Number of bars to measure volatility.
maxDeviation : The limit of volatility before considered an outlier.
level : The amount of standard deviation after cleaning outliers to be considered within normal.
gapDays : The number of days in the past to measure overnight gap volaility.
spec : session.regular (default), session.extended or other time spec.
res : The resolution (default = '1440').
isNormal(len, maxDeviation, level, gapDays, spec, res) Returns true if the volatility (true range) is within normal levels. Compensates for overnight gaps within a regular session.
Parameters:
len : Number of bars to measure volatility.
maxDeviation : The limit of volatility before considered an outlier.
level : The amount of standard deviation after cleaning outliers to be considered within normal.
gapDays : The number of days in the past to measure overnight gap volaility.
spec : session.regular (default), session.extended or other time spec.
res : The resolution (default = '1440').
severity(len, maxDeviation, level, gapDays, spec, res) Returns ratio of the current value to the normal value. Compensates for overnight gaps within a regular session.
Parameters:
len : Number of bars to measure volatility.
maxDeviation : The limit of volatility before considered an outlier.
level : The amount of standard deviation after cleaning outliers to be considered within normal.
gapDays : The number of days in the past to measure overnight gap volaility.
spec : session.regular (default), session.extended or other time spec.
res : The resolution (default = '1440').
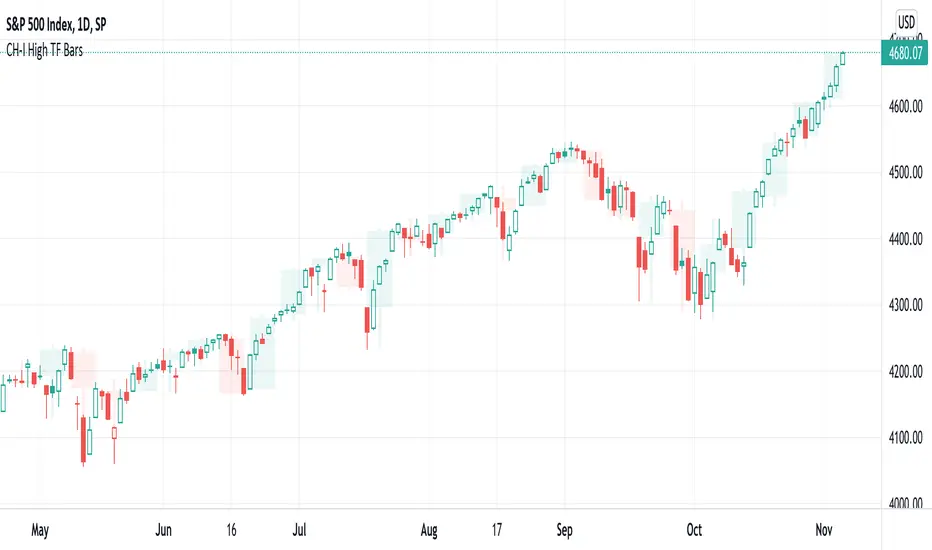
CH-I: Trend - Higher Timeframe BodyI took the script for the built-in indicator for candle bodies of a higher timeframe (www.tradingview.com) which has a fixed border width and style and added the possibility to customize both the border width and the border style or to even disable the display of any border at all, which makes the presentation of those boxes more flexible.
Rosebud Trend Backtest [DepthHouse]*Past Performance Does Not Guarantee Future Results*
*Strategy created for backtesting purposes only.
*Backtesting assesses the viability of a trading strategy or pricing model by discovering how it would have played out retrospectively using historical data.
* Please be sure to read all updates below as the information below could change with future updates.
Rosebud Trend Indicator uses complex range calculations to easily detect trend changes, critical support and resistance levels, and even aid in spotting reversals. The Critical Support & Resistance Zones are plotted via the red and green cloud. This cloud not only visually displays the expected trend direction but often acts as major support and resistance zones. The outer band measures the expected range in which the assets trade over longer periods of time.
The Rosebud Trend Backtest combines the calculations of the ATR Auto Oscillator & the Rosebud Trend Indicator to demonstrate backtest performance.
// Settings //
Users can switch the ‘ Trend Sensitivity ’ between ‘ Low ', ' Med ', and ‘ High ’ to increase or decrease the rate at which the cloud changes.
By altering the S/R Band Thickness users can furthermore increase or decrease the rate at which a trend changes by altering the thickness of the cloud. Default is .50 however this can be lowered if needed.
Bar colors are generated by a combination of Rosebuds primary function and our ATR AUTO Oscillator base functions. Users have 3 bar color options to select from: Simple, Complex, and Off.
Simple: Bars colors alternate between shades of red and green based on the trend direction and the ATR Auto strength. The stronger the shade, the stronger the trend.
Complex: This adds a few extra variables to the script which generates a more complex bar color display. Using this option, Rosebud will generate light red bars in a bull trend if downward movement is strong and vice versa in a bear trend. It also will generate a purple bar if the candle successfully closes above or below the Top & Bottom Range Bands; We call this a range break, and it could be an early sign of strong upward or downward movement.
Off: In case you like to keep things even simpler, this option hides all overlay bar colors.
ATR Options: Used for Light & Strong Entries/Exits // Bar Colors also based on these settings
ATR Smoothed Signal Option: Turns advance smoothing on or off. On will reduce signal noise, while Off could land you that perfect bottom signal with a lower success rate.
ATR Candlestick Length: Default factor for bar color and shape generation, the higher the number the fewer signals that will generate.
ATR Candlestick Smoothing: Default smoothing for the Candlestick Length
Signal Lookback: Adjust the factor at which Bull, Bear, Up, and Down. Lower this to 2 for more signals.
// ⇅ BackTest Settings ⇅ //
Short Trading: Option to see backtest results for both long and short positions. Default is Long Only.
Strategy Entry Options:
Trend Only: Positions are entered right as there is a cloud trend change.
Light Entry: This enters a trade as soon as there is a breakout or breakdown signal generated from the ATR settings.
Strong Entry: Multiple conditions must be met; Price action must be near the Trend Base and must receive either a bullish or bearish crossover in the oversold or overbought range of the ATR Settings.
Strategy Exit Options:
Trend Only: Exits all positions after there is a primary trend change.
Light Exit: Exits a user set percentage of open positions when the ATR generates a breakdown or breakout. Will continue to do this at each occurrence. Presets are built in to keep these from triggering too often in volatile conditions.
Strong Exit: Exits a user set percentage of open positions when the ATR generates a bullish or bearish crossover in the overbought or oversold ranges. Will continue to do this with each occurrence. Presets are built in to keep these from triggering too often in volatile conditions.
Profit Points: Exits a set percentage of the position up to 3 times at a user set percentage gap from the entry. Any remaining amount in the position exits upon a trend change.
Profit QTY Percent: Percent of the position to exit when an exit condition triggers. This does not apply to the “Trend Only” exit option.
Profit Percent Gap: Percent gap for Profit Point Exits. Recommend adjusting based on timeframe. See example below.

One For All - Overextended Price ChannelIntroduction :
Channels are very useful tools to assess overextended price, volatility and upcoming retracement or impulsive moves (such as Bollinger Band squeezes). It is an indispensable addition to any trader using Mean Reversion theory for a scalp-trade or swing-trade.
This script contains :
- 2 channels Keltner-style, usingthe True Range for volatility
- a fully customizable volatility (channel width) and smoothing period (up to the ALMA parameters)
- both channel separately configurable , i.e. having a different volatility setting or smoothing method for each
- a useful selection of smoothing methods) to be used instead of the standard SMA or EMA, such as ALMA or Hull
- an embedded readjustment of the lower bands to avoid the drop on a logarithmic scale (see explanation below)
- a double layered channels with a gradient color to help dollar cost averaging in and out of positions
Why another channel indicator ?
I have found most conventional channels to be either not based on "proper" volatility (e.g. standard deviation of price action for Bollinger Band), or the bottom channel to be ill adapted to the logarithmic scale and plunges to 0 on some high volatility periods, messing with readability on logarithmic auto-scaled chart.
Also, I find the channels to be most useful when superimposed with another one of longer length; especially a pair of channels with a 50 and 200 period moving average respectively. Mean Reversion traders that mostly trade the 50 and 200 SMA/EMA know what I am talking about as having a channel helps to have a better visual for a proper of entry and exit point.
Lastly, wondering why traders mostly use the SMA/EMA for the channel center, historic reason, personal preference, stubborn beliefs...? Well you will find that using other smoothing method such as the ALMA or Hull shows very interesting restults that seem -I dare say- more accurate, this option is provided in this script (some screen shot below speak for themselves).
Disclaimer :
This indicator was originally intended to be used along with the Trend Insight System to improve performance, and the default configuration mostly backtested on BTCUSD.
Please use with caution, proper risk management and along with your favorite oscillator, candlestick reading and signals system.
Some explanation :
Based on Mean Reversion paradigm, everything has a tendency to revert back to the mean :
- when the price enters the upper channel, it is supposed to be (or start getting) overbought as the market is getting overheated, thus prone to correction,
- on the other hand, when the price enters the lower channel, it is supposed to be (or getting) oversold and the market looks favorable for a buy-in.
Depending on the trading style used, a trader will usually either wait until the price leaves the channel towards the mean before taking action (conservative style) or you will set limit orders inside the channel as you expect a reversion to the mean (more agressive/risky style).
With two channels, more complex (and maybe precise) rules can be built to optimize one's trading strategy, especially adjusting the volatility multiplier inputs for each channel. Using different smoothing method for each is interesting to play with (especially Hull for the 50 and maybe VWMA for the 200) but not keenly advised unless you know what you are doing.
An example using the conventional Volume Weighted Keltner-like channel :
A more interesting channel using the most recent ALMA smoothing method :
Another variant using the Hull smoothing method to better see squeezes and overextensions :
This last screenshot shows the reason why it was originally intended to be used along with the Verbatim of the Trend Insigth System :
Important notes :
While this version is fun to use thanks to a very customizable side, you might get into the neverending maze of trying tofind an optimal setting for volatility and smoothing length to adapt to each and every market you are trading. Hence, be wary of overoptimization which is risky at best and counter productive at worst (according to legendary traders such as Mark Douglas).
In the end, sticking with 50/200 length and a single setting on volatility might be wiser. Even if, needless to say, the volatility needs to be adjusted between a nascent and volatile market (such as crypto) compared to standard call markets that are much less volatile.
End notes :
It will always be considered a work in progress to help bring out the best of trading with channels, any comment and suggestion are welcomed.

Dual Mean Reversion Channel (adjusted lower band)This is a public and open-source lighter version compared to the "Overextended Price Channel" which is provided complimentaty to the Trend Insight System.
Introduction :
Channels are very useful tools to assess overextended price, volatility and upcoming retracement or impulsive moves (such as Bollinger Band squeezes). It is an indispensable addition to any trader using Mean Reversion theory for a scalp-trade or swing-trade.
This script contains :
- 2 channels Keltner-style, using the True Range for volatility
- customizable volatility (channel width) and smoothing period
- a standard selection of moving average ; SMA, EMA, VWMA
- an embedded readjustment of the lower bands to avoid the drop on a logarithmic scale (see explanation below)
Why another channel indicator ?
I have found most conventional channels to be either not based on "proper" volatility (e.g. standard deviation of price action for Bollinger Band), or the bottom channel to be ill adapted to the logarithmic scale and plunges to 0 on some high volatility periods, messing with readability on logarithmic auto-scaled chart.
Also, I find the channels to be most useful when superimposed with another one of longer length; especially a pair of channels with a 50 and 200 period moving average respectively. Mean Reversion traders that mostly trade the 50 and 200 SMA/EMA know what I am talking about as having a channel helps to have a better visual for a proper of entry and exit point.
Disclaimer :
This indicator was originally intended to be used along with the Trend Insight System to improve performance, and the default configuration mostly backtested on BTCUSD.
Please use with caution, proper risk management and along with your favorite oscillator, candlestick reading and signals system.
Some explanation :
Based on Mean Reversion paradigm, everything has a tendency to revert back to the mean :
- when the price enters the upper channel, it is supposed to be (or start getting) overbought as the market is getting overheated, thus prone to correction,
- on the other hand, when the price enters the lower channel, it is supposed to be (or getting) oversold and the market looks favorable for a buy-in.
Depending on the trading style used, a trader will usually either wait until the price leaves the channel towards the mean before taking action (conservative style) or you will set limit orders inside the channel as you expect a reversion to the mean (more agressive/risky style).
With two channels, more complex (and maybe precise) rules can be built to optimize one's trading strategy.
Important notes :
In the end, sticking with 50/200 length and a single setting on volatility might be wiser, be wary of overoptimization which is risky at best and counter productive at worst (according to legendary traders such as Mark Douglas). Even if, needless to say, the volatility needs to be adjusted between a nascent and volatile market (such as crypto) compared to standard call markets that are much less volatile.
End notes :
It will always be considered a work in progress to help bring out the best of trading with channels, any comment and suggestion are welcomed.

[kai]Futility RatioAn indicator that measures movement inefficiency
Inefficient movement, that is, the range market becomes a high number, the limit is reached at about 60 and a trend occurs
When the range breaks and a trend occurs, the inefficiency drops to about 40 and many trends end.
The full-scale trend goes down further and goes down to about 25, which is evaluated as an efficient movement, the limit is reached and the trend ends.
As for how to use this Inge, the direction of the trend needs to be considered in other ways.
Create a position when you reach 60
Position closed or contrarian at 40 or 25
I assume the usage
動きの非効率性を測定するインジケーターです
非効率な動きをするつまりレンジ相場は高い数字になって、60程度で限界が訪れてトレンドが発生します
レンジがブレイクしトレンドが発生すると40程度まで非効率性は下がりって多くのトレンドは終了します
本格的なトレンドはさらに下がっていって効率的な動きと評価される25程度まで下がって限界が訪れてトレンドが終了します
このインジの使い方はトレンドの方向は他の方法で考える必要がありますが
60まで上がったときにポジション作成
40又は25でポジションクローズ又は逆張り
という使い方を想定しています


True Range Breakout [racer8]TRB (True Range Breakout) plots the current TR (true range) as well as the previous TR high over n periods. If the current TR is greater than the previous TR high, then the TR histogram will become red. Red signals high volatility. Enter trades only when the histogram is above the TR high line. Happy trading! 🥳

Indicator: On Balance True RangeThis is original indicator by Thomas Bieravic from a book of "Trading Systems and Methods" (Wiley Trading) 6th Edition by Perry J. Kaufman.
The author was change volume on true range in formula and added signal line for analyze of volatility.
Enjoy it!

Cracking Cryptocurrency - Quadrigo Position SizingCracking Cryptocurrency - Quadrigo Position Sizing
This indicator is designed to work in conjunction with our position sizing calculations pursuant to the Quadrigo Indicator.
This indicator will allow a trader to input their Account Balance and desired Risk % that they have decided, through their statistical analysis, provides them the greatest Return on Equity balanced against minimal draw down.
Once inputted, the Data Window will display the recommended USD Position Size. It will also pull the current price of Bitcoin, so that a recommended BTC Position Size will be calculated as well, making orders very easy to enter on exchanges that deal in BTC values for order value.
This indicator is optimized for the aesthetics of traders using TradingView's mobile app. With a simple glance you can determine your proper position size for any trade. This is helpful because the larger Quadrigo indicator can take up a lot of screen real estate when on mobile version.

Cracking Cryptocurrency - QuadrigoCracking Cryptocurrency - Quadrigo
An objective method of determining an initial Take Profit and Stop Loss, based on true market volatility and not arbitrary price levels. This indicator gives the user a powerful range of input variation, from Average to Median True Range and a myriad permutations of smoothing and look back lengths, to build an objective value from which to measure profit and stop levels.
This indicator also automatically calculates a recommended position size based on our position sizing methodology. Simply input your capital amount and desired risk level. This indicator will display your optimum position size in USD or BTC, even giving you the flexibility to select your desired exchange for BTC/USD conversion calculations.
Features & Functions
Set custom multipliers for Take Profit and Stop Loss Levels.
Select between Average or Median True Range Calculations.
Select smoothing type and look back length for True Range.
Input custom True Range Level for dialing in precise measurements.
Position Size Calculator.
Aesthetically pleasing display of Take Profit and Stop Loss Levels.
Aesthetically pleasing dashboard display of all relevant trade information including Potential Loss, Distance to Stop Loss, and TR Percentage, among other data.
Indicator displays quantity of position to be removed at each take profit for convenient order setting flow.
---
Purpose
To give clear objective stop losses and take profit levels based off price volatility rather than arbitrary price levels, percentage points, ticks, pips, etc.

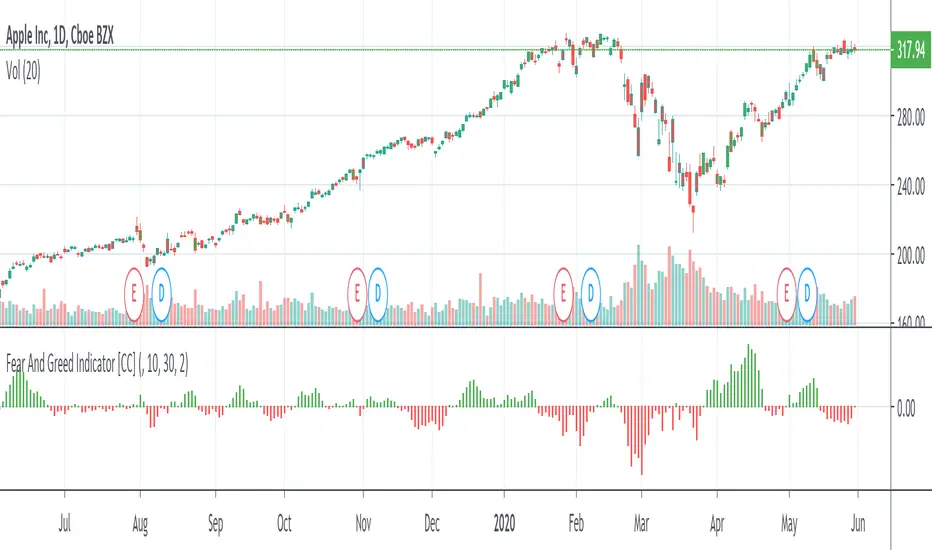
Fear And Greed IndicatorThe Fear And Greed Indicator is a very popular indicator on the Bloomberg platform and since I didn't have actual source code to work with, this is a very close approximation of that indicator. Let me know if you spot any discrepancies with the original and I will do my best to fix them.
For buy and sell signals it is pretty straightforward. Just buy when the green (greed) is in control and sell when the fear (red) is in control
This was a special request so let me know if you want to see more scripts from me or if you want something custom!
Uber ATR [UTS]Uber ATR is a customizable ATR indicator that measures volatility within a given time frame.
The indicator tells about how much price fluctuates but does not say anything about how much it actually moves into one direction. Use trend following indicators for that purpose.
Option: Exclude Unfinished Candle
Option to exclude the current unfinished candle from price calculation to ignore sudden spikes in price action.
Default caluclation based on candle close:
Exclude unclosed candle option:
Option: Display "Old" Values
Option to step back by candle and display old ATR values in a human readable fashion.
Option: Smoothing Types
NONE (Raw ATR value, no smoothing is applied)
ALMA (Arnaud Legoux Moving Average)
DEMA (Double Exponential Moving Average)
EMA (Exponential Moving Average)
FRAMA (Fractal Adaptive Moving Average)
HMA (Hull Moving Average)
JURIK (Jurik Moving Average)
KAMA (Kaufman Adaptive Moving Average)
Kijun (Kijun-sen / Tenkan-sen of Ichimoku)
LSMA (Least Square Moving Average)
RMA (Running Moving Average)
SMA (Simple Moving Average)
SuperSmoothed (Super Smoothed Moving Average)
TEMA (Triple Exponential Moving Average)
VWMA (Volume Weighted Moving Average)
WMA (Weighted Moving Average)
ZLEMA (Zero Lag Moving Average)

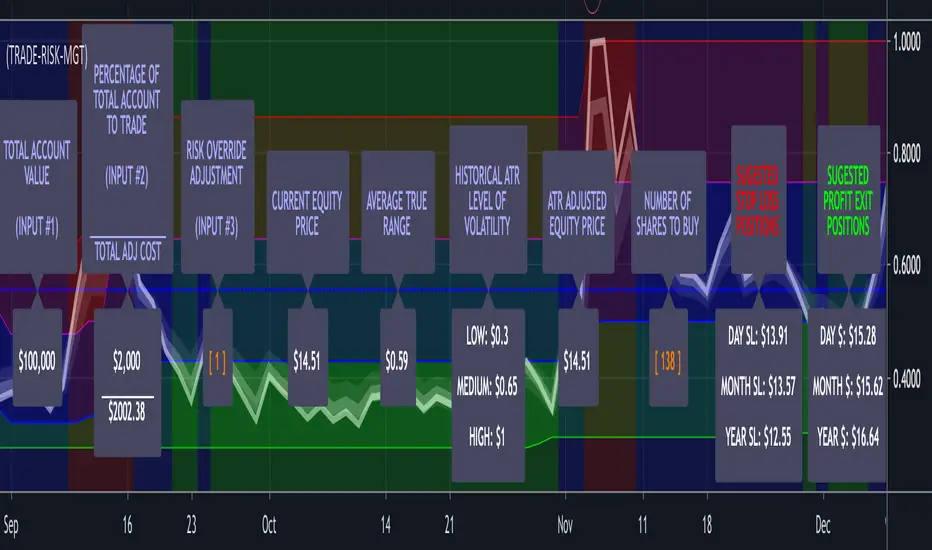
(17) Trade Risk Management VS-427)Trade Risk Management is an Average True Range (ATR) indicator and a Risk Management Worksheet combined. Think widget, spreadsheet or worksheet that calculates how much you should invest in any equity. This enables the trader to very quickly determine the level of volatility of any equity, allowing them to adjust their entry position size based on current and historical volatility . This is a simple and effective risk management tool. The trader only needs to enter the first three label values through the input/styles panel. Historical Volatility is determined via a 60 day/bar look-back for the highest high and the lowest low of the ATR. These two figures are utilized to stratify three background bands (Red = High Volatility; Blue = Median Volatility; and Green = Low Volatility.) The labels are then plotted on the center-line value representing the historical volatility of the equity in question. The label color represents the current volatility of the equity. This indicator is free to any subscriber of any Genie indicator package.
Enter the total value of all of your investments (stocks, cryptos, cash) in input #1 which will then be displayed in Label #1.
You enter the percentage of your account value you are willing to risk on any trade in input #2 which is then displayed in Label #2.
Input #3 allows you to override the built-in risk evaluation based on ATR. Label #3.
Label #4 shows the current equity trading price.
Label #5 shows the current ATR of the equity.
Label #6 shows three levels of historical volatility reflected in the three bands (RED, BLUE, GREEN) shown on the chart.
Label #7 shows the adjusted equity price based on current ATR. If the current ATR is High; Top Red Band, the amount is increased by the (ATR * Risk Factor) Adjustment. Because this increases you're calculated cost basis the number of shares you are indicated to buy is decreased, reducing your exposure to risk in a high volatility/risk environment. If the ATR is Low: Bottom Green Band, the amount is decreased by the (ATR * Risk Factor) Adjustment. Because this decreases your calculated cost basis the number of shares you are indicated to buy is increased because you are in a low volatility/risk environment. If the ATR is neutral: Middle Blue Band, the actual equity cost is utilized and no risk weighting based on ATR is incorporated.
Label #8 shows the resulting change in the price that the risk weighting calculation above had on current price.
Label #9 indicates the recommended number of Risk-Managed-Shares the trader should purchase.
Label #10 indicates the suggested Stop Loss levels and Label #11 shows the suggested Profit Exits Levels.
To further emphasize that the Labels are the Indicator, they get plotted on a line that plots at the center of the current volatility level. If you bring up this indicator and run through one of your trading symbol list, it will enable you to immediately determine exactly what the level of current and historical volatility each of the equities in your list is experiencing.
Additionally, the color of the text on all of the descriptive labels plotted above the center line change color based on the current level of volatility.
Access this Genie indicator for your Tradingview account, through our web site. (Links Below) This will provide you with additional educational information and reference articles, videos, input and setting options and trading strategies this indicator excels in.
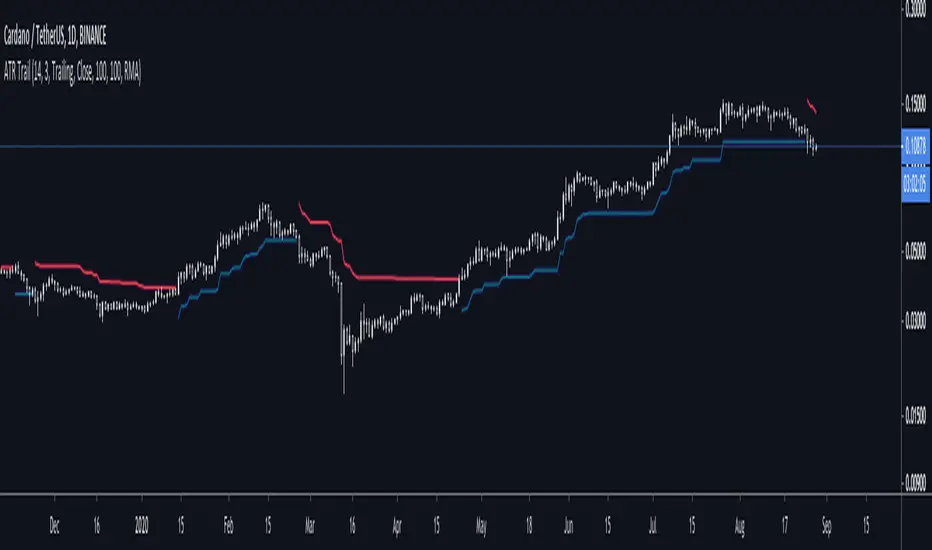
ATR + Trailing StopsSimple visualisation of Average True Range in Pinescript V4.
The script has two modes: Running and Trailing.
In Running mode, it continuously displays the ATR above and below the price. Specifically, it displays the High and Low price plus and minus the ATR times a user-supplied multiplier. This can be helpful for visualising volatility.
In Trailing mode, it displays the same ATR line, except the line trails until price crosses it. When price crosses it, it flips from long to short or vice-versa.
You could use trailing ATR as a stop loss. Adjust the multiplier and lookback period for your asset and preference.