Standardized Orderflow [AlgoAlpha]Introducing the Standardized Orderflow indicator by AlgoAlpha. This innovative tool is designed to enhance your trading strategy by providing a detailed analysis of order flow and velocity. Perfect for traders who seek a deeper insight into market dynamics, it's packed with features that cater to various trading styles. 🚀📊
Key Features:
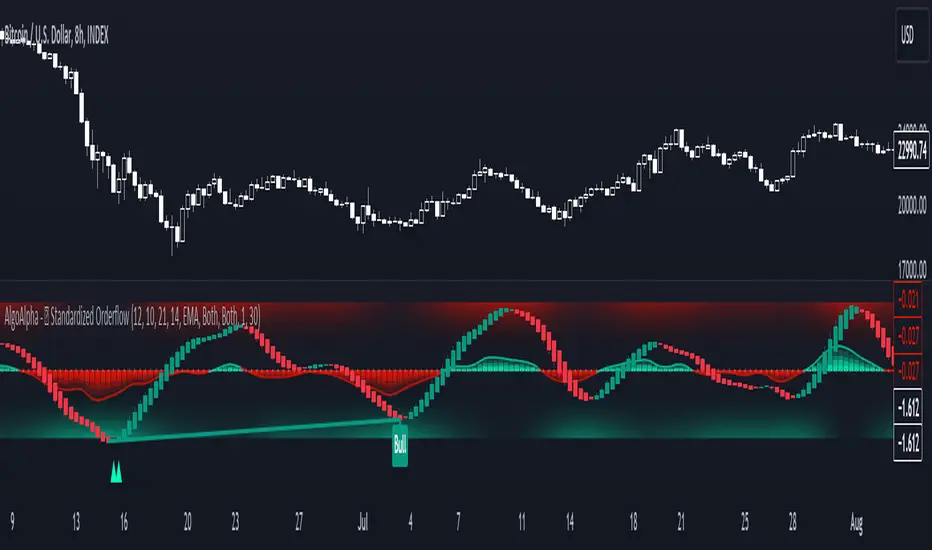
📈 Order Flow Analysis: At its core, the indicator analyzes order flow, distinguishing between bullish and bearish volume within a specified period. It uses a unique standard deviation calculation for normalization, offering a clear view of market sentiment.
🔄 Smoothing Options: Users can opt for a smoothed representation of order flow, using a Hull Moving Average (HMA) for a more refined analysis.
🌪️ Velocity Tracking: The indicator tracks the velocity of order flow changes, providing insights into the market's momentum.
🎨 Customizable Display: Tailor the display mode to focus on either order flow, order velocity, or both, depending on your analysis needs.
🔔 Alerts for Critical Events: Set up alerts for crucial market events like crossover/crossunder of the zero line and overbought/oversold conditions.
How to Use:
1. Setup: Easily configure the indicator to match your trading strategy with customizable input parameters such as order flow period, smoothing length, and moving average types.
2. Interpretation: Watch for bullish and bearish columns in the order flow chart, utilize the Heiken Ashi RSI candle calculation, and look our for reversal notations for additional market insights.
3. Alerts: Stay informed with real-time alerts for key market events.
Code Explanation:
- Order Flow Calculation:
The core of the indicator is the calculation of order flow, which is the sum of volumes for bullish or bearish price movements. This is followed by normalization using standard deviation.
orderFlow = math.sum(close > close ? volume : (close < close ? -volume : 0), orderFlowWindow)
orderFlow := useSmoothing ? ta.hma(orderFlow, smoothingLength) : orderFlow
stdDev = ta.stdev(orderFlow, 45) * 1
normalizedOrderFlow = orderFlow/(stdDev + stdDev)
- Velocity Calculation:
The velocity of order flow changes is calculated using moving averages, providing a dynamic view of market momentum.
velocityDiff = ma((normalizedOrderFlow - ma(normalizedOrderFlow, velocitySignalLength, maTypeInput)) * 10, velocityCalcLength, maTypeInput)
- Display Options:
Users can choose their preferred display mode, focusing on either order flow, order velocity, or both.
orderFlowDisplayCond = displayMode != "Order Velocity" ? display.all : display.none
wideDisplayCond = displayMode != "Order Flow" ? display.all : display.none
- Reversal Indicators and Divergences:
The indicator also includes plots for potential bullish and bearish reversals, as well as regular and hidden divergences, adding depth to your market analysis.
bullishReversalCond = reversalType == "Order Flow" ? ta.crossover(normalizedOrderFlow, -1.5) : (reversalType == "Order Velocity" ? ta.crossover(velocityDiff, -4) : (ta.crossover(velocityDiff, -4) or ta.crossover(normalizedOrderFlow, -1.5)) )
bearishReversalCond = reversalType == "Order Flow" ? ta.crossunder(normalizedOrderFlow, 1.5) : (reversalType == "Order Velocity" ? ta.crossunder(velocityDiff, 4) : (ta.crossunder(velocityDiff, 4) or ta.crossunder(normalizedOrderFlow, 1.5)) )
In summary, the Standardized Orderflow indicator by AlgoAlpha is a versatile tool for traders aiming to enhance their market analysis. Whether you're focused on short-term momentum or long-term trends, this indicator provides valuable insights into market dynamics. 🌟📉📈
Indicador Pine Script®