Swing Failure Pattern SFP [TradingFinder] SFP ICT Strategy🔵 Introduction
The Swing Failure Pattern (SFP), also referred to as a "Fake Breakout" or "False Breakout," is a vital concept in technical analysis. This pattern is derived from classic technical analysis, price action strategies, ICT concepts, and Smart Money Concepts.
It’s frequently utilized by traders to identify potential trend reversals in financial markets, especially in volatile markets like cryptocurrencies and forex. SFP helps traders recognize failed attempts to breach key support or resistance levels, providing strategic opportunities for trades.
The Swing Failure Pattern (SFP) is a popular strategy among traders used to identify false breakouts and potential trend reversals in the market. This strategy involves spotting moments where the price attempts to break above or below a previous high or low (breakout) but fails to sustain the move, leading to a sharp reversal.
Traders use this strategy to identify liquidity zones where stop orders (stop hunt) are typically placed and targeted by larger market participants or whales.
When the price penetrates these areas but fails to hold the levels, a liquidity sweep occurs, signaling exhaustion in the trend and a potential reversal. This strategy allows traders to enter the market at the right time and capitalize on opportunities created by false breakouts.
🟣 Types of SFP
When analyzing SFPs, two main variations are essential :
Real SFP : This occurs when the price breaks a critical level but fails to close above it, then quickly reverses. Due to its clarity and strong signal, this SFP type is highly reliable for traders.
Considerable SFP : In this scenario, the price closes slightly above a key level but quickly declines. Although significant, it is not as definitive or trustworthy as a Real SFP.
🟣 Understanding SFP
The Swing Failure Pattern, or False Breakout, is identified when the price momentarily breaks a crucial support or resistance level but cannot maintain the movement, leading to a rapid reversal.
The pattern can be categorized as follows :
Bullish SFP : This type occurs when the price dips below a support level but rebounds above it, signaling that sellers failed to push the price lower, indicating a potential upward trend.
Bearish SFP : This pattern forms when the price surpasses a resistance level but fails to hold, suggesting that buyers couldn’t maintain the higher price, leading to a potential decline.
🔵 How to Use
To effectively identify an SFP or Fake Breakout on a price chart, traders should follow these steps :
Identify Key Levels: Locate significant support or resistance levels on the chart.
Observe the Fake Breakout: The price should break the identified level but fail to close beyond it.
Monitor Price Reversal: After the breakout, the price should quickly reverse direction.
Execute the Trade: Traders typically enter the market after confirming the SFP.
🟣 Examples
Bullish Example : Bitcoin breaks below a $30,000 support level, drops to $29,000, but closes above $30,000 by the end of the day, signaling a Real Bullish SFP.
Bearish Example : Ethereum surpasses a $2,000 resistance level, rises to $2,100, but then falls back below $2,000, forming a Bearish SFP.
🟣 Pros and Cons of SFP
Pros :
Effective in identifying strong reversal points.
Offers a favorable risk-to-reward ratio.
Applicable across different timeframes.
Cons :
Requires experience and deep market understanding.
Risk of encountering false breakouts.
Should be combined with other technical tools for optimal effectiveness.
🔵 Settings
🟣 Logical settings
Swing period : You can set the swing detection period.
SFP Type : Choose between "All", "Real" and "Considerable" modes to identify the swing failure pattern.
Max Swing Back Method : It is in two modes "All" and "Custom". If it is in "All" mode, it will check all swings, and if it is in "Custom" mode, it will check the swings to the extent you determine.
Max Swing Back : You can set the number of swings that will go back for checking.
🟣 Display settings
Displaying or not displaying swings and setting the color of labels and lines.
🟣 Alert Settings
Alert SFP : Enables alerts for Swing Failure Pattern.
Message Frequency : Determines the frequency of alerts. Options include 'All' (every function call), 'Once Per Bar' (first call within the bar), and 'Once Per Bar Close' (final script execution of the real-time bar). Default is 'Once per Bar'.
Show Alert Time by Time Zone : Configures the time zone for alert messages. Default is 'UTC'.
🔵 Conclusion
The Swing Failure Pattern (SFP), or False Breakout, is an essential analytical tool that assists traders in identifying key market reversal points for successful trading.
By understanding the nuances between Real SFP and Considerable SFP, and integrating this pattern with other technical analysis tools, traders can make more informed decisions and better manage their trading risks.
Swing

Bat Harmonic Pattern [TradingFinder] Bat Chart Indicator🔵 Introduction
The Bat Harmonic Pattern, created by Scott Carney in the 1990s, is a sophisticated tool in technical analysis, used to identify potential reversal points in price movements by leveraging Fibonacci ratios.
This pattern is classified into two primary types: the Bullish Bat Pattern, which signals the end of a downtrend and the beginning of an uptrend, and the Bearish Bat Pattern, which indicates the conclusion of an uptrend and the onset of a downtrend.
🟣 Bullish Bat Pattern
The Bullish Bat Pattern is designed to identify when a downtrend is likely to end and a new uptrend is about to begin. The key feature of this pattern is Point D, which typically aligns near the 88.6% Fibonacci retracement of the XA leg.
This point is considered a strong buy zone. When the price reaches Point D after a significant downtrend, it often indicates a potential reversal, presenting a buying opportunity for traders anticipating the start of an upward movement.
🟣 Bearish Bat Pattern
In contrast, the Bearish Bat Pattern forms when an uptrend is nearing its conclusion. Point D, which also typically aligns near the 88.6% Fibonacci retracement of the XA leg, serves as a critical point for traders.
This point is regarded as a strong sell zone, signaling that the uptrend may be ending, and a downtrend could be imminent. Traders often open short positions when they identify this pattern, aiming to capitalize on the anticipated downward movement.
🔵 How to Use
The Bat Pattern consists of five key points: X, A, B, C, and D, and four waves: XA, AB, BC, and CD. Fibonacci ratios play a crucial role in this pattern, helping traders pinpoint precise entry and exit points. In both the Bullish and Bearish Bat Patterns, the 88.6% retracement of the XA leg is a critical level for identifying potential reversal points.
🟣 Bullish Bat Pattern
Traders typically enter buy positions after Point D forms, expecting the downtrend to end and a new uptrend to start. This point, located near the 88.6% retracement of the XA leg, serves as a reliable buy signal.
🟣 Bearish Bat Pattern
Traders usually open short positions after identifying Point D, expecting the uptrend to end and a downtrend to begin. This point, also near the 88.6% retracement of the XA leg, acts as a valid sell signal.
🟣 Trading Tips for the Bat Pattern
Accurate Fibonacci Point Identification : Accurately identify Points X, A, B, C, and D, and calculate the Fibonacci ratios between these points. Point D should ideally be near the 88.6% retracement of the XA leg.
Signal Confirmation with Other Tools : To enhance the pattern's accuracy, avoid trading solely based on the Bat Pattern.
Risk Management : Always use stop-loss orders. In a Bullish Bat Pattern, place the stop-loss below Point X, and in a Bearish Bat Pattern, above Point X. This helps limit potential losses if the pattern fails.
Wait for Price Movement Confirmation : After identifying Point D, wait for the price to move in the anticipated direction to confirm the pattern's validity before entering a trade.
Set Realistic Profit Targets : Use Fibonacci retracement levels to set realistic profit targets, such as 38.2%, 50%, and 61.8% retracement levels of the CD leg. This strategy helps maximize profits and prevents premature exits.
🔵 Setting
🟣 Logical Setting
ZigZag Pivot Period : You can adjust the period so that the harmonic patterns are adjusted according to the pivot period you want. This factor is the most important parameter in pattern recognition.
Show Valid Forma t: If this parameter is on "On" mode, only patterns will be displayed that they have exact format and no noise can be seen in them. If "Off" is, the patterns displayed that maybe are noisy and do not exactly correspond to the original pattern.
Show Formation Last Pivot Confirm : if Turned on, you can see this ability of patterns when their last pivot is formed. If this feature is off, it will see the patterns as soon as they are formed. The advantage of this option being clear is less formation of fielded patterns, and it is accompanied by the latest pattern seeing and a sharp reduction in reward to risk.
Period of Formation Last Pivot : Using this parameter you can determine that the last pivot is based on Pivot period.
🟣 Genaral Setting
Show : Enter "On" to display the template and "Off" to not display the template.
Color : Enter the desired color to draw the pattern in this parameter.
LineWidth : You can enter the number 1 or numbers higher than one to adjust the thickness of the drawing lines. This number must be an integer and increases with increasing thickness.
LabelSize : You can adjust the size of the labels by using the "size.auto", "size.tiny", "size.smal", "size.normal", "size.large" or "size.huge" entries.
🟣 Alert Setting
Alert : On / Off
Message Frequency : This string parameter defines the announcement frequency. Choices include: "All" (activates the alert every time the function is called), "Once Per Bar" (activates the alert only on the first call within the bar), and "Once Per Bar Close" (the alert is activated only by a call at the last script execution of the real-time bar upon closing). The default setting is "Once per Bar".
Show Alert Time by Time Zone : The date, hour, and minute you receive in alert messages can be based on any time zone you choose. For example, if you want New York time, you should enter "UTC-4". This input is set to the time zone "UTC" by default.
🔵 Conclusion
The Bat Harmonic Pattern is a powerful tool in technical analysis, offering traders the ability to identify critical reversal points using Fibonacci ratios. By recognizing the Bullish and Bearish Bat Patterns, traders can anticipate potential trend reversals and make informed trading decisions.
However, it is essential to combine the Bat Pattern with other technical analysis tools and confirm signals for better trading outcomes. With proper use, this pattern can help traders minimize risk and optimize their entry and exit points in the market.

Shark Harmonic Pattern [TradingFinder] Shark Detector Indicator🔵 Introduction
The Shark harmonic pattern, first introduced by Scott Carney in 2011, is a recognized tool in technical analysis. Since its inception, it has been widely adopted by traders as an essential market analysis tool.
Due to its complexity, the Shark pattern can be challenging for novice traders. Therefore, we have developed the Harmonic Pattern Indicator to help analysts and traders easily identify these patterns.
🟣 Understanding the Types of Shark Pattern
In technical analysis, the Shark harmonic pattern forms at the end of trends and is categorized into two types: Bullish and Bearish Shark Patterns.
Bullish Shark Pattern : This pattern appears at the end of a downtrend, indicating a potential reversal to an uptrend. Traders can use this pattern to identify buy entry points. The image below illustrates the core components of the Bullish Shark Pattern.
Bearish Shark Pattern : Conversely, the Bearish Shark Pattern forms at the end of an uptrend, signaling a possible reversal to a downtrend. This pattern prompts traders to shift their positions from buying to selling. The image below showcases the characteristics of the Bearish Shark Pattern.
🔵 How to Use
🟣 Trading with the Bullish Shark Pattern
The Bullish Shark Pattern acts as a reversal pattern, helping traders identify the end of a downtrend and the beginning of an uptrend. It consists of five key points that indicate alternating bullish and bearish movements.
Upon the complete formation of this pattern, traders can look for opportunities to enter buy trades. To manage risk effectively, it is advisable to set a stop-loss below the lowest price point within the pattern.
🟣 Trading with the Bearish Shark Pattern
Similarly, the Bearish Shark Pattern functions as a reversal pattern but in the opposite direction. It helps traders identify the end of an uptrend and the onset of a downtrend.
After the pattern fully forms, traders can seek sell entry opportunities. As with the bullish pattern, placing a stop-loss above the highest price point within the pattern is recommended for risk management.
🔵 Setting
🟣 Logical Setting
ZigZag Pivot Period : You can adjust the period so that the harmonic patterns are adjusted according to the pivot period you want. This factor is the most important parameter in pattern recognition.
Show Valid Format : If this parameter is on "On" mode, only patterns will be displayed that they have exact format and no noise can be seen in them. If "Off" is, the patterns displayed that maybe are noisy and do not exactly correspond to the original pattern.
Show Formation Last Pivot Confirm : if Turned on, you can see this ability of patterns when their last pivot is formed. If this feature is off, it will see the patterns as soon as they are formed. The advantage of this option being clear is less formation of fielded patterns, and it is accompanied by the latest pattern seeing and a sharp reduction in reward to risk.
Period of Formation Last Pivot : Using this parameter you can determine that the last pivot is based on Pivot period.
🟣 Genaral Setting
Show : Enter "On" to display the template and "Off" to not display the template.
Color : Enter the desired color to draw the pattern in this parameter.
LineWidth : You can enter the number 1 or numbers higher than one to adjust the thickness of the drawing lines. This number must be an integer and increases with increasing thickness.
LabelSize : You can adjust the size of the labels by using the "size.auto", "size.tiny", "size.smal", "size.normal", "size.large" or "size.huge" entries.
🟣 Alert Setting
Alert : On / Off
Message Frequency : This string parameter defines the announcement frequency. Choices include: "All" (activates the alert every time the function is called), "Once Per Bar" (activates the alert only on the first call within the bar), and "Once Per Bar Close" (the alert is activated only by a call at the last script execution of the real-time bar upon closing). The default setting is "Once per Bar".
Show Alert Time by Time Zone : The date, hour, and minute you receive in alert messages can be based on any time zone you choose. For example, if you want New York time, you should enter "UTC-4". This input is set to the time zone "UTC" by default.
🔵 Conclusion
The Shark harmonic pattern is a potent analytical tool in technical analysis that aids traders in identifying critical reversal points in financial markets. Whether in a bullish or bearish context, this pattern provides clear trend change signals, allowing traders to enter trades with greater precision and optimize their strategies.
However, as with all analytical methods, it is essential to supplement the Shark pattern with additional analyses and strict risk management to avoid potential losses. Incorporating this pattern into a comprehensive trading strategy can lead to better trade outcomes and more opportunities for success

Pure Price Action Structures [LuxAlgo]The Pure Price Action Structures indicator is a pure price action analysis tool designed to automatically identify real-time market structures.
The indicator identifies short-term, intermediate-term, and long-term swing highs and lows, forming the foundation for real-time detection of shifts and breaks in market structure.
Its distinctive/unique feature lies in its reliance solely on price patterns, without being limited by any user-defined input, ensuring a robust and objective analysis of market dynamics.
🔶 USAGE
Market structure is a crucial aspect of understanding price action. The script automatically identifies real-time market structure, enabling traders to comprehend market trends more easily. It assists traders in recognizing both trend changes and continuations.
Market structures are constructed from three sets of swing points, short-term swings, intermediary swings, and long-term swings. Market structures associated with longer-term swing points are indicative of longer-term trends.
A market structure shift (MSS), also known as a change of character (CHoCH), is a significant event in price action analysis that may signal a potential shift in market sentiment or direction. Conversely, a break of structure (BOS) is another significant event in price action analysis that typically indicates a continuation of the prevailing trend.
However, it's important to note that while an MSS can be the first indication of a trend reversal and a BOS signifies a continuation of the prevailing trend, they do not guarantee a complete reversal or continuation of the trend.
In some cases, MSS and BOS levels may also act as liquidity zones or areas of price consolidation, rather than indicating a definitive change in market direction or continuation. Traders should approach them with caution and consider additional factors to confirm the validity of the signal before making trading decisions.
🔶 DETAILS
🔹 Market Structures
Market structures are based on the analysis of price action and aim to identify key levels and patterns in the market, where swing point detection is one of the core concepts within ICT trading methodologies and teachings.
Swing points are automatically detected solely based on market movements, without any reliance on user-defined input.
🔹 Utilizing Swing Points
Swing points are not identified in real time as they occur. While short-term swing points may be displayed with a delay of at most one bar, the identification of intermediate and long-term swing points depends entirely on market movements. Furthermore, detection is not limited by any user-defined input but relies solely on pure price action. Consequently, swing points are not typically utilized in real-time trading scenarios.
Traders often analyze historical swing points to discern market trends and pinpoint potential entry and exit points for their trades. By identifying swing highs and lows, traders can:
Recognize Trends: Swing highs and lows help traders identify the direction of the trend. Higher swing highs and higher swing lows indicate an uptrend, while lower swing highs and lower swing lows indicate a downtrend.
Identify Support and Resistance Levels: Swing highs often serve as resistance levels, known in ICT terminology as Buyside Liquidity Levels, while swing lows function as support levels, also referred to in ICT terminology as Sellside Liquidity Levels. Traders can utilize these levels to strategize entry and exit points for their trades.
Spot Reversal Patterns: Swing points can form various reversal patterns, such as double tops or bottoms, head and shoulders patterns, and triangles. Recognizing these patterns can signal potential trend reversals, allowing traders to adjust their strategies accordingly.
Set Stop Loss and Take Profit Levels: In the context of ICT teachings, swing levels represent specific price levels where a concentration of buy or sell orders is anticipated. Traders can target these liquidity levels/pools to accumulate or distribute their positions, essentially using swing points to establish stop loss and take profit levels for their trades.
Overall, swing points provide valuable information about market dynamics and can assist traders in making more informed trading decisions.
🔶 SETTINGS
🔹 Structures
Swings and Size: Toggles the visibility of the structure's highs and lows, assigns an icon corresponding to the structures, and controls the size of the icons.
Market Structures: Toggles the visibility of the market structures.
Market Structure Labels: Controls the visibility of labels that highlight the type of market structure.
Line Style and Width: Customizes the style and width of the lines representing the market structure.
Swing and Line Colors: Customizes colors for the icons representing highs and lows, and the lines and labels representing the market structure.
🔶 RELATED SCRIPTS
Market-Structures-(Intrabar).
Buyside-Sellside-Liquidity.

Breakouts with Tests & Retests [LuxAlgo]The Breakouts Tests & Retests indicator highlights tests and retests of levels constructed from detected swing points. A swing area of interest switches colors when a breakout occurs.
Users can control the sensitivity of the swing point detection and the width of the swing areas.
🔶 USAGE
When a Swing point is detected, an area of interest is drawn, colored green for a bullish swing and red when bearish.
A test is confirmed when the opening price is situated in the area of interest, and the closing price is above or below the area, depending on whether it is a bullish or bearish swing. Tests are highlighted with a solid-colored triangle.
A breakout is confirmed when the price closes in the opposite position, below or above the area, in which case the area will switch colors.
If the opening price is located within the area and the closing price closes outside the area, in the same direction as the breakout, this is considered a retest . Retests are highlighted with a hollow-colored triangle.
Note that tests/retests do not act on wicks. The main factor is that the opening price is in the area of interest, while the closing price is outside.
🔹 Area Of Interest Width
The user can adjust the width of the swing areas. Changing the " Width " is a fast and easy way to find different areas of interest.
A higher "Multiple" setting would return a wider area, allowing price to develop within it for a longer period of time and potentially provide later test signals.
When a swing area is broken, a higher "Width" setting can make it more complicated for the price to break it again, allowing a swing area to remain valid for a longer period of time thus potentially providing more retest signals.
🔶 DETAILS
Generally, only one bullish/bearish pattern can be active at a time. This means that no more than 1 bullish or bearish area will be active.
The " Display " settings, however, can help control how areas of different types are displayed.
Bullish AND Bearish: Both, bullish and bearish patterns can be drawn at the same time
Bullish OR Bearish: Only 1 bullish or 1 bearish pattern is drawn at a time
Bullish: Only bullish patterns
Bearish: Only bearish patterns
🔹 Test/Retest Labels
The user can adjust the settings so only the latest test/retest label is shown or set a minimum number of bars until the next test/retest can be drawn.
🔹 Maximum Bars
Users can set a limit of bars for when there is no test/retest in that period; the area of interest won't be updated anymore and will be available and ready for the next Swing.
An option for pulling the area back to the last retest is included.
🔶 SETTINGS
Display: Determines which swing areas are displayed by the indicator. See the "DETAILS" section for more information
Multiple: Adjusts the width of the areas of interest
Maximum Bars: Limit of bars for when there is no test/retest
Display Test/Retest Labels: Show all labels or just the last test/retest label associated with a swing area
Minimum Bars: Minimum bars required for a subsequent test/retest label are allowed to be displayed
Set Back To Last Retest: When after "Maximum Bars" no test/retest is found, place the right side of the area at the last test/retest
🔹 Swings
Left: x amount of wicks on the left of a potential Swing need to be higher/lower for a Swing to be confirmed.
Right: The number of wicks on the right of a potential swing needs to be higher/lower for a Swing to be confirmed.
🔹 Style
Bullish: color for test period (before a breakout) / retest period (after a breakout)
Bearish: color for test period (before a breakout) / retest period (after a breakout)
Label Size

Higher Timeframe High & Low [ChartPrime]The Higher Timeframe High & Low Indicator plots key levels (high, low, and average price) from a higher timeframe onto the current chart, aiding traders in identifying significant support and resistance zones.
The indicator also detects and labels breakout points and can display trend directions based on these higher timeframe levels breakout points.
Key Features:
◆ Higher Timeframe Levels:
Plots the high, low, and average price from a selected higher timeframe onto the current chart.
Extends these levels into the future for better visualization.
◆ Breakout Detection:
Identifies and labels breakouts above the higher timeframe high or below the higher timeframe low.
Breakout points are clearly marked with labels indicating "High Break" or "Low Break" with timeframe mark.
If the following break out type is the same that previous, it does not marked by labels, but still marked by bar color.
◆ Trend Visualization:
Optionally displays trend direction by changing bar colors and line styles based on breakout conditions.
Trend indication helps in identifying bullish or bearish market conditions.
◆ Support and Resistance Indication:
Marks support and resistance points with '◆' symbols when the current timeframe's high or low interacts with the higher timeframe's levels.
◆ Period separation:
Background color changes to indicate period separation if enabled.
◆ Inputs:
Extension to the right of High and Low: Sets the number of bars to extend the high and low lines into the future.
Timeframe: Selects the higher timeframe (e.g., Daily) to use for plotting high and low levels.
Period Separator: Toggles the visual separator for periods.
Show Trend?: Toggles the trend visualization, changing bar colors and plot styles based on breakouts.
Show Breakout Labels?: Toggles the Breakout Labels visualization.
Indicator Logic:
Historical vs. Real-Time Bars: Adjusts values based on whether the bar is historical or real-time to ensure accurate plotting.
High and Low Prices: Retrieves the high and low prices from the selected higher timeframe.
Breakout Conditions: Determines if the current price has crossed above the higher timeframe high (high break) or below the higher timeframe low (low break).
Color and Trend Logic: Adjusts colors and checks for breakouts to avoid multiple labels and indicate trend direction.
Usage Notes:
This indicator is ideal for traders looking to integrate multi-timeframe analysis into their strategy.
The higher timeframe levels act as significant support and resistance zones, helping traders identify potential reversal or continuation points.
The breakout labels and trend visualization provide additional context for trading decisions, indicating when the price has breached key levels and is likely to continue in that direction.
This indicator enhances chart analysis by providing clear, visual cues from higher timeframe data, helping traders make more informed decisions based on a broader market perspective.

Correct Fractal Swings by CRYPTOFORThis indicator adjusts and enhances the normal 3-fractal swing. The author of this definition, uncle_travis, takes into account swings with the absorption of 3 candles and uses them as structure points.

Swing Failure Pattern [UAlgo]🔶 Description:
The Swing Failure Pattern (SFP)o aims to identify potential reversal points in price action by detecting instances where price attempts to break past a previous high or low but fails to sustain that momentum, often indicating a shift in market sentiment.
🔶 Key Features:
Swing Failure Pattern Identification: The indicator identifies Swing Failure Patterns where price attempts to breach a recent high or low but fails to maintain that momentum, potentially signaling a reversal.
Customizable Lookback Period: Traders can adjust the lookback period to define the range within which Swing Failure Patterns are identified.
Minimum Bars Between SFP: This feature allows users to set a minimum number of bars required between Swing Failure Patterns to filter out noise and improve the accuracy of signals.
RSI Confluence: Traders have the option to incorporate RSI (Relative Strength Index) confluence into the signals, filtering SFP signals based on overbought and oversold levels of RSI. This adds an additional layer of confirmation to potential reversal points.
Example :
without Confluence :
with Confluence:
Customizable RSI Parameters: Users can customize the length of the RSI period as well as define overbought and oversold levels according to their trading strategy.
Visual Alerts: The indicator provides visual alerts on the price chart using labels to highlight potential Swing Failure Patterns, aiding traders in identifying these patterns quickly and efficiently.
Disclaimer:
Please note that the Swing Failure Pattern indicator is provided for informational purposes only and should not be considered as financial advice. Trading involves substantial risk, and users should conduct their own research and analysis or consult with a financial advisor before making any investment decisions based on this indicator. Additionally, past performance is not indicative of future results.

Liquidity Sweeps [LuxAlgo]The Liquidity Sweeps indicator detects the presence of liquidity sweeps on the user's chart, while also providing potential areas of support/resistance or entry when Liquidity levels are taken.
In the event of a Liquidity Sweep a Sweep Area is created which may provide further areas of interest.
🔶 USAGE
A Liquidity Sweep occurs when the price breaks through a liquidity level (further referred to as LqL ), after which the price returns below/above the liquidity level , forming a wick.
The script provides 2 options when this can happen:
A wick passes a LqL after which the price quickly returns.
First the closing price breaks through a LqL . After a while, the price retests the LqL and forms a wick in the opposite direction.
The examples above show a bullish and bearish scenario of "a wick passing through an LqL where the price quickly comes back". This type of Liquidity Sweep is represented by a dotted line.
The following example shows a broken LqL , where the price retests the Liquidity zone and bounces back.
Instead of a dotted line, this type of Liquidity Sweep is represented by a dashed line.
When a Liquidity Sweep takes place, this is indicated by highlighting the "wick- LqL " distance. This distance is also the basis for the Sweep Area (see next sub-section). A small 3-bar long dotted line starts from the opposite wick as an extra aid to determine potential support/resistance/entry, ...
Colors can be set in the settings (here yellow and aqua blue instead of default colors for clarity).
🔹 Sweep Areas
The distance between the LqL and the maximum limit of the wick forms a Sweep Area , which can provide a potential support/resistance or entry zone.
These examples show both types of Liquidity Sweeps , followed by a box indicating the Sweep Area .
When the Sweep Area is mitigated or a certain amount of bars has passed (Settings - 'Max bars'), the boxes will no longer be updated.
In this case, the 'Trigger' label shows the bar where the high crossed a LqL , after which a red box starts between LqL and high.
The low of the 'Trigger' bar is the starting point of a short dotted line. Next to the 'Trigger bar' the high touches the Sweep Area before returning, providing a potential short entry. One bar further, another entry opportunity presents itself when the price breaks the small dotted line.
In the following bullish example, not only do we see opportunities when the LqL has been swept, but the following Sweep Area provides some potential entries.
The small green dotted lines also act as a guide where the price breaks above, then forms a small range, after which the price continues in an upward direction.
Here, the initial trigger on the left forms a Sweep Area that is quickly broken. However, the small green line provides a potential entry area later on. The price moves in a short channel before breaking above the LqL (green dashed line), providing more potential entries. Price retests this LqL , and goes below this level. The price remained around the previously formed channel, after which the price resumed its upward trend.
🔶 SETTINGS
🔹 Liquidity Sweeps
Swings: Period used for the swing detection, with higher values returning longer term Liquidity Levels .
Options:
- Only Wicks: Only detects a Liquidity Sweep when a wick sweeps a previous wick
- Only Outbreaks & Retest: Only detects a Liquidity Sweep when the price breaks a Liquidity Level , returns & retests the Liquidity Level , and forms a wick in the opposite direction.
- Wicks + Outbreaks & Retest: Both options can be detected.
🔹 Sweep Area
Extend: Enables/Disables extension of the Sweep Area boxes.
Max Bars: Limit the extension to a certain number of bars.
Color Sweep Area box.

Smallest Swing [Truth Indie]This indicator is designed to test the smallest swing draw using the swing capture concept of the Pivot Points High Low indicator, setting the length to 1 for all periods, and combining it with price action that I think makes sense.
Example of a valid swing high.
Example of a valid swing low.

Swing Ranges [ChartPrime]Swing Ranges is an indicator designed to provide traders with valuable insights into swing movements and real-time support and resistance (SR) levels. This tool detects price swings and plots boxes around them, allowing traders to visualize the market dynamics efficiently. The indicator's primary focus is on real-time support and resistance levels, empowering traders to make well-informed decisions in dynamic market conditions.
Key Features:
Swing Box Visualization:
Swing Ranges excels at detecting swings in the price data and visually representing them with boxes on the price chart. This enables traders to quickly identify swing ranges, essential for understanding market trends and potential reversal points. VWAP POCs are also provided giving areas of high activity in each block.
Real-Time Support and Resistance Levels:
The core feature of Swing Ranges is its real-time support and resistance levels. These levels are dynamically calculated based on the volume-weighted data for each specific range. The indicator displays the strength of support and resistance zones with percentage bars, indicating the ratio between bullish and bearish volume. This real-time information empowers traders to assess the strength and significance of each SR level, enhancing their ability to execute well-timed trades.
ATR (Average True Range) Value:
Swing Ranges also includes an ATR value label, which shows the Average True Range for the selected period. ATR aids traders in understanding market volatility, enabling them to set appropriate stop-loss and take-profit levels for their trades.
VWAP (Volume Weighted Average Price) Information:
Traders c an readily access the VWAP value through the indicator's label. VWAP provides insights into the average price at which an asset has been traded, helping traders identify potential fair value areas and market trends.
Price Difference Percentage:
Swing Ranges displays the percentage difference between the high and low of each swing. This information allows traders to gauge the magnitude of price movements and assess potential profit targets more effectively.
The indicator also has a NV value. If the NV is high e.g. 10% or more there is indecision in the market and the market is trying to remain in a given range.
Settings Inputs:
1. Length Control:
The Length setting input in Swing Ranges allows traders to adjust the sensitivity of the indicator to detect swings. Traders can customize the length based on their trading strategies and timeframes.
2. ATR Period Adjustment:
The ATR Period input allows traders to fine-tune the calculation period for the Average True Range. This feature enables traders to adapt the indicator to different market conditions and asset classes.
Swing Ranges: Real-Time Support and Resistance Indicator is a comprehensive tool that combines swing visualization with dynamic support and resistance levels. By focusing on real-time SR levels, this indicator equips traders with the essential information needed to make confident trading decisions in ever-changing market conditions.

MonkeyblackmailThis script consists of several sections. test it and tell me your concerns. a lot of more works will be done
Volume Accumulation : The first part of the script checks for a new 5-minute interval and accumulates the volume of the current interval. It separates the volume into buying volume and selling volume based on whether the closing price is closer to the high or low of the bar.
Volume Normalization and Pressure Calculation : The script then normalizes the volume with a 20-period EMA, and calculates buying pressure, selling pressure, and total pressure. These calculations provide insight into the underlying demand (buying pressure) and supply (selling pressure) conditions in the market.
RSI Calculation and Overbought/Oversold Conditions : The script calculates the RSI (Relative Strength Index) and checks whether it is in an overbought (RSI > 70) or oversold (RSI < 30) state. The RSI is a momentum indicator, providing insights into the speed and change of price movements.
Volume Condition Check and Wondertrend Indicator : The script checks if the volume is high for the past five bars. If it is, it applies the Wondertrend Indicator, which uses a combination of the Parabolic SAR (Stop and Reverse) and Keltner Channel to identify potential trends in the market.
Swing High/Low and Fibonacci Retracement : The script identifies swing high and swing low points using a specified pivot length. Then, it draws Fibonacci retracement levels between these swing high and swing low points.
he monkeyblackmail script works well in the 5 minutes chart and combines several elements of technical analysis, including volume analysis, momentum indicators, trend-following indicators, volatility channels, and Fibonacci retracements. It aims to provide a comprehensive view of the market condition, highlighting key levels and potential trends in an easily understandable format. Don’t be too quick to start trading with it, first study how it work and you will blackmail the market.

Wave TrendThe Wave Trend indicator is based on the Mason’s Line Indicator.
This indicator is a sentiment analysis tool designed to help traders understand and analyze market trends. It works by calculating the average investor satisfaction of a group of investors. The results are displayed as colored squares at the bottom of the chart. For more information, read the description of the Mason's Line Indicator.
This indicator is not developed for use on short timeframes. It is an indicator that is best suited for longer timeframes, ideal for swing trading or long-term trading.
There are two main display parameters:
Display the coloured squares according to the distance to the sma (default value).
Display the squares according to the position of satisfaction in relation to the scale of the indicator.
there are two secondary settings for each of these options:
Display the squares by normalizing the values of the dataset between 0 and 1.
Display the squares without normalizing the value of the dataset between 0 and 1 (default value).
Please note that the Wave Trend Indicator is not a guarantee of future market performance and should be used in conjunction with proper risk management. Always ensure that you have a thorough understanding of the indicator’s methodology and its limitations before making any investment decisions. Additionally, past performance is not indicative of future results.

Regression Channel Alternative MTF V2█ OVERVIEW
This indicator is a predecessor to Regression Channel Alternative MTF , which is coded based on latest update of type, object and method.
█ IMPORTANT NOTES
This indicator is NOT true Multi Timeframe (MTF) but considered as Alternative MTF which calculate 100 bars for Primary MTF, can be refer from provided line helper.
The timeframe scenarios are defined based on Position, Swing and Intraday Trader.
Suppported Timeframe : W, D, 60, 15, 5 and 1.
Channel drawn based on regression calculation.
Angle channel is NOT supported.
█ INSPIRATIONS
These timeframe scenarios are defined based on Harmonic Trading : Volume Three written by Scott M Carney.
By applying channel on each timeframe, MW or ABCD patterns can be easily identified manually.
This can also be applied on other chart patterns.
█ CREDITS
Scott M Carney, Harmonic Trading : Volume Three (Reaction vs. Reversal)
█ TIMEFRAME EXPLAINED
Higher / Distal : The (next) longer or larger comparative timeframe after primary pattern has been identified.
Primary / Clear : Timeframe that possess the clearest pattern structure.
Lower / Proximate : The (next) shorter timeframe after primary pattern has been identified.
Lowest : Check primary timeframe as main reference.
█ FEATURES
Color is determined by trend or timeframe.
Some color is depends on chart contrast color.
Color is determined by trend or timeframe.
█ EXAMPLE OF USAGE / EXPLAINATION

Swing BoxesHey, folks!
Sorry for not posting anything for such a long time. Don't have enough ideas and resources to get inspiration, so trying to brainstorm good stuff in my free time from university studies.
But despite my absence more I now have 300+ people subscribed to me! Thanks, guys, for keeping interest for my work, as I still do value each boost on my script, for real :)
So here is new script , enjoy!
Swing Boxes is pretty simple indicator, which plots signals with "boxes", that help you determine price targets.
What is the idea behind?
I wanted to make indicator, that could help me make swing trades with nice accuracy (as all we want, lol), and for signal criteria I decided to use highs and lows of the price . Then I started coding some ideas to see which of them could be worthy. And, actually, Swing Boxes appeared to be good. But the thing is, that I didn't intend to build them, they appeared as an anomaly from my code :)
I started to explore this anomaly (it looked super cool, but was repainting hard) to fix it and I succeeded, now Swng Boxes don't repaint.
The main idea is that when price goes above it's highest value of p-bars back or below it's lowest value p-bars back, then there is a some god probability, that price will continue to follow current direction.
And the things about Swing Boxes is that when there is a good trend movement, the boxes become super small to track price movement and when price breaks out in the counter-trend direction, then you will be able to almost perfectly catch a top or a bottom! But most of the signals won't be so high-quality, so don't think that is this some holy grail to trade swing-trading, because it is not.
Signal logic
Quick hint:
- epsilon(variable e ) = ATR * ATR_Factor . It is used to determine box's sensitivity to price changes.
If previous close is higher than variable, which contains previous HIGHEST value (variable h in the code), then update the this variable by taking up-to-date highest value and add epsilon( e ) to it;
If previous close is lower than variable, which contains previous LOWEST value (variable l in the code), then update the this variable by taking up-to-date lowest value and substract epsilon( e ) from it.
Variables decribed above ( h and l ) are box's top and bottom respectively, so if price cross them, it is logical to update it is value.
Settings and what is what
Swing Box Period - numbers fo bars in the past to find highest and lowest price from. The bigger the input, the bigger the boxes will be;
ATR Period;
ATR Factor - multiplier for ATR, determines sensitivity for price changes. The bigger this input, the more accurate signals will be, but less the probability that the signal will be on the top or a bottom.
Show Boxes? - when chosen, plots box's top and bottom. Used to determine price targets.
Show Baseline? - when chosen, plot's baseline, which midline between box's top and bottom.
How to use?
This indicator plots green and red triangles by default.
- Green triangle --> Buy ;
- Red triangle --> Sell ;
As I've said before, many signals from indicator will probably be garbage, so you need to tune settings for youself, so it could satisfy you .
You can enable showing boxes to see box's top and bottom. Box's bottom --> your entry, top --> your profit target.
If you find a way to sort bad signals, you will be able to trade with super cool RR, because the signal from Swing Boxes appear to be a good one, there is almost 95% probability, that price will not even come close to your stop loss, so you can trade with super small stop-losses! Smaller stop-loss --> smaller risk --> smaller loss --> bigger profit, it is that easy.
Also you can enable baseline to use at as your 1st TP, and box's top/bottom as 2nd TP, closing 25% on TP1 and the rest on TP2 (but that is just mine recommendation, you can use different RM (risk-management), if you want).
Also you can use baseline as your S/R (Support/Resistance) line, test it out on your charts.
And please, hear me out: as all other indicators out here on the TradingView, Swing Boxes ARE NOT meant to be traded in solo! Many bad signal can go in a row, so PLEASE find your way to filter out bad signals with other indicators.
You can see here the example of a garabge-class signal in a row, so be don't be deluded!
I do hope that somebody will suggest and idea to improve this thing, as I personally don't have enough time to think about it because of my university studies, but I will probably try it make this thing better throughout the time.
And that's it for now, folks! If you have any ideas for scripts, strategies or anything else, feel free to DM me or leave a comment, I will check it.
Hope you will find this script useful.
Take your profits!
- Tarasenko Fyodor

Drip's 11am rule breakout/breakdown (OG)This indicator is based on Drippy2hard's 11:30 am (EST) rule.
In simple terms the rule states that:
If a trending stock makes a new high after 11:15-11:30am EST, there is a 75% chance of closing within 1% of High of day (HOD). Same applies for downtrend.
Please note:
Not all stocks will abide by this, this is backtested on stocks with avg daily volume > 2M and mostly mega cap stocks which have liquid option chains. The backtesting results show very promising results on $SPY/ $SPX so it is advised to trade $SPY/ $SPX using this indicator over any other stocks.
Although the name suggests 11 AM rule, the backtesting shows higher win rate for 11:30 AM so please select that option in the settings.
As always, no indicator is perfect and please follow your risk management and understand that indicators are tools to aid your trading and by no means they are supposed to work as intended in all scenarios
How the script works
1. A HOD/LOD zone is identified based on regular session (9:30am-11:30am) EST. Users can select cut off time to 11AM in the settings. These will be indicated on chart after 11/11:30pm depending on what user selected
2. If the stock breaks above the HOD and the ADX is showing strong momentum to upside then the candlesticks will start showing neon color, if the trend based on moving averages and candle closing is also bullish then the indicator will show trend arrows under the candle indicating to stay in the trade. Same applies for break below LOD, only the colors will change to represent downtrend.
3. An optional cloud is also shown if the trend is developed. The cloud can be used as trail stop or re entry point as long as it is displayed on chart
How to use the indicator in trading
In general, there are three scenarios which are trade worthy
1. If the stocks breaks out above the HOD zone and up trend develops or the stocks breaks below the LOD zone and downtrend develops. See images below
2. You can also use the LOD/HOD zone as demand/ supply if the Price action is range bound like this example below
Thanks for reading, please give thumbs up if you like using it! Please post comments on how to use it.

Swing Indicator (2 before, 1 after) v2 with Dong-DangFeatures
Detection Swing (swing HIGH is the highest bar among 2 bars before and 1 bar after, and swing LOW is the lowest bar among 2 bars before and 1 bar after)
Dong-Dang (The line plot switch between a swing HIGH and LOW ==> represents the price movement)
Fixes
fix swing detection from the last version when there are 2 or more bars that have the same high or low price
======== ======== ========
ฟีเจอร์
การจับสวิง (จะเป็นสวิง HIGH ก็ต่อเมื่อแท่งนั้นสูงกว่า 2 แท่งก่อนหน้า และ 1 แท่งด้านหลัง, และจะเป็นสวิง LOW ก็ต่อเมื่อแท่งนั้นต่ำกว่า 2 แท่งก่อนหน้า และ 1 แท่งด้านหลัง)
ด๊องแด๊ง (คือเส้นที่ลากสลับไปมาระหว่างสวิง High และ Low ==> ใช้เพื่อดูการเคลื่อนที่ของราคา)
สิ่งที่แก้ไข
แก้ไขการจับสวิงจากเวอร์ชันก่อนหน้า ในกรณีที่มีแท่งเทียน 2 แท่ง หรือมากกว่า มีค่า high หรือ low เท่ากัน
======== ======== ========
Credit: Bravo Trade Academy

Generalized Smooth StepHello, folks. Sorry for not posting anything for a long time, just busy with my university studies for the moment.
Quick script for today — Smooth Step.
You can search for it in Wikipedia, but saying shortly and informatively, this is just an advanced type of oscillator, used as momentum indicator.
In the codes across the Internet everybody uses the 3rd order equation, BUT I found it kinda boring to use indicator this simple, so I made an option to choose the order of the equation in the settings — parameter "Order of the equation". This why it is called generalized smooth step, as it makes possible to use equation of virtually any order.
It is limited to 18 because very strange behaviour that you get after passing 18th order (it jsut becomes not tradeable any longer).
As I've mentioned above, it is an advanced version of classical oscillator, used as momentum indicator .
How to use it?
If smooth step is above 50, then the price momentum is bullish;
If smooth step is below 50, then the price momentum is bearish.
As simple as it is, it becomes useful enough on the higher timeframes (>=1H), so feel free to play with it and find optimal settings for yourself.
Hints
Try perform different smoothing and leading methods (developed by Ehler) to get better results;
You can use smooth step as confirmation/filter for trend-following trades.
Hope you will find it valueable.
Take your profits!
- Tarasenko Fyodor
RU:
Привет, ребята. Извините, что долго ничего не выкладывал, просто сейчас занят учебой в университете.
Быстрый скрипт на сегодня — Smooth Step.
Вы можете поискать его теоретическое обоснование в Википедии, но если говорить кратко и информативно, то это совершенствованный тип классического осциллятора, используемый в качестве моментум-индикатора .
В кодах в интернете все используют уравнение 3-го порядка, НО Мне было скучно пользоваться таким простым индикатором, поэтому я сделал возможность выбирать порядок уравнения в настройках — параметр " Порядок уравнения». Поэтому он называется обобщеннымsmooth step, так как позволяет использовать уравнение практически любого порядка.
Я ограничил порядок уравнения 18 , потому что индикатор показывает начинается очень странное поведение, когда вы делаете порядок больше 18 (индикатор просто начинается вести семя хаотично, что ли).
Как я уже упоминал выше, это усовершенствованная версия классического осциллятора, используемого в качестве моментум-индикатора .
Как им пользоваться?
Если smooth step выше 50, то импульс цены бычий;
Если smooth steз\p ниже 50, то импульс цены медвежий.
Хоть это и очень простой индикатор, он может оказаться достаточно полезным на старших таймфреймах (>=1H), так что не стесняйтесь играть с ним и находить оптимальные настройки для себя.
Советы
Попробуйте использовать различные методы сглаживания и лидирования (разработан Джоном Элером (John Ehler)), чтобы получить лучшие результаты;
Вы можете использовать smooth step в качестве подтверждения/фильтра для сделок, следующих за трендом.
Надеюсь, этот скрипт будет вам полезен.
Получите прибыль!
- Тарасенко Фёдор

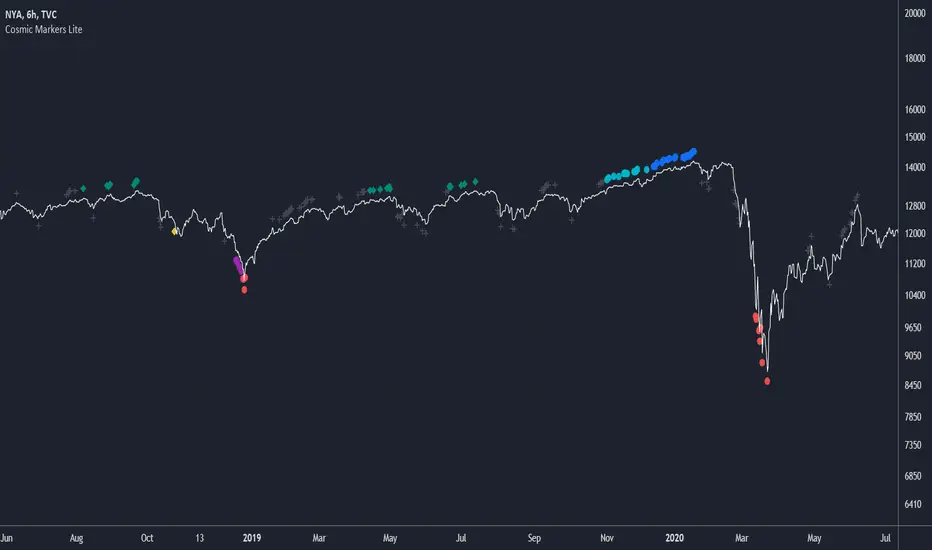
Cosmic Markers LiteThis marker-only indicator traces highest and lowest bars using 5 different periods (the first 3 in aggregation and the rest as is) for a total of 10 support and resistance signals of varying strength. Use Cosmic Markers Lite on its own or add on top of existing chart patterns or other line indicators.
Mark Structure ShdwMark Structure Show is building the market swing structure, minor and sub structure and marks all possible insignificant pivots
This indicator is the alternative version of Mark Structure indicator, I had to create another indicator in order to avoid programming limitation of TreadingView.
This version uses confirmation approach as confirming by body, it means every swing low/high is confirmed when the body (of newly creating swing low/high correspondingly) takes place and intercepts it. the same behaviour is with breaking structure its confirmed only by body.
From trading prospective with this kind of approach we can easily detect manipulations (caused by sweeps) and disregard those manipulation as elements which are breaking the structure. so its extremely useful for those who are trading smart money price actions and basing on swing structure POI
it supports:
- Marking all pivots with labels or join them continuously with trend lines.
- Marking minor and sub structured swings with labels or join them continuously with trend lines. Marking last actual CHoCH and BOS. Minor and substructure are structures inside swing structure and it can differ from the structure of lower timeframe
- Marking swings of swing structure with labels or join them continuously with trend lines.
- Changing bullish and bearish colors of each kind of structures
- Changing pivot labelings
- Changing colors
Remarks:
- Don't expect to have minor and sub structure in each swing waves, its totally fine when you don't have them at all
- Swing structure is the most significant structure and shows real price direction.
- The last swing is not able to be confirmed it tries to build 2 swings that most likely would be either substructure or SMS BOS

Heiken Ashi Swing High/LowIt uses Heiken Ashi candles to detect recent swing high and low.
It can be used as a stop-loss or support/resistance indicator.
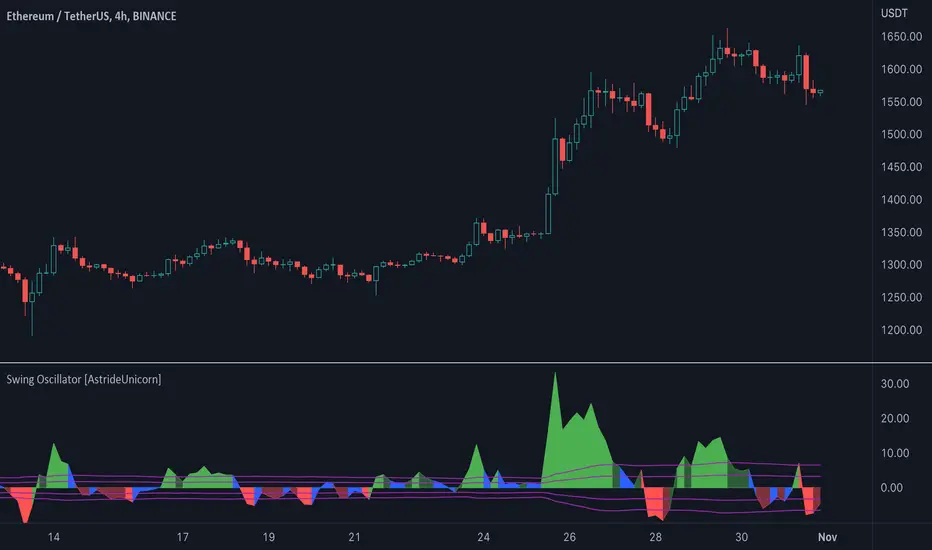
Swing Oscillator [AstrideUnicorn]The Swing Oscillator is an indicator that can help you catch small price movements, called swings. Swings are minor trends that occur when price moves between the highs and lows of a trend or range. Because of the short-term nature of swings, a new movement should be identified as soon as possible.
The indicator is based on our original formula, which averages the length of candlestick bodies and compares the result to several thresholds. This allows the algorithm to determine the direction and strength of the price movement.
HOW TO USE
When the indicator is above the zero level and colored green, it means that the price is in an upward swing. When the indicator is below the zero level and colored red, the price is in a downward swing. When the indicator is blue, the price swing is slowing down or the market is moving sideways. The amplitude of the oscillator shows the price volatility.
Adaptive-Lookback Stochastic [Loxx]Adaptive-Lookback Stochastic is an adaptive stochastic indicator.
The Adaptive lookback is truly a market-driven period input used to determine the variable lookback period for many different indicators, instead of a traditional, fixed figure.
It is based on the frequency of market swings - the time between swing highs or swing lows. A swing high is defined as two consecutive higher highs followed by two consecutive lower highs; a swing low is defined by two consecutive lower lows followed by two consecutive higher lows. As swing points typically accompany reversals, they occur more frequently in choppier and volatile markets than in trends.
Adaptive lookback period is determined as :
Determine the initial number of swing points (swing count parameter) to use in the calculation.
Count the number of price bars it takes for the n swing points to form.
Divide step 2 by step 1 and round the result.
As an addition, adjust the "speed" of the produced period using the speed parameter - the smaller the speed parameter, the "slower" the average, and vice versa
Included
Bar coloring
Loxx Expanded Source Types
3 types of signals: levels crosses, slope, and middle crosses
Alerts