Median Supertrend [BackQuant]Median Supertrend Concept by BackQuant ©
This was created since the normal supertrend is noisy, in the attempts to remove that and still get a good signal we decided to use a special median calculation as the source to a modified supertrend. This allows us to reduce noise, and make the supertrend adaptive to volatility. The full description and reasoning, including definitions and backtests are as follows:
1. Definition of Median
The median is a statistical measure that identifies the middle value in a given set of numbers when those numbers are arranged in either ascending or descending order. If the dataset has an even number of observations, the median is calculated as the average of the two middle numbers. This measure is particularly useful in understanding the central tendency of data, especially in cases where the dataset may contain outliers that could skew the mean. For example, in a dataset representing the earnings of families, the median provides a more accurate reflection of the typical income than the mean if the dataset includes extreme values.
2. Understanding Supertrend and Its Use Case
Supertrend is a popular trend-following indicator used in technical analysis. It is computed using the Average True Range (ATR) to capture volatility, combined with a moving average. The indicator provides clear signals to traders about bullish or bearish trends, indicating potential entry and exit points. Traders often use Supertrend in various market conditions to enhance their trading strategies, leveraging its simplicity and effectiveness in identifying ongoing trends and reversals.
3. Rationale Behind Combining Median with Supertrend
The integration of the median into the Supertrend indicator seeks to mitigate the impact of outliers and sudden market spikes that can affect trend analysis. By using the median value of price data for trend determination, the Median Supertrend aims to offer a more stable and reliable indicator that reflects the underlying market conditions more accurately than traditional methods. This modification is intended to improve the timing of trend detection and the precision of entry and exit signals.
4. Key Differences and Benefits
Enhanced Stability: The use of median values reduces sensitivity to extreme price movements, offering a smoother trend line that can lead to more reliable trading signals.
Adaptive Sensitivity: Users can adjust the indicator's sensitivity to align with different trading styles and market conditions through customizable parameters like the ATR multiplier and lookback period.
Explicit Trading Signals: The indicator simplifies the trading process by providing clear, actionable long and short signals based on trend reversals, aiding in decision-making.
Customizability: Options to use Heikin Ashi candles, paint candles based on the trend, and toggle signal visibility allow traders to personalize the indicator to their preference.
5. User Inputs
The Median Supertrend indicator includes several user inputs to tailor its operation:
Use HA Candles as Source?: Option to base calculations on Heikin Ashi candles for smoother price data.
Paint Candles According to Trend?: Visual aid that colors candles based on the current trend direction, enhancing chart readability.
ATR Period and Multiplier: Parameters to adjust the sensitivity of the trend detection, allowing users to fine-tune the indicator.
Adaptive Lookback Period: Defines the period for the median calculation, offering flexibility in trend assessment.
Show Long and Short Signals: Enables traders to visualize entry signals directly on the chart.
6. Application in Trading
Traders can incorporate the Median Supertrend into their strategies as a standalone indicator for trend following or as a filter in a multi-indicator system. It is particularly useful in markets known for having outliers or sudden price jumps, as the median-based calculation provides a grounded trend analysis. This indicator can be applied across various timeframes and asset classes, making it a versatile tool for day traders, swing traders, and long-term investors alike.
7. Summary and Empirical Soundness
The integration of median values into the Supertrend indicator represents an innovative approach to trend analysis, addressing some of the volatility and outlier-related challenges inherent in traditional methods. This combination is empirically sound as it leans on the statistical robustness of the median to offer a more stable and reliable trend determination mechanism.
8. Relavant Backtests on Major Assets (1D Timeframe)
We include these backtests as a general proxy for how they work.
Please do your own calibrating to suit it to your own needs and backtest.
Past results don't = future results but they can help you understand how it functions.
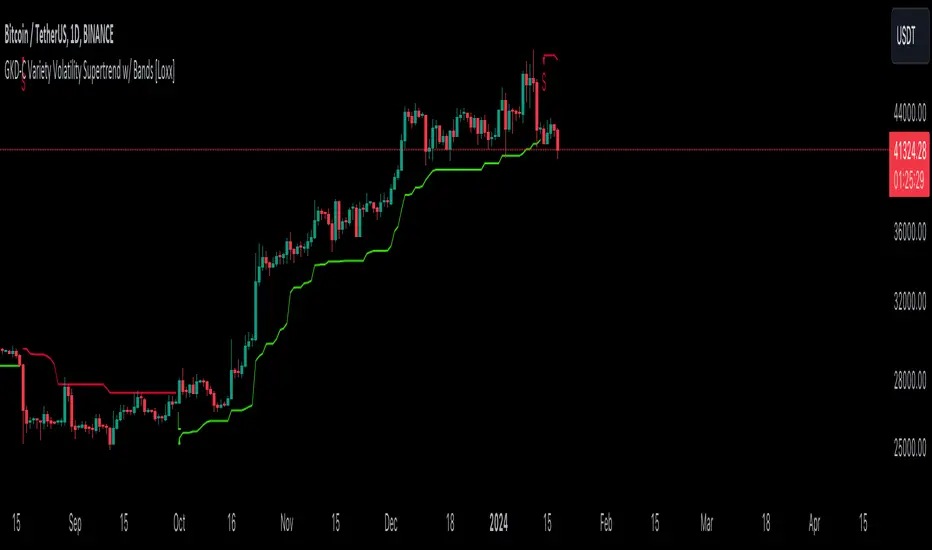
INDEX:BTCUSD
INDEX:ETHUSD
BINANCE:SOLUSD
Indicador Pine Script®