Multiple Factor Adaptive MA SuperTrendMultiple Factor Adaptive MA SuperTrend
Multiple Factor Adaptive MA SuperTrend is an enhanced trend-following overlay that builds on the classical SuperTrend concept by introducing an adaptive moving-average base. The indicator dynamically adjusts to changing market conditions to produce smoother and faster trend signals, helping traders better track directional moves while reducing unnecessary noise.
Instead of relying on a fixed moving-average base, the indicator updates its baseline only when market conditions justify it. This creates a stabilizing effect during consolidation while allowing quicker reactions when volatility, momentum, or activity increases.
🔍 How It Works
The indicator combines:
• A user-selectable Moving Average as the core trend base
• ATR-based volatility bands to detect trend transitions
• An adaptive filter that determines when the base should update
The adaptive mechanism evaluates market conditions using one of several selectable drivers:
• ATR expansion (volatility increase)
• Rate-of-change acceleration
• Rising trading volume
• Increasing divergence between price and the moving average
If the chosen condition signals increased activity or market change, the moving-average base updates normally. Otherwise, the previous base value is retained, effectively smoothing the trend structure and filtering minor fluctuations.
Volatility bands are then calculated around this adaptive base using ATR multiplied by a configurable factor. Trend changes occur when price crosses these bands.
When price breaks above the upper band, a bullish trend is activated and the lower band becomes the trailing support. When price breaks below the lower band, a bearish trend is activated and the upper band acts as trailing resistance.
⚙️ Key Features
• Adaptive moving-average baseline
• Multiple MA types including SMA, EMA, WMA, HMA, VWMA, DEMA, TEMA, and EWMA
• ATR-based volatility bands
• Multiple adaptation modes (volatility, momentum, volume, divergence)
• Reduced noise during consolidation phases
• Smooth trend visualization and transition markers
🧩 Inputs Overview
• Moving-average type and length
• Price source selection
• ATR length and multiplier
• Adaptive filter method selection
📌 Usage Notes
• Useful for identifying prevailing market direction and trend shifts.
• Adaptive filtering can help reduce false signals during sideways markets.
• Signals may update intrabar on lower timeframes.
• Best results are achieved when combined with confirmation tools or risk management rules.
• This script is intended for analytical purposes and does not provide financial advice.
Supertrend

Adaptive MA SuperTrendAdaptive MA SuperTrend
Adaptive MA SuperTrend is a trend-following overlay indicator designed to deliver smoother and more responsive signals than the classical SuperTrend by dynamically combining two moving averages with volatility-based band calculations.
Instead of relying on a single average, the script calculates a selectable pair of moving averages and continuously assigns them as the upper or lower base depending on which value is greater at each bar. This adaptive swapping allows the structure to respond better to changing market conditions while preserving overall trend stability.
A volatility component is then added to the bases using either:
• Average True Range (ATR)
• Standard Deviation (SD)
The selected volatility measure is multiplied by a configurable factor to create adaptive bands around the moving-average bases. Price crossing these bands determines trend direction changes.
When price crosses above the upper band, the trend switches bullish and the lower band becomes the trailing support line. When price crosses below the lower band, the trend switches bearish and the upper band becomes the trailing resistance line. Only the active trend side is plotted to reduce visual noise and improve chart clarity.
Multiple moving-average pair options are provided, allowing users to choose combinations that match their preferred balance between smoothness and responsiveness, including SMA, EMA, WMA, HMA, VWMA, DEMA, TEMA, and ALMA-based combinations. Additional parameters are available when ALMA is selected.
⚙️ Key Features
• Adaptive swapping between two moving averages
• Choice of MA pairs with different responsiveness profiles
• ATR or Standard Deviation volatility bands
• Configurable volatility length and multiplier
• Optional ALMA tuning parameters
• Trend visualization with color-coded support/resistance lines
• Signal markers displayed on trend transitions
🧩 Inputs Overview
• Moving average pair selection
• Moving average length and price source
• Volatility method, length, and multiplier
• Optional ALMA offset and sigma parameters
📌 Usage Notes
• Designed to help visualize prevailing trend direction and potential trend shifts.
• Can be combined with confirmation tools or risk management rules within broader strategies.
• Signals are generated when price crosses volatility-adjusted moving-average bands; signals may update intrabar, especially on lower timeframes.
• This script is intended for analytical purposes and does not constitute financial advice. Users should test and validate performance within their own workflow before applying it to live trading.

Adaptive AI SuperTrend [AlgoPoint]🚀 Adaptive AI SuperTrend
Adaptive AI SuperTrend is a high-performance trading terminal that redefines trend-following by integrating Machine Learning (ML) principles with advanced market regime detection. Unlike static indicators, this system dynamically recalibrates its internal parameters to match the ever-changing volatility of the financial markets.
Equipped with a custom "Wizard Engine," it filters out market noise during consolidation and identifies high-probability trend continuation points, making it an essential tool for scalpers, day traders, and swing traders alike.
🧠 What Makes it "AI"?
While traditional indicators use fixed rules, Adaptive AI SuperTrend utilizes Algorithmic Intelligence to make real-time decisions:
KNN-Inspired Adaptation: The engine analyzes the last 150 bars of volatility and trend strength to automatically adjust its sensitivity.
Market Regime Intelligence: It distinguishes between "Trending" and "Ranging" states using a sophisticated Squeeze Momentum module, preventing "whipsaws" during low-volume periods.
Self-Backtesting Logic: The indicator continuously calculates its own historical Win-Rate. If the probability of success falls below a certain threshold, it suppresses lower-quality signals.
🛠 Key Features
Dynamic Consolidation Boxes: Automatically identifies and wraps "choppy" price action in professional gray boxes. It waits for 3+ bars of consolidation before marking the zone, helping you spot breakout opportunities early.
Multi-Strategy Aggression:
- Conservative: Filtered signals for long-term trend following.
- Balanced: Optimized for daily volatility.
- Aggressive: High-frequency signals for capturing micro-trends.
Dual-Exit Risk Management:
- ATR TP-SL Mode: Sets mathematical targets based on market volatility with persistent on-screen lines.
- Smart Trailing Mode: Rides the trend to its exhaustion point. Includes intelligent labeling (🎯 TP or 🛑 SL) based on the trade's net profitability.
- RSI Pullback Confirmation: Beyond simple trend flips, it detects "buy the dip" or "sell the rip" opportunities within an existing trend using RSI 50-level crossovers.
📊 Real-Time Analytics Dashboard
The integrated AlgoPoint Dashboard provides a surgical view of the market:
- Market State: Instant "Trending" vs. "Ranging" (Consolidation) detection.
- Trend Strength: ADX-based momentum tracking.
- Strategy Status: Real-time feedback on your active aggression and exit modes.
🎨 Clean Charting & Customization
Built for professional clarity, you have total control over the UI:
Toggle Consolidation Boxes on/off.
Toggle ATR Target Lines and Exit Labels.
Customize background filters and dashboard visibility.

Supertrend by JKRSupertrend by JKR is a trend-following overlay that plots dynamic support/resistance bands around price and flips when the trend changes.
It builds a smoothed baseline using your selected moving average type (SMA, TMA, WMA, VWMA, TEMA, HMA, EMA, or VMA). Around this baseline, it computes a volatility/range offset (classic ATR mode or Dual-Thrust range mode) and creates two trailing bands:
UpTrend band (active during bullish conditions)
DownTrend band (active during bearish conditions)
When price closes beyond the active band, the indicator flips trend direction and switches to the opposite band. While the trend remains active, the band “trails” price and updates in a way that avoids stepping backwards, which helps keep the trend structure clean and stable.
Options
Trend-change arrows (optional)
Bar coloring or candle overlay (optional)
Designed to evaluate on bar close for stable signals
Tip: Increase the Multiplier to reduce flips and widen bands; reduce Period to make the trend more responsive.

SuperBands: Smart Pullback StrategyIndicator Name: SuperBands (Smart Pullback Strategy)
1. Core Concept (The Philosophy)
This indicator represents a smart fusion of two powerful trading methodologies: Trend Following and Mean Reversion. Instead of trying to predict market tops or bottoms, it focuses on joining an established trend at a "Discount Price."
In short: "Buy the dips in an Uptrend, and Sell the rallies in a Downtrend."
2. Technical Components
The indicator consists of two main engines working in harmony:
First: The Trend Filter (Supertrend):
Settings: (ATR 20 / Factor 6.0).
Function: Identifies the long-term market direction. The high Factor (6.0) is deliberately used to filter out noise and minor fluctuations, ensuring the trend direction only changes when there is a significant market shift.
Rule: If the line is Green, only Long trades are allowed. If Red, only Short trades are allowed.
Second: The Sniper (Bollinger Bands):
Settings: (Length 20 / StdDev 2.0).
Function: Identifies temporary Overbought and Oversold zones within the trend.
Rule: The Lower Band acts as a "Value Zone" for buying, while the Upper Band acts as a "Premium Zone" for selling.
3. Signal Logic (How it Works)
The indicator scans the market for specific, high-probability conditions:
A. Buy Signal (Green Triangle):
Appears only when both conditions are met:
Trend is Bullish: Supertrend is Green.
Price is "Cheap": Price drops to touch or break the Lower Bollinger Band.
Logic: The general trend is Up, and the price has pulled back to a dynamic support level. This is a buying opportunity.
B. Sell Signal (Red Triangle):
Appears only when both conditions are met:
Trend is Bearish: Supertrend is Red.
Price is "Expensive": Price rises to touch or break the Upper Bollinger Band.
Logic: The general trend is Down, and the price has rallied to a dynamic resistance level. This is a selling opportunity.
4. User Guide (How to Trade It)
To achieve the best results, consider the following approach when a signal appears:
A. Entry:
Enter the trade immediately upon the close of the candle where the triangle appears (or place a pending order slightly above/below the signal candle for confirmation).
B. Stop Loss (SL):
Conservative: Place the SL at the Supertrend line (if this line breaks, the trend is invalid).
Aggressive: Place the SL slightly below the signal candle's low or the most recent Swing Low.
C. Take Profit (TP):
Target 1: The Bollinger Bands Middle Line (Basis/SMA 20).
Target 2: The Opposite Band (Upper Band for Buy signals, Lower Band for Sell signals).
5. Key Strengths & Limitations
Main Advantage: This indicator prevents a common trader mistake: "FOMO" (Fear Of Missing Out). It stops you from buying at the top or selling at the bottom. It psychologically forces you to wait for the price to come to you.
Best Use Case: The wide Supertrend settings make this highly effective for Crypto and Volatile Stocks where trends are strong and pullbacks are deep.
Limitation: In tight, ranging markets (choppy markets), the price might not touch the bands often, or it might generate a signal followed by sideways movement.
Summary for the Trader:
This indicator tells you: "The trend is Up, but don't chase the price... wait for it to drop to the Lower Band, then strike."
اسم المؤشر: SuperBands (Smart Pullback Strategy)
1. الفكرة الأساسية (الفلسفة وراء المؤشر)
هذا المؤشر هو دمج ذكي بين استراتيجيتين شهيرتين: تتبع الاتجاه (Trend Following) و اقتناص الارتدادات (Mean Reversion). هو لا يحاول التنبؤ بقمة أو قاع السوق، بل يحاول الدخول مع الاتجاه العام القوي ولكن من "نقطة سعرية مخفضة" (Discount Price).
باختصار: "اشترِ الانخفاضات في الاتجاه الصاعد، وبع الارتفاعات في الاتجاه الهابط".
2. المكونات التقنية
يتكون المؤشر من جزأين رئيسيين يعملان كفريق واحد:
أولاً: الحارس (Supertrend):
الإعدادات: (ATR 20 / Factor 6.0).
الوظيفة: تحديد الاتجاه العام "طويل المدى". استخدام العامل 6.0 (وهو رقم كبير) يجعل المؤشر يتجاهل التذبذبات الصغيرة ولا يغير لونه إلا إذا تغير الاتجاه الحقيقي للسوق بقوة.
القاعدة: إذا كان الخط أخضر، يُسمح بالشراء فقط. إذا كان أحمر، يُسمح بالبيع فقط.
ثانياً: القناص (Bollinger Bands):
الإعدادات: (Length 20 / StdDev 2.0).
الوظيفة: تحديد مناطق ذروة البيع والشراء المؤقتة (Overbought/Oversold) داخل الاتجاه.
القاعدة: الحد السفلي يعتبر منطقة "رخيصة" للشراء، والحد العلوي منطقة "غالية" للبيع.
3. كيف تتكون الإشارة (آلية العمل)
يقوم المؤشر بمسح السوق بحثاً عن شروط محددة بدقة:
A. إشارة الشراء (المثلث الأخضر):
تظهر فقط عند تحقق الشرطين معاً:
الاتجاه صاعد: السوبر تريند لونه أخضر.
سعر مغري: السعر هبط ليلامس أو يكسر الحد السفلي للبولنجر باند (Lower Band).
المنطق: الاتجاه العام صاعد، والسعر قام بعمل تصحيح (Pullback) لمستوى دعم ديناميكي، إذن هي فرصة للشراء بسعر أفضل.
B. إشارة البيع (المثلث الأحمر):
تظهر فقط عند تحقق الشرطين معاً:
الاتجاه هابط: السوبر تريند لونه أحمر.
سعر مرتفع: السعر صعد ليلامس أو يخترق الحد العلوي للبولنجر باند (Upper Band).
المنطق: الاتجاه العام هابط، والسعر قام بعمل تصحيح صعودي لمقاومة ديناميكية، إذن هي فرصة للبيع من مكان مرتفع.
4. كيفية الاستفادة منه (دليل المستخدم)
لتحقيق أفضل نتائج، يُنصح باتباع الخطوات التالية عند ظهور الإشارة:
أ. نقاط الدخول (Entry):
ادخل الصفقة بمجرد إغلاق الشمعة التي ظهر عليها المثلث (أو ضع أمر معلق فوق/تحت الشمعة لتأكيد الحركة).
ب. وقف الخسارة (Stop Loss):
الخيار الآمن: ضع الوقف عند خط السوبر تريند (لأنه إذا كُسر الخط، يعني أن الاتجاه تغير).
الخيار المغامر: ضع الوقف أسفل قاع الشمعة السابقة بمسافة بسيطة، أو أسفل آخر قاع (Swing Low).
ج. جني الأرباح (Take Profit):
الهدف الأول: خط المنتصف للبولنجر باند (الخط البرتقالي الخفي أو متوسط 20).
الهدف الثاني: الحد المعاكس للبولنجر باند (الحد العلوي في حالة الشراء، والسفلي في حالة البيع).
5. مميزات وعيوب يجب الانتباه لها
الميزة القوية: يمنعك هذا المؤشر من ارتكاب خطأ شائع وهو "الشراء في القمة" أو "البيع في القاع". هو يجبرك نفسياً على انتظار السعر ليأتي إليك في مناطق التصحيح.
نقطة القوة: إعدادات السوبر تريند (6.0) تجعل الإشارات قوية جداً في العملات الرقمية (Crypto) والأسهم ذات الاتجاه الواضح (Trending Markets).
نقطة الضعف: في الأسواق العرضية المملة (Ranging Markets) ذات النطاق الضيق جداً، قد لا تلمس الأسعار حدود البولنجر كثيراً، أو قد يعطي إشارات دخول والسوق لا يتحرك بعدها بقوة.
ملخص للمتداول:
هذا المؤشر يقول لك: "السوق صاعد، لكن لا تطارد السعر.. انتظر حتى يهبط السعر إليك عند الخط السفلي ثم اشترِ".

SuperTrend - With Exits & Trade ZonesSuperTrend - With Exits & Trade Zones
Overview
An advanced trend-following indicator that combines pivot points with the SuperTrend methodology to create a complete trading system with entry signals, exit signals, and visual trade zones. This indicator adapts to market structure rather than just price action, providing more reliable trend identification.
What Makes This Unique
Unlike standard SuperTrend indicators that use moving averages, this version:
Uses actual pivot points to calculate a dynamic center line
Provides multiple entry mode options for different trading styles
Shows clear exit signals (both trailing stop and take profit)
Color-codes the entire chart into trade zones (Long, Short, No Trade)
Eliminates guesswork about when to enter, exit, and stay out
Features
📊 Core Indicator Components
Pivot Point Detection: Identifies local highs and lows in price structure
Dynamic Center Line: Weighted calculation using detected pivot points
ATR-Based Bands: Volatility-adjusted upper and lower bands
Trailing Stop Line: Adaptive stop-loss that follows the trend
🎯 Entry Signals
Four entry modes to match your trading style:
Immediate Mode ⚡
Signals right when the trailing stop breaks
Fastest entries for aggressive traders
Best for strong trending markets
Aggressive Mode 🔥 (Recommended)
Signals when price closes beyond break candle OR opens beyond it
Balanced speed and confirmation
Good for most market conditions
Balanced Mode ⚖️
Requires entire candle to close beyond break level
Moderate confirmation
Reduces false breakouts
Conservative Mode 🛡️
Waits for candle to open AND stay completely beyond break level
Highest confirmation, slowest entries
Best for choppy markets
🚪 Exit Signals
Three exit strategies:
Trailing Stop
Exits when price crosses back through the trailing stop line
Lets profits run in trending markets
Protects gains when trend weakens
Take Profit %
Exits at predetermined profit target
Locks in gains at specific percentage
Good for range-bound markets
Both
Uses whichever exit comes first
Combines profit protection with trend following
Recommended for most traders
🎨 Visual Trade Zones
Color-coded backgrounds eliminate confusion:
🟢 Light Green: Active LONG position
🔴 Light Red: Active SHORT position
⚫ Gray: NO TRADE ZONE (between exit and next signal)
📍 Additional Visual Elements
Diamond markers: Show when trailing stop is first broken
BUY/SELL labels: Clear entry signals in green/red
EXIT markers: Gray X for stop loss, Orange X (TP) for take profit
Pivot points: Optional display of detected highs/lows (H/L markers)
Support/Resistance: Optional circles at pivot levels
Settings & Parameters
Basic Settings
Pivot Point Period (default: 2)
Controls sensitivity of pivot detection
Lower = more pivots detected (more responsive)
Higher = fewer pivots (more stable)
ATR Factor (default: 3)
Distance multiplier for trailing stop bands
Lower = tighter stops (more signals, earlier exits)
Higher = wider stops (fewer signals, longer trades)
ATR Period (default: 10)
Lookback period for volatility calculation
Affects how quickly bands adapt to volatility changes
Entry Configuration
Entry Mode: Select from Immediate/Aggressive/Balanced/Conservative
Determines how quickly the indicator generates signals after a trend break
Exit Configuration
Exit Method: Choose Trailing Stop, Take Profit %, or Both
Take Profit % (default: 2%)
Set your profit target as percentage of entry price
Adjust based on volatility and timeframe
Display Options
Show Buy/Sell Labels: Toggle entry signal labels
Show Exit Signals: Toggle exit markers
Show Break Candles: Toggle diamond markers on trend breaks
Show Pivot Points: Display H/L markers at pivot points
Show PP Center Line: Display the dynamic center line
Show Support/Resistance: Display circles at S/R levels
How to Use
For Swing Traders
Set Entry Mode to "Balanced" or "Conservative"
Use "Both" exit method with 3-5% take profit
Enable all visual elements for complete market picture
Trade only in direction of colored zones
For Day Traders
Set Entry Mode to "Aggressive" or "Immediate"
Use "Trailing Stop" exit method to catch intraday trends
Lower ATR Factor to 2-2.5 for tighter stops
Watch for quick signals in the first 2 hours of trading
For Position Traders
Use higher timeframes (Daily/Weekly)
Set Entry Mode to "Conservative"
Increase Take Profit % to 5-10%
Use larger ATR Factor (4-5) for wider stops
General Trading Rules
✅ DO: Enter on BUY/SELL signals (green/red backgrounds)
✅ DO: Exit on EXIT/TP markers
❌ DON'T: Enter during gray NO TRADE ZONE
❌ DON'T: Counter-trend trade against the colored zone
Alerts
Set up the following alerts for automated trading notifications:
Buy Signal: Triggers when long entry conditions are met
Sell Signal: Triggers when short entry conditions are met
Exit Long: Triggers when long position should be closed
Exit Short: Triggers when short position should be closed
Trailing Stop Broken: Triggers on initial trend change
Best Practices
Timeframe Selection
1-5 min: Scalping (use Immediate/Aggressive mode)
15-60 min: Day trading (use Aggressive/Balanced mode)
4H-Daily: Swing trading (use Balanced/Conservative mode)
Weekly: Position trading (use Conservative mode)
Risk Management
Always use the EXIT signals - don't hold through gray zones
Position size based on distance to trailing stop
Never risk more than 1-2% per trade
Consider wider stops on higher timeframes
Market Conditions
Trending markets: Use Aggressive mode, Trailing Stop exits
Ranging markets: Use Conservative mode, Take Profit exits
High volatility: Increase ATR Factor, use Both exits
Low volatility: Decrease ATR Factor for tighter stops
Technical Details
Calculation Method
Detect pivot highs and lows using specified period
Calculate weighted center line: (previous_center × 2 + new_pivot) / 3
Calculate bands: Upper = Center - (ATR Factor × ATR), Lower = Center + (ATR Factor × ATR)
Determine trend based on price position relative to bands
Trail stop line follows the active trend direction
Signal Logic
Entry signals generated based on selected confirmation mode
Position tracking maintains state from entry to exit
Exit signals calculated from both trailing stop and take profit levels
Trade zones update in real-time based on position state
Limitations & Considerations
Works best in trending markets; may generate false signals in tight ranges
Not a holy grail - should be used with proper risk management
Past performance does not guarantee future results
Recommended to backtest on your specific instrument and timeframe
Consider combining with volume analysis or other indicators for confirmation
Version History
v1.0: Initial release with entry signals and confirmation modes
v1.1: Added exit signals (trailing stop and take profit)
v1.2: Added color-coded trade zones (Long/Short/No Trade)
Credits
Original Pivot Point SuperTrend concept by LonesomeTheBlue
Modified with exit signals and trade zone visualization
License
Mozilla Public License 2.0
Example Setups
Conservative Swing Trading
Pivot Point Period: 2
ATR Factor: 3
ATR Period: 10
Entry Mode: Conservative
Exit Method: Both
Take Profit %: 4%
Aggressive Day Trading
Pivot Point Period: 2
ATR Factor: 2.5
ATR Period: 10
Entry Mode: Aggressive
Exit Method: Trailing Stop
Position Trading
Pivot Point Period: 3
ATR Factor: 4
ATR Period: 14
Entry Mode: Balanced
Exit Method: Both
Take Profit %: 8%
Disclaimer: This indicator is for educational purposes only. Trading involves substantial risk. Always do your own research and never trade with money you cannot afford to lose.

SmartVol SuperTrend | OquantOverview
The SmartVol SuperTrend is an evolution of the traditional SuperTrend indicator. While the standard SuperTrend uses Average True Range (ATR) to calculate volatility bands, this version utilizes Volume-Weighted Standard Deviation (VWSD).
By integrating volume into the volatility calculation, the indicator attempts to filter out "quiet" price movements and reacts more dynamically to price action supported by high trading activity.
How It Works
The script follows a multi-step process to define trend direction:
Smoothing: It applies a 5-period EMA to the source price to reduce minor noise before calculating the bands.
Volume-Weighted Volatility: Instead of a simple Standard Deviation, the script uses a custom volume standard deviation function. It measures the dispersion of price around its Volume Weighted Moving Average (VWMA), weighting each price point's contribution by the volume of that bar.
Recursive Band Logic: Like the classic SuperTrend, the bands are "locked" in place. The lower band can only move up, and the upper band can only move down, until price closes on the opposite side, triggering a trend flip.
Visuals: The script highlights the trend by coloring the candles and the space between the price and the trend line, providing a clear visual of the current market bias.
Usefulness
By using Volume-Weighted Standard Deviation, this indicator accounts for real market activity. Consequently, it expands its bands more aggressively during high-volume breakouts while dampening its reaction to price moves when volume fades, potentially offering more robust band levels anchored to true market participation.
How to Use
Trend Identification: When the line is green and below price, the trend is bullish. When the line is purple and above price, the trend is bearish.
Factor Adjustment: Increase the Factor (default 1.8) to reduce sensitivity and avoid whipsaws in volatile markets. Decrease it for tighter tracking.
EMA Length: Adjust the EMA length to change how much price smoothing is applied before the trend calculation.
Note on Signals
This indicator is designed for trend-following. Like all lagging indicators, it performs best in trending markets and may produce false signals during sideways consolidation.
Settings
Source: The price source used for calculations (default: Close).
EMA Length: The lookback for the initial price smoothing (default: 5).
VWSD Length: The period used to calculate the volume-weighted volatility (default: 30).
Factor: The multiplier applied to the VWSD to determine the distance of the bands (default 1.8).
⚠️ Disclaimer: This indicator is intended for educational and informational purposes only. Trading involves risk, and past performance does not guarantee future results. Always test and evaluate indicators/strategies before applying them in live markets. Use at your own risk.

ATR Supertrend [QuantAlgo]🟢 Overview
The ATR Supertrend indicator identifies trend direction and reversal points using volatility-adjusted dynamic support and resistance levels. It combines Average True Range (ATR) volatility measurement with adaptive price bands and EMA smoothing to create trailing stop levels that automatically adjust to market conditions, helping traders and investors identify trend changes, maintain positions during trending markets, and exit when momentum shifts across multiple timeframes and asset classes.
🟢 How It Works
The indicator's core methodology lies in its volatility-adaptive band system, where dynamic support and resistance levels are calculated based on market volatility and price movement:
smoothedSource = ta.ema(source, smoothingPeriod)
atr = ta.rma(ta.tr(true), atrLength) * atrMultiplier
The script uses ATR-based bands that expand and contract with market volatility, ensuring the indicator adapts to different market conditions rather than using fixed price distances:
if trend == 1
supertrend := math.max(supertrend, smoothedSource - atr)
else
supertrend := math.min(supertrend, smoothedSource + atr)
First, it applies optional EMA smoothing to the price source to reduce noise and filter out minor price fluctuations that could trigger premature trend changes, allowing traders to focus on genuine momentum shifts.
Then, the ATR calculation measures market volatility using the Average True Range over the specified lookback period, multiplied by the user-defined factor to set the band distance:
atr = ta.rma(ta.tr(true), atrLength) * atrMultiplier
Next, dynamic trend detection occurs through a state-based system where the indicator tracks whether price is in an uptrend or downtrend, automatically adjusting the Supertrend line position:
if trend == 1
if smoothedSource < supertrend
trend := -1
supertrend := smoothedSource + atr
The Supertrend line can act as a trailing stop that follows price during trends but never moves against the trend direction, i.e., it ratchets upward with price in uptrends and ratchets downward with price in downtrends.
Finally, trend reversal signals are generated when price crosses the Supertrend line, indicating a shift in market momentum:
bullSignal = trend == 1 and trend == -1
bearSignal = trend == -1 and trend == 1
This creates a volatility-adaptive trend-following system that combines dynamic support/resistance levels with momentum confirmation, providing traders with clear directional signals and automatic stop-loss levels that adjust to changing market conditions.
🟢 Signal Interpretation
▶ Bullish Trend (Green): Price trading above Supertrend line with indicator showing bullish color, indicating established upward momentum = Long/Buy opportunities
▶ Bearish Trend (Red): Price trading below Supertrend line with indicator showing bearish color, indicating established downward momentum = Short/Sell opportunities
▶ Supertrend Line as Dynamic Support: In uptrends, the Supertrend line can act as trailing support level that rises with price, never declining = Use as potential stop-loss reference for long positions = Price holding above indicates trend strength
▶ Supertrend Line as Dynamic Resistance: In downtrends, the Supertrend line can act as trailing resistance level that falls with price, never rising = Use as potential stop-loss reference for short positions = Price holding below indicates trend weakness
🟢 Features
▶ Preconfigured Presets: Three optimized parameter sets for different trading approaches. "Default" provides balanced trend detection for swing trading on daily/4-hour charts with moderate sensitivity. "Fast Response" delivers quick trend change detection for intraday trading on 5-minute to 1-hour charts, capturing moves early with increased whipsaw potential. "Smooth Trend" focuses on strong sustained trends for position trading on daily/weekly timeframes, filtering noise to identify only major trend shifts.
▶ Built-in Alerts: Three alert conditions enable comprehensive automated monitoring of trend changes and momentum shifts. "Bullish Trend" triggers when price crosses above the Supertrend line and the trend state changes from bearish to bullish, signaling potential long entry opportunities. "Bearish Trend" activates when price crosses below the Supertrend line and the trend state changes from bullish to bearish, signaling potential short entry or long exit points. "Any Trend Change" provides a combined alert for any trend reversal regardless of direction, allowing traders to be notified of all momentum shifts without setting up separate alerts. These notifications enable traders to capitalize on trend changes and protect positions without continuous chart monitoring.
▶ Color Customization: Five visual themes (Classic, Aqua, Cosmic, Ember, Neon, plus Custom) accommodate different chart backgrounds and visual preferences, ensuring optimal contrast for identifying bullish versus bearish trends across various trading environments. The adjustable cloud fill transparency control (0-100%) allows fine-tuning of the gradient area prominence between the Supertrend line and price, with higher opacity values creating subtle background context while lower values produce bold trend zone emphasis. Optional bar coloring with adjustable transparency (0-100%) extends the trend color directly to the price bars themselves, providing immediate visual reinforcement of current trend direction without requiring reference to the Supertrend line, with transparency controls allowing users to maintain visibility of candlestick patterns while still showing trend context.

Sebastine All in One Indicator Sebastine All in One Indicator
Introduction
Markets speak in many dialects.
Sometimes they whisper through volume, sometimes they shout via momentum, at times they breathe through volatility, and occasionally they leave footprints in OBV, PVT, RSI, or TSI.
Most traders respond by stacking indicator after indicator—until the chart resembles a tangled fishing net.
This indicator was built to untangle that net.
Instead of plotting multiple indicators simultaneously, this tool lets you focus on one dimension of market behavior at a time, while preserving structure through a Darvas-style box framework.
The box logic used here is inspired by Darvas-style structural bounding, applied to non-price data such as volume, momentum, and volatility.
🔍 What This Indicator Does
• Combines Volume, OBV, PVT, RSI, Momentum, Volatility, TSI, and Supertrend
• Displays only one selected data stream at a time, reducing noise
• Wraps the selected indicator inside a dynamic Darvas-style box
• Highlights:
o Breakouts & breakdowns
o Compression (energy build-up)
o Structural shifts
o Momentum inflections
o Mean-reversion zones
Think of it as one lens, many filters—you rotate the lens, not clutter the chart.
🧠 How to Use It (Practical Insight)
• Volume / OBV / PVT → Institutional intent & accumulation/distribution
• Momentum / RSI / TSI → Strength, exhaustion, and early reversals
• Volatility → Expansion after contraction (the market’s deep breath)
• Supertrend (as data source) → Trend structure without price bias
The Darvas-style box adds context:
• Narrow boxes = stored energy
• Box expansion = energy release
• Source touching box edges = reaction zones
• Zero-line crossings = regime shifts (where applicable)
• 🎯 Who Is This For?
• Traders who want clarity over clutter
• Discretionary traders who adapt tools to market phase
• System builders seeking structure with flexibility
• Anyone who believes less noise = more signal
📝 Points to Note (Important for Proper Interpretation)
1. Color Coding & Structure
• The upper box line (green) represents the upper structural boundary
• The lower box line (red) represents the lower structural boundary
• The white step-line represents the selected source indicator (e.g., PVT, RSI, Momentum)
2. Pane Scaling & Visibility (Very Important)
• This indicator is designed for use in the bottom pane
• Different sources have very different numerical ranges:
o RSI is bounded between 0 and 100
o PVT, OBV, and Volume can have large absolute values
• Users should manually drag and scale the indicator vertically for optimal visibility
• This is intentional and preserves the raw integrity of each data source rather than force-normalizing it
3. Histogram for Comparative Insight
• A histogram of the selected source is included for quick visual comparison
• Helps identify expansion, contraction, acceleration, and divergence, especially during compression phases inside the box
📌 Recommended Usage (Clarity Over Clutter)
Although multiple sources are available, it is strongly recommended to use one chart with one selected source at a time for best clarity and analytical depth.
For first-time users, PVT (Price Volume Trend) is an ideal starting point.
It blends price movement and volume flow into a single continuous narrative and often reveals institutional participation earlier than price alone. PVT works especially well within the Darvas-style box framework.
Once comfortable, users may switch to RSI, Momentum, Volatility, OBV, or other sources—but always one at a time. This preserves the philosophy of focused observation rather than indicator overload.
🌱 Philosophy Behind the Tool
This indicator rewards patience and observation.Give it space.
It will quietly show when the market is gathering energy—and when it is ready to move.
Markets don’t change indicators. We change how we listen.
This indicator doesn’t predict. It reveals.
Think of it not as a dashboard, but as a rotating telescope—you change lenses, not skies.

Supertrend Nova Cloud [Pineify]Supertrend Nova Cloud
Overview
The Supertrend Nova Cloud is a sophisticated trend-following system designed to filter market noise and provide clear, actionable insights into market direction and volatility. By combining two distinct Supertrend calculations—the fast-acting "Nova" and the slower, more robust "Nebula"—this indicator creates a dynamic "Cloud" that visualizes the strength and stability of the current trend. It is engineered to help traders identify strong trending periods, potential pullbacks, and major reversals with greater confidence than a single Supertrend indicator.
Key Features
Dual-Trend Architecture: Utilizes a two-layer approach with a Fast (Nova) and Slow (Nebula) Supertrend to define market structure.
Dynamic Nova Cloud: A visual gradient fill between the two trendlines that adjusts its intensity ("Glow") based on the spread between the trends, representing market volatility.
Smart Candle Coloring: Candles are colored based on the consensus between the two trends, clearly distinguishing between strong trends, pullbacks, and recovery phases.
High-Quality Signals: Buy and Sell signals are filtered and only generated when the major (Slow) trend reverses, reducing false signals during chop.
Real-time Dashboard: An on-chart dashboard displays the current state of both the Nova and Nebula trends for instant analysis.
How It Works
The Supertrend Nova Cloud operates on the principles of Average True Range (ATR) volatility to determine trend direction.
Nova (Fast Trend): Calculated using a shorter ATR length (default 10) and a lower multiplier (default 2.0). This line reacts quickly to price changes, serving as an early warning system or trailing stop for aggressive entries.
Nebula (Slow Trend): Calculated using a longer ATR length (default 20) and a higher multiplier (default 4.0). This line defines the overall market bias and acts as significant support/resistance.
Cloud Gradient Logic: The script calculates the absolute difference (delta) between the Nova and Nebula lines. It compares this delta to its recent historical maximum to determine the opacity of the fill color. A wider spread (higher volatility) results in a brighter, more opaque cloud, while a narrow spread (consolidation) results in a more transparent cloud.
How multiple indicators work together
In trading, a single trend indicator often faces a dilemma: if it's too fast, it gives false signals; if it's too slow, it lags significantly. The Supertrend Nova Cloud solves this by combining both:
The Fast Supertrend captures immediate momentum and provides potential re-entry points during strong trends.
The Slow Supertrend acts as a filter. The script logic enforces that major reversal signals ("NOVA BUY/SELL") are only triggered when this slower, dominant trend changes direction.
By requiring the Slow trend to confirm the reversal, the indicator filters out the "noise" that would typically whip-saw a standard Supertrend.
Trading Ideas and Insights
Trend Riding: When the Cloud is fully Green (Strong Bull) or Red (Strong Bear), and the candles match this color, the trend is established. These are ideal conditions for holding positions.
Pullback Opportunities: If the candles turn a lighter shade (e.g., light red during an uptrend), it indicates the price has broken the Fast trend but holds above the Slow trend. This "Mixed" state often represents a buying opportunity in an uptrend (or selling in a downtrend).
Volatility Expansion: A widening cloud (brighter glow) indicates expanding volatility and often accompanies a strong breakout or trend acceleration.
Unique Aspects
Visual Volatility Feedback: Unlike standard fills, the "Nova Cloud" uses a custom algorithm to adjust transparency based on the relative distance between the two trendlines. This gives traders an intuitive sense of market expansion and contraction.
Nuanced State Detection: The script doesn't just show Up or Down. It identifies four states: Strong Bull, Strong Bear, Fast Bull/Slow Bear (Recovery), and Fast Bear/Slow Bull (Pullback), coding the candles accordingly.
How to Use
Entry: Look for "NOVA BUY" or "NOVA SELL" labels. These appear when the major trend (Nebula) flips, confirming a significant shift in market structure.
Stop Loss: The Nebula (thick) line serves as a robust trailing stop loss. As long as price holds beyond this line, the macro trend remains intact.
Re-Entry/Pyramiding: During a strong trend, if price dips into the cloud (changing candle color to mixed/neutral) and then resumes the trend color, it can be a valid re-entry signal.
Customization
Users can fully customize the indicator via the settings menu:
Nova & Nebula Settings: Adjust the ATR Length and Factor for both the Fast and Slow trends to tune sensitivity for different timeframes or assets.
Visuals: Toggle the Dashboard, Candle Coloring, and customize the colors for Bullish, Bearish, and Neutral states.
Conclusion
The Supertrend Nova Cloud offers a comprehensive visual interface for trend traders. By harmonizing two time horizons of volatility analysis into a single, cohesive display, it simplifies decision-making and helps traders stay on the right side of the major trend while identifying granular opportunities within it.

Trend Cloud with Buy/Sell Text [wjdtks255]Indicator Title: Trend Cloud with Buy/Sell Signal Pro
Short Description
A high-probability trend-following indicator based on Supertrend dynamics, enhanced with a Volume Filter to pinpoint explosive entries while minimizing false breakouts.
Detailed Description (Overview)
The Trend Cloud with Buy/Sell Text is designed for traders who prioritize clarity and momentum. It visualizes market trends through a "Trend Cloud" system and generates real-time BUY/SELL signals only when price action is backed by significant trading volume.
Key Technical Pillars
Dynamic Trend Cloud: Fills the area between the price and the Supertrend line, providing immediate visual feedback on trend strength and potential support/resistance zones.
Smart Volume Filter: A unique logic that compares current volume against a 20-period moving average. Labels only appear when a trend shift occurs with above-average volume, filtering out weak "fakeouts."
No-Repaint Labels: Signals are calculated and fixed at the close of the candle, ensuring that the BUY/SELL text remains permanent for reliable historical backtesting and live execution.
The Alpha Hunter Strategy (How to Trade)
1. Long Entry (Buy)
Condition: The cloud turns Aqua and a "BUY" label appears below the candle.
Confirmation: Ensure the price remains above the Aqua Trend Line.
Volume Check: The indicator automatically verifies if the volume is higher than the 20-period average before displaying the label.
Exit: Exit when a "SELL" signal appears or the price closes below the Aqua line.
2. Short Entry (Sell)
Condition: The cloud turns Red and a "SELL" label appears above the candle.
Confirmation: Price should stay below the Red Trend Line.
Exit: Exit when a "BUY" signal appears or the price closes above the Red line.
Input Parameters & Optimization
ATR Period (Default: 10): Determines the sensitivity to price volatility.
ATR Factor (Default: 3.0): Controls the distance of the trend line. Increase to 3.5 - 4.0 to reduce noise in choppy markets.
Volume Filter (Toggle): When enabled, only high-momentum signals are shown.
Recommended Usage
Best Timeframes: 15m, 1h, 4h.
Asset Classes: Highly effective for Crypto (BTC/ETH) and high-volume stocks.

Zero-Lag ATR Trend [BackQuant]Zero-Lag ATR Trend
Overview
Zero-Lag ATR Trend is a volatility-adaptive trend-following overlay designed to identify directional market regimes with minimal delay while preserving structural clarity. The indicator combines a zero-lag moving average framework with a zero-lag volatility model to produce a trailing trend line that reacts quickly to meaningful price changes without becoming unstable or overly sensitive.
Unlike conventional ATR-based trend tools that rely on lagging averages and delayed volatility estimates, this indicator applies zero-lag logic to both the trend centerline and the volatility calculation. The result is a trend structure that aligns more closely with real-time price action while still maintaining the discipline required for trend continuation trading.
Core design philosophy
The core idea behind Zero-Lag ATR Trend is simple:
Reduce signal delay without sacrificing trend integrity.
Adapt dynamically to changing volatility regimes.
Provide a single, clean structure that defines trend direction, continuation, and invalidation.
Instead of stacking multiple indicators, the script builds a complete trend framework from two tightly integrated components: a zero-lag trend spine and a zero-lag ATR trailing mechanism.
Zero-lag trend spine
The trend spine is constructed using a zero-lag moving average (ZLMA). This is achieved by applying a corrective step to a traditional moving average, effectively compensating for smoothing delay.
Conceptually, the process works as follows:
A base moving average is calculated from the selected price source.
That moving average is then passed through a zero-lag correction.
The correction pulls the line closer to current price without introducing noise.
This produces a trend line that reacts faster than standard EMA, SMA, or HMA signals, particularly during early trend acceleration phases. Multiple moving-average types can be used inside the zero-lag framework, allowing traders to fine-tune responsiveness based on asset behavior and timeframe.
Zero-lag volatility model
Volatility is measured using True Range, but instead of applying classic ATR smoothing, the indicator uses a zero-lag smoothing pass on the True Range itself.
This approach offers several advantages:
Volatility expands more quickly during impulse moves.
Volatility contracts faster during consolidations.
Band width adjusts in near real-time to changing conditions.
The smoothed zero-lag ATR is multiplied by a user-defined factor to create adaptive upper and lower boundaries around the trend spine. These boundaries define how much counter-movement price is allowed before the trend structure is invalidated.
Volatility-aware trailing structure
The trailing output is the defining feature of the indicator. It behaves as a one-directional trailing structure:
In bullish conditions, the trailing line can only move upward.
In bearish conditions, the trailing line can only move downward.
Minor pullbacks inside the volatility envelope do not flip the trend.
This logic prevents the indicator from reacting to shallow retracements and focuses instead on structural trend changes. Because the trailing behavior is volatility-scaled, the indicator remains stable during high volatility while still responding promptly during regime shifts.
Trend flips and regime transitions
Trend direction is determined by changes in the trailing structure itself rather than raw price crosses. A trend flip occurs only when price movement is strong enough, relative to current volatility, to force the trailing line to reverse direction.
This means:
Bullish flips represent genuine transitions into upward regimes.
Bearish flips represent genuine transitions into downward regimes.
Sideways noise is largely filtered out.
As a result, the indicator is well suited for identifying medium-to-long trend phases rather than short-term oscillations.
Visual structure and chart clarity
The visual design is intentionally minimal and functional:
The main trailing line is color-coded by trend direction.
An optional ribbon or cloud reinforces directional bias.
Optional candle coloring aligns price bars with the active trend.
These elements allow traders to assess trend state instantly without interpreting multiple signals or overlays.
How to use for trend following
Trend bias
Maintain a bullish bias while price holds above the trailing line.
Maintain a bearish bias while price holds below the trailing line.
Entries
Trend flips can be used as initial directional entries.
Pullbacks toward the trailing line often act as continuation opportunities.
Momentum confirmation can be layered on top for additional confluence.
Trend management
The trailing line naturally functions as a dynamic stop reference.
As long as price respects the trailing structure, the trend remains valid.
A flip in direction signals a full regime transition rather than a minor correction.
Why zero-lag matters for trend trading
Traditional trend indicators often react late, especially during fast expansions, resulting in delayed entries and early exits. By reducing lag in both the trend calculation and the volatility model, Zero-Lag ATR Trend aims to capture a larger portion of directional moves while maintaining consistency and discipline.
This makes it particularly effective for momentum-based trend following, breakout continuation strategies, and traders who prioritize staying aligned with dominant market structure rather than predicting reversals.
Summary
Zero-Lag ATR Trend is a complete trend-following framework built around responsiveness, adaptability, and clarity. Its zero-lag architecture allows it to respond earlier to meaningful price changes, while its volatility-aware trailing logic ensures that trends are only invalidated when structure truly breaks. The result is a clean, intuitive tool that supports disciplined trend participation across assets and timeframes.

AlphaStrike: Zen ModeDescription:
1. The Philosophy: Reducing Cognitive Load Modern charts are often cluttered with dozens of noisy lines (Bollinger Bands, Moving Averages, Oscillators) that lead to "Analysis Paralysis." This script is designed with a "Zen" philosophy: P rocess the complexity in the background, but display only the decision.
This is not a simple indicator overlay. It is a Risk-Based Trading Engine that runs multiple validation checks (Momentum, Volatility, and Price Action) simultaneously but hides the underlying calculations to keep the chart clean. It focuses the trader's attention on the two things that matter most: Trend Direction and Position Sizing.
2. The "Invisible" Technical Engine The script operates on a Dual-State Logic system that adapts to market conditions. It uses standard indicators as filters, not just visuals.
A. Trend State (The Backbone) The script calculates a volatility-adjusted Trend Baseline (SuperTrend).
Green State: The market is in a markup phase. The script looks for continuation.
Red State: The market is in a markdown phase. The script looks for defense.
B. The "Confluence" Reversal Logic Instead of cluttering the screen with Bollinger Bands and RSI windows, the script performs these checks internally:
Condition 1 (Volatility): Is price extending beyond the 2.0 Standard Deviation (Bollinger Lower/Upper)?
Condition 2 (Momentum): Is RSI overextended (<35 or >65)?
Condition 3 (Price Action): Is there a specific Pin Bar candle pattern (Long wick rejection)?
Result: Only when all three conditions align does the script print a "Reversal Circle." This filters out weak signals that usually occur in strong trends.
3. The Risk Management Calculator (Key Feature) Most traders fail not because of bad entries, but because of inconsistent sizing. This script features a built-in Dynamic Position Sizing Dashboard located in the bottom right.
Adaptive Stop Loss:
In a Trend: The Stop Loss is automatically set to the Trend Line (SuperTrend).
In a Reversal: The script internally scans for the nearest Swing Low/High (using hidden Pivot calculations) and sets the Stop Loss there.
Position Sizing Math: The dashboard reads your Account Size and Risk % inputs. It instantly calculates the "Max Size" (contract/share amount) allowed for the current trade.
Formula: Position Size = (Account Value * Risk %) / Distance to Stop.
Benefit: This ensures you risk the exact same dollar amount on every trade, whether the stop loss is 1% away or 10% away.
4. How to Read the Signals
Triangles (Breakouts): These represent a shift in the dominant trend direction.
Green Triangle: Bullish Trend Start.
Red Triangle: Bearish Trend Start.
Circles (Mean Reversion): These are high-probability counter-trend plays.
Blue Circle: Buy Reversal (Oversold + Pinbar + Bollinger Support).
Orange Circle: Sell Reversal (Overbought + Pinbar + Bollinger Resistance).
5. Settings
Trend Settings: Adjust the ATR Period and Factor to change the sensitivity of the trend line.
Reversal Settings: Tweak the RSI and Bollinger thresholds to filter out more/less signals.
Risk Management: Input your total Account Size and desired Risk Per Trade (e.g., 1%) to calibrate the Dashboard.
Disclaimer This tool provides algorithmic analysis and risk calculations. It does not guarantee profits or provide financial advice. Always verify position sizes before executing.

Hybrid ST/EMA Cloud + Trend TableSimilar to the hybrid supertrend with trend table, this version adds some EMA preferences

Kalman Exponential SuperTrendThe Kalman Exponential SuperTrend is a new, smoother & superior version of the famous "SuperTrend". Using Kalman smoothing, a concept from the EMA (Exponential Moving Average), this script leverages the best out of each and combines it into a single indicator.
How does it work?
First, we need to calculate the Kalman smoothed source. This is a kind of complex calculation, so you need to study it if you want to know how it works precisely. It smooths the source of the SuperTrend, which helps us smooth the SuperTrend.
Then, we calculate "a" where:
n = user defined ATR length
a = 2/(n+1)
Now we calculate the ATR over "n" period. Classical calculation, nothing changed here.
Now we calculate the SuperTrend using the Kalman smoothed source & ATR where:
kalman = kalman smoothed source
ATR = Average True Range
m = Factor chosen by user.
Upper Band = kalman + ATR * m
Lower Band = kalman - ATR * m
Now we just smooth it a bit further using the "a" and a concept from the EMA.
u1 = Upper Band a bar ago
l1 = Lower Band a bar ago
u = Upper Band
l = Lower Band
Upper = u1 * (1-a) + u * a
Lower = l1 * (1-a) + u * a
When the classical (not Kalman) source crosses above the Upper, it indicates an uptrend. When it crosses below the Lower, it indicates a downtrend.
Methodology & Concepts
When I took a look at the classical SuperTrend => It was just far too slow, and if I made it faster it was noisy as hell. So I decided I would try to make up for it.
I tried the gaussian, bilateral filter, but then I tried kalman and that worked the best, so I added it. Now it was still too noisy and unconsistent, so I revisited my knowledge of concepts and picked the one from the EMA, and it kinda solved it.
In the core of the indicator, all it does is combine them in a really simple way, but if you go more deeply you see how it fits the puzzlé really well.
It is not about trying out random things´=> but about seeking what it is missing and trying to lessen its bad side.
That is the entire point of this indicator => Offer a unique approach to the SuperTrend type, that lessen the bad sides of it.
I also added different plotting types, this is so everyone can find their favorite
Enjoy Gs!
Thanks @BackQuant for making a open source Kalman code <3

Adaptive Bull Ratio Strategy█ Overview: Why This Strategy
Most option strategies fall into two traps:
They are too rigid: A "Call Ratio Spread" works great in slow markets but gets destroyed if the market rallies hard.
They are too simple: A simple "Buy Call" suffers from time decay (Theta) if the market chops sideways.
The Adaptive Bull Ratio Strategy solves both . It is a living strategy that "shifts gears" based on price action.
It is called "Adaptive" because it morphs its structure three times during a trade. It starts conservative to harvest Time Decay, but if the market explodes upwards, it "uncaps" itself to ride the trend aggressively.
█ The Entry Philosophy: Why Supertrend?
The default setting uses the Supertrend indicator as the trigger. This is intentional:
Volatility Awareness: Supertrend adapts to market noise using ATR. In high volatility, bands widen to prevent false entries.
Trend Confirmation: Since Phase 1 involves selling options, entering "too early" against a falling market is dangerous. Supertrend forces patience, waiting for a confirmed reversal (Close > Trend Line), ensuring the momentum is actually in your favor before you commit capital.
The "Drift" Benefit: This strategy excels in markets that "drift" upwards. Supertrend identifies these trends while filtering out short-term chop.
Flexibility with External Sources:
While Supertrend is the default, the strategy is designed to be flexible. You can enable the 'Enable External Source' option in the settings to plug in any custom indicator (e.g., Moving Averages, Parabolic SAR, or a proprietary trendline).
The Golden Rule for External Sources: The script interprets a Bullish Signal whenever your External Source line is below the Close price (Ext Source < Close).
Compatibility: As long as your custom indicator behaves like a support line in an uptrend (plotting below the candles), it will work seamlessly with this strategy's logic.
█ The "Long Only" Rationale: Avoiding the Volatility Trap
Why not trade this on the short side (Puts) during crashes?
The Volatility Trap (Vega Risk): In Bull markets, Implied Volatility (IV) usually drops, helping your sold options decay faster. In Bear markets, IV explodes (panic). Selling OTM Puts during a crash is dangerous as their value skyrockets, neutralizing gains.
Velocity Risk: Bear markets crash fast ("Elevator Down"). Prices can blow through adjustment levels faster than the strategy can safely roll down, causing slippage.
Structural Skew: OTM Puts are inherently more expensive. Buying expensive ITM Puts and selling expensive OTM Puts shifts the breakeven further away, making V-shape recoveries painful.
█ How It Works & Stands Out
This strategy actively transforms risk profiles based on market movement:
Phase 1: The "Safe" Start (Entry)
Setup: Initiates a Call Ratio Spread (Buy 2 ITM, Sell 4 OTM) + Protective Puts.
Logic: Profits from sideways drift or slow rallies via Time Decay (Theta). The sold options finance the trade.
Phase 2: The "Shift" (Adjustment Level 1)
Trigger: Market moves above Leg 2 (3 OTM Call).
Action: Rolls Up the position. Exits initial legs, enters new higher legs, and adds a Short Put to finance the roll.
Impact: Aggressive. You bet the trend is strong enough to support the added downside risk of the short put.
Phase 3: The "Uncap" (Adjustment Level 2)
Trigger: Market moves above Leg 3 (4 OTM Call).
Action: Exits all Sold Calls.
Impact: Uncaps profit potential. The trade becomes a Net Long position (Long Calls + Short Puts), allowing you to ride a massive rally without a ceiling.
Phase 4: The "Lock-In" (Optional Trail Adjustment)
Trigger: The market goes parabolic (price rises X levels above Leg 3, configurable in settings).
Action (If Enabled):
Call Adj: Exits the Phase 3 calls and buys fresh 1-OTM calls (Rolling Up to lock profits).
Put Adj: Exits all Put legs (Removing downside risk completely).
Impact: Maximum Safety. This phase is about "banking" the windfall from a massive rally and leaving a smaller, risk-free runner to capture any final extension.
█ How to Start: A Quick Setup Guide
Step 1: Map Expiry Dates
Manually input your trading expiry dates in Settings -> Expiry Management.
Format: YYYY-MM-DD (e.g., 2025-12-25). Strict adherence required for DhanHQ.
Step 2: Configure Symbol & Size
Exchange/Symbol: Enter NSE and NIFTY (or your ticker).
Lot Multiplier: Default is 1. Set to 2 to double all quantities (e.g., Buy 2 becomes Buy 4).
Step 3: Understand Visuals
Entry Window (Light Blue): Strategy is scanning for new trades.
Non-Entry Window (Dark Blue): Trading blocked (Day before Expiry & Expiry Day). Only management allowed.
Green Box: Valid Late Entry Zone.
Red Dashed Line: Invalidation Level (if price touches this, no late entry).
Fuchsia Line: Trigger level for Special Trail Adjustments (Phase 4).
IMPORTANT: Broker & Technology Heads-Up:
The alerts generated by this script ({"secret": "...", "alertType": "multi_leg_order"...}) are specifically formatted for the DhanHQ webhook structure.
Dhan Users: Plug-and-play.
Other Brokers: You need middleware (NextLevelBot, Quantiply) to parse the JSON.
█ Risk Disclaimer & Advice
Trading options involves substantial risk.
The Whipsaw Risk: In Phase 2, you are Long Calls and Short Puts. A sharp reversal causes losses on both sides.
Margin: Selling options requires significant margin. Keep a 15-20% cash buffer to handle adjustments instantly.
Testing: This strategy is optimized for NIFTY Weekly Options. Effectiveness on BankNifty or Stocks is untested and may require parameter tuning.
Advice:
Backtest: Use TradingView Replay.
Paper Trade: Run for at least one expiry cycle before live deployment.
Consult: Seek professional financial advice before trading.
Practical Tips for Smooth Execution
For a new trader deploying this system, these operational tips are vital:
Capital Buffer: Do not trade at your limit. Always keep 10-15% free cash in your broker account. Adjustments (specifically Phase 2, where you sell an extra Put) require additional margin instantly. If margin is short, the order fails, and your hedge breaks.
Liquidity Awareness : The script trades "Far Deep OTM" options (Leg 4) to reduce margin. On indices like Nifty/BankNifty, this is fine. On individual stocks, these deep strikes might be illiquid. Check the option chain volume before deploying on stocks.
Trust the Process (but Verify) : While the algo drives, you are the pilot.
Check your API connection every morning.
Ensure the "Entry Window" background color on the chart matches your real-world date.
Verify that your broker executed all legs of a multi-leg order (partial fills are rare but possible).
The "Human" Stop: If major news breaks (e.g., unexpected election results, war announcements), volatility can expand faster than any algo can react. It is acceptable—and smart—to pause the strategy during known "Black Swan" events or earnings releases.
█ Timeframe Selection: The 30-Minute Standard
Critical Requirement: This indicator must be applied to a 30-minute chart.
Why?
Noise Filtering: The Supertrend logic is tuned to capture multi-day trends. Lower timeframes (5m, 15m) are full of "noise"—random fluctuations that look like trend changes but aren't.
Execution Logic (The Hybrid Engine): The script has a built-in "Dual Timeframe" architecture.
Decision Layer (30m): Uses the chart timeframe to decide when to be Bullish or Bearish.
Execution Layer (5m): Internally fetches 5-minute data to manage the how (Adjustments, Late Entries, and precise invalidation).
The Risk of Lower Timeframes: If you run the main chart on 5-minutes, you destroy this hierarchy. You will get too many signals, pay too much brokerage, and the internal logic may behave erratically.
Recommendation: Always keep your TradingView chart interval at 30m. Do not switch to lower timeframes expecting "faster" signals; you will likely just get "false" signals.
█ Testing Scope, Feedback
⚠️ Important Note on Asset Classes:
This strategy logic and the associated strike step calculations have been rigorously tested ONLY on NIFTY Index Options with Weekly Expiry.
BankNifty / Sensex / FinNifty: The volatility characteristics (ATR) and strike intervals of these instruments differ significantly from NIFTY. The effectiveness of this strategy on these other scripts has not been verified and may require different parameter tuning (e.g., strike_step or ATR Length).
Stocks: Individual stock options often lack the liquidity required for the "Deep OTM" legs, leading to potential execution failures.
We encourage traders to backtest this logic on other indices and share their findings! If you find a robust parameter set for BankNifty or observe unique behaviors on other scripts, please let us know in the comments below so we can improve the algorithm for everyone. Your feedback is appriciated.

Hybrid Super Trend & Trend Tablea combination of 3 supertrends into 1 trend line, plus 2 ema lines and a timeframe trend table.

Apex Adaptive TrailApex Adaptive Trail: Adaptive Volatility Trend System
This custom trend-following indicator improves on standard SuperTrend implementations by addressing two key weaknesses: excessive whipsaws during high volatility and false signals in ranging markets.
Core Logic:
- Synthetic Heikin Ashi values are calculated internally (without changing chart candles) to provide smoother source data for trend detection.
- ATR-based trailing stop with adaptive multiplier: dynamically adjusts between 0.8x and 1.5x the base factor based on current volatility (ATR / 50-period SMA of ATR). Widens in volatile conditions, tightens in quiet markets.
- Weighted Confluence Score (0-100%): Combines four independent filters, each contributing 25%:
• Price position relative to 21-period EMA (trend alignment)
• ADX > 20 (momentum strength)
• Choppiness Index < 60 (trending vs ranging detection)
• Alignment with Daily EMA(50) trend direction
Signals are only generated when price crosses the adaptive trail AND the confluence score exceeds 75% (standard) or 90% (MAX 🔥 ultra-strong). This combination significantly reduces low-quality entries compared to traditional SuperTrend crossovers.
Key Features:
- Dynamic confidence cloud (opacity based on score)
- Real-time dashboard showing volatility state, active filters, trend bias, and estimated historical win rate
- Optional dynamic/fixed profit targets
- Fully customizable filters and adaptive behavior
Usage: Best on 15m to 4H timeframes for trend-following strategies (Crypto, Forex, Indices). Enter on APEX signals, use trail as stop-loss, TP lines for partial exits.
This script integrates established concepts into a unique adaptive framework with volatility-responsive risk management and multi-filter validation.
Disclaimer: For educational and analysis purposes only. Past performance is not indicative of future results. Always use proper risk management.
"This script combines established indicators (ATR trailing, ADX, Choppiness Index, EMA, MTF) into a unique adaptive system with dynamic volatility adjustment and weighted confluence scoring – features not found together in standard SuperTrend variations."

Supertrend BUY Only - Optimized for Gold M15 TimeframeOverview
The Supertrend BUY Only - Production Optimized is a high-performance trend-following indicator specifically tuned for XAUUSD (Gold) on the 15-minute timeframe. Unlike standard Supertrend scripts, this version focuses exclusively on bullish cycles to align with long-term upward bias and uses parameters discovered through deep data analysis of over 20,000 bars of historical market data.
Key Features
Data-Optimized Parameters: Defaults are set to ATR Period 7 and Multiplier 2.1, which backtesting has shown to provide a superior balance between sensitivity and noise reduction for Gold.
Production-Ready Alerts: Includes built-in alertcondition triggers for both BUY (Trend Flip) and STOP BUY (Trend Exit), complete with dynamic messages that include price and interval.
Trailing Support Band: Uses a trailing logic that locks in support levels during upward moves, preventing the band from dropping until the trend officially reverses.
Clean Visuals: Focuses on chart clarity by only plotting the support line during active uptrends and utilizing clean shape labels for entries and exits.
How to Use
Entry (BUY): When the Supertrend line flips from Red to Green and a "BUY" label appears. This indicates bullish momentum has overcome recent volatility.
Exit (STOP BUY): When the price closes below the Green support line. The indicator will plot a red "X" and clear the green background.
Setting Alerts: * Click the Alerts icon in TradingView.
Select this indicator under "Condition."
Choose "BUY Signal" for entries and "STOP BUY / EXIT" for managing your trade or taking profit.
Technical Details
The script allows users to toggle between the TradingView (RMA) ATR calculation and the Standard (SMA) method. For production and live trading, the RMA method is recommended as it provides a smoother response to volatility spikes common in the Gold market.

Next Candle PredictorAdvanced TradingView Indicator for Precise Buy and Sell Signals
Overview:
The Predicta Futures - Next Candle Predictor is a cutting-edge TradingView indicator designed to forecast the next candle's direction in futures and cryptocurrency markets. Leveraging a multi-indicator confluence strategy, this tool provides traders with actionable long and short prediction percentages, enhanced by dynamic ADX-based thresholds and visual projection candles. Ideal for scalping, day trading, or swing trading on platforms like MEXC or Binance futures, it combines Supertrend, MACD, RSI, Stochastic, ADX, and volume analysis to deliver high-probability buy and sell signals while minimizing false positives.
Key Features:
• Multi-Indicator Confluence Scoring:
Integrates Supertrend for trend direction, EMAs (8, 21, 50) for alignment, MACD for momentum crossovers, RSI for overbought/oversold conditions, Stochastic for divergence detection, ADX for trend strength, and volume ratios for confirmation. A customizable confluence score (0-6) ensures signals meet user-defined criteria, reducing whipsaws in volatile markets.
• Dynamic Prediction Thresholds:
ADX-driven adjustments lower the required prediction percentage (e.g., 60% in strong trends) for "PERFECT TIME" entries, adapting to market conditions like ranging or trending phases.
• Visual Analysis Table:
A sleek, color-coded dashboard displays progress bars for each indicator, prediction percentages, and status (e.g., "PERFECT TIME" or "WAIT"). Supports long and short analyses with intuitive ASCII bars for quick scans.
• Projection Candles:
Simulates potential next-candle outcomes with volatility-scaled (via Bollinger Bands width) green long and red short candles, aiding in visualizing price targets.
• Buy/Sell Signals and Alerts:
Generates labeled "BUY" and "SELL" arrows on EMA crossovers within confirmed trends, with separate alerts for basic signals and high-confluence "PERFECT TIME" opportunities.
• Customizable Inputs:
Adjust ATR periods, Supertrend factors, minimum confluence scores, and volume ratios to tailor the indicator for stocks, forex, or crypto perpetual futures.
How It Works:
This TradingView script calculates long and short scores using weighted contributions from key indicators, normalizing them into prediction percentages. A confluence check—factoring trend, EMA alignment, MACD, Stochastic, volume, and ADX—triggers "PERFECT TIME" only when conditions align robustly. For example:
• In a downtrend (Supertrend red), with bearish MACD and Stochastic, and sufficient volume, the indicator highlights short opportunities.
• Dynamic thresholds ensure aggressive entries in strong trends (ADX >25) and conservative ones in weak trends.
• Backtested for reliability, it excels in identifying reversals and continuations, making it a must-have for traders seeking an edge in futures trading strategies.
Usage Instructions:
1. Add the indicator to your TradingView chart. (Search: Next Candle Predictor)
2. Customize settings via the inputs panel (e.g., set minConfluence to 5 for stricter signals).
3. Monitor the analysis table for predictions and confluence scores.
4. Act on "BUY/SELL" labels or "PERFECT TIME" alerts, combining with your risk management.
5. Enable projection candles for visual forecasting of the next bar.
Compatible with all timeframes, from 1-minute scalping to daily swings. Note: This is not financial advice; always verify signals with additional analysis.
Join thousands of traders enhancing their strategies—add it to your charts today and elevate your trading performance!
Please rate and review if it boosts your trades!
Thank you!

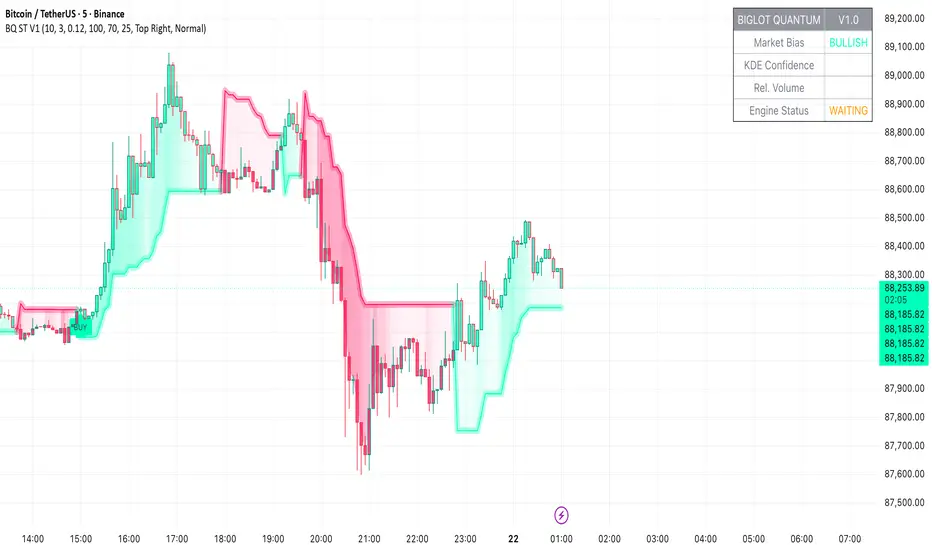
BigLot Quantum SuperTrend V1BigLot Quantum SuperTrend V1 is a trend-following indicator that enhances the traditional SuperTrend by integrating statistical volume analysis.
The script combines an ATR-based SuperTrend engine with Kernel Density Estimation (KDE) applied to relative buy and sell volume. Volume behavior is modeled statistically, allowing the indicator to filter breakout signals and activate only when volume conditions show high probability compared to historical data.
Bullish and bearish signals are generated when price crosses the SuperTrend line and the corresponding volume probability exceeds a user-defined threshold. This approach helps reduce false signals during low-liquidity or sideways market conditions.
The script includes visual trend highlighting, probability-based confidence filtering, and a real-time dashboard displaying trend direction, volume strength, and signal status. It is designed to work across all markets and timeframes without repainting.
SIDD EMA RSI Supertrend Signal Table🔥 SIDD EMA RSI SuperTrend Multi-Timeframe Signal Table
**SIDD EMA RSI SuperTrend Signal Table** is a **clean, powerful multi-timeframe trend confirmation dashboard** designed for traders who want **clarity, confluence, and speed** — all in one glance.
This indicator **does NOT repaint** and uses **industry-standard trend logic** combining **EMA structure, RSI momentum, and SuperTrend direction** across **6 different timeframes**.
---
## 🧠 Core Logic Behind the Indicator
This script works on **three independent trend engines**, displayed together in a compact table:
### ✅ 1️⃣ EMA Trend (Structure Based)
* Uses **EMA 50 vs EMA 200**
* **Bullish** → EMA 50 above EMA 200
* **Bearish** → EMA 50 below EMA 200
* Captures **primary market structure**
### ✅ 2️⃣ RSI Trend (Momentum Based)
* RSI Length: **14**
* **Bullish** → RSI > **55**
* **Bearish** → RSI ≤ **55**
* Helps confirm **trend strength & momentum**
### ✅ 3️⃣ SuperTrend (Price Action Based)
* ATR Length: **10**
* Factor: **3.0**
* Clearly defines **trend direction & trailing bias**
* Excellent for **entry & exit alignment**
---
## ⏱️ Multi-Timeframe Coverage
The table analyzes trends across **6 configurable timeframes**:
* Intraday → **5m, 15m, 1H**
* Swing → **4H, Daily**
* Positional → **Weekly**
Each timeframe shows:
* 📈 EMA Trend
* 📊 RSI Trend
* 🔁 SuperTrend Direction
Color-coded for instant readability:
* 🟢 Bullish
* 🔴 Bearish
* ⚪ Neutral
---
## 🎯 How to Use This Indicator
✔ **Trend Trading**
Trade only when **EMA + RSI + SuperTrend align** across higher & lower timeframes.
✔ **Intraday Confirmation**
Use higher TF (1H / 4H) bias and take entries on lower TF.
✔ **Avoid Chop & False Signals**
If signals are mixed → market is likely **sideways or risky**.
✔ **Swing & Positional Trades**
Daily + Weekly alignment gives **high-probability setups**.
---
## ⚙️ Customization Options
* Adjustable **timeframes**
* Table **position** (Top/Bottom – Left/Right)
* Table **size** (Extra Small / Small / Normal)
* Custom **colors, borders & text**
* Optimized for **minimal chart clutter**
---
## ⚠️ Disclaimer
This indicator is a **trend confirmation & decision-support tool**.
Always combine with **price action, support/resistance, and proper risk management**.

Trend Tracer [AlgoAlpha]🟠 OVERVIEW
This tool builds a two-stage trend model that reacts to structure shifts while also showing how strong or weak the move is. It uses a mid-price band (from the highest high and lowest low over a lookback) and applies two Supertrend passes on top of it. The first pass smoothens the basis. The second pass refines that direction and produces the final trail used for signals. A gradient fill between the two trails uses RSI of price-to-trail distance to show when price is stretched or cooling off. The aim is to give traders a simple way to read trend alignment, pressure, and early turns without guessing.
🟠 CONCEPTS
The script starts with a mid-range basis. This is the average of the rolling highest high and lowest low. It acts as a stable structure reference instead of raw close or typical price. From there, two Supertrend layers are applied:
• The first Supertrend uses a shorter ATR period and lower factor. It reacts faster and sets the main regime.
• The second Supertrend uses a slightly longer ATR and higher factor. It filters noise, waits for confirmed continuation, and generates the signal line.
The interaction between these trails matters. The outer Supertrend provides context by defining the broader regime. The inner Supertrend provides timing by flipping earlier and marking possible shifts. The gradient fill uses RSI of (close − supertrend value) to display when price stretches away from the trail. This shows strength, exhaustion, or compression within the trend.
🟠 FEATURES
Bullish and bearish flip markers placed at recent highs/lows
Rejection signals off the trend tracer line
Alerts for bullish and bearish trend changes
🟠 USAGE
Setup : Add the script to your chart. Timeframe is flexible; lower timeframes show more flips while higher ones give cleaner swings. Adjust Length to change how wide the basis range is. Use the two ATR settings and factors to match the volatility of the market you trade.
Read the chart : When the refined trail (stv_) sits above price the regime is bearish; when below, it is bullish. The wide trail (stv) confirms the larger move. Watch the gradient fill: darker colors appear when price is stretched from the trail and lighter colors appear when the move is weakening. Flip markers ▲ or ▼ highlight the first clean shift of the refined trail.
Settings that matter : Increasing the Main Factor slows main-trend flips and filters chop. Increasing the Signal Factor delays the timing trail but reduces noise. Shortening Length makes the basis more reactive. ATR periods change how sensitive each Supertrend pass is to volatility.
