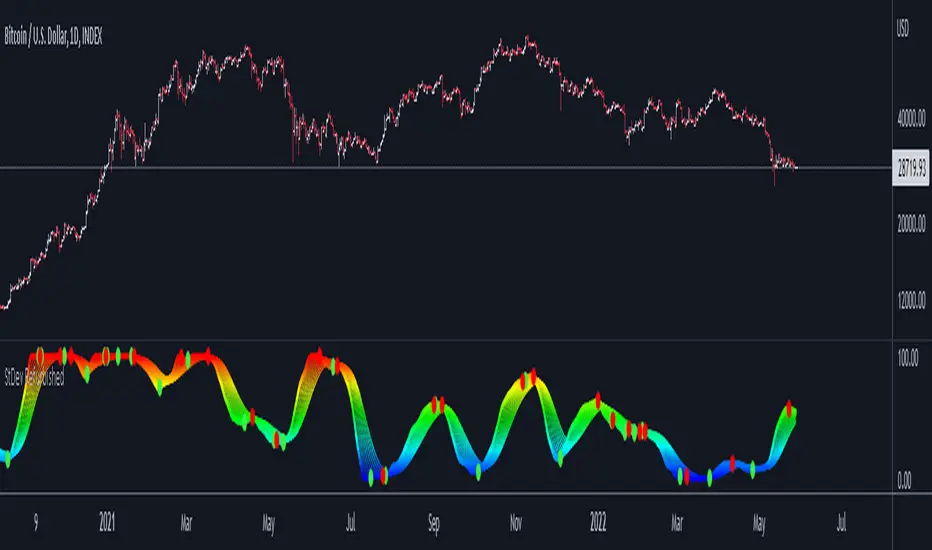
Standard Deviation Refurbished█ Standard Deviation Refurbished
This is an indicator that serves to show the standard deviation in a more improved and less trivial form.
Basically, I put the option to normalize the indicator in a range of 0 to 100.
I also put 10 moving averages of standard deviation.
In the graphic part was placed the choice of themes.
Gratitude to the author 'The_Caretaker' by the themes 'Spectrum Blue-Green-Red' and 'Spectrum Blue-Red'.
█ Concepts
"Standard Deviation is a way to measure price volatility by relating a price range to its moving average. The higher the value of the indicator, the wider the spread between price and its moving average, the more volatile the instrument and the more dispersed the price bars become. The lower the value of the indicator, the smaller the spread between price and its moving average, the less volatile the instrument and the closer to each other the price bars become. Standard Deviation is used as part of other indicators such as Bollinger Bands. It is often used in combination with other signals and analysis techniques."
(TradingView)
Desviación estándar (volatilidad)
Z-Score DeltaHeavily modified from Z Score by jwammo12
Compares the z-score of two assets, the onscreen one and the reference one configured. If you're familiar, you can think of it as Bollinger Band Percent of Onscreen Asset minus the Bollinger Band Percent of Reference Asset.
It's compared off a simple moving average, due to how standard deviation is calculated.
I view this a more literal meaning of relative strength.
Has the ability to offset or delay in time one to another.
TODO: add MAD and MAD/STD.DEV views
Not my greatest work, but it's functional.

Price Clouds Oscillator (PCO)This is the oscillator version of Price Clouds (PS). Use this with (PS) for best results.
This indicator shows you over bought and over sold regions similarly to to rsi or stochastic. This indicator centers a moving average around the hl2 of the price. This is calculated as the difference of four moving averages. The signal line shows you how much momentum in any given direction you have. You can also see how much volatility there is by the band width. Just like the Bollinger band high volatility comes before low volatility and visa versa. You can also see what the market is doing based on the signal crosses. If the fast line is above the slow line you are going up and visa versa. This indicator works in most markets, especially crypto. There is a tool tip for every aspect of this indicator explaining how everything works.
Key Feature:
>See where the price is relative to a mean price
>Measure volatility
>Clean global settings
>Normalization feature lets you scale the band from 0 to 1. You loose some information but its easier to use if you aren't measuring volatility.
I hope you are very profitable with this one!
If you find this indicator is useful to you, Star it, Follow, Donate, Like and Share.
Your support is a highly motivation for me.
PCO
----------------------/\-----
-------------/\----/----\---
\----------/----\/--------\-
--\------/------------------
----\_/---------------------

CHOPperIt is based on the Choppiness Index indicator. It can show you when the market is in range. If the lines are below the lower band, it can be a strong trend, if it is inside the 2 bands, it is considered to be a choppy market, and if it is crossed down the upper band, it can be a developing trend.
This indicator does not show you the trend direction! This may be used as a confirmation indicator.
The improvements this indicator provides over the original:
It uses ATR instead of just TR (if ATR length is 1, it is the original TR)
It uses my ATRWO (ATR Without Outliers) indicator inside, which can remove extreme highs and lows from calculation. You can tune this by the "ATRWO STDev Mult" parameter. Higher value means more outliers are allowed.
It has 2 lines, one uses ATR(WO) (the blue one), which can be similar to the original Choppiness Index, the other uses standard deviation (the teal one).
The 2 lines can be used together, or you can hide one of them.

Trendlines with Breaks [LuxAlgo]The trendlines with breaks indicator return pivot point based trendlines with highlighted breakouts. Users can control the steepness of the trendlines as well as their slope calculation method.
Trendline breakouts occur in real-time and are not subject to backpainting. Trendlines can however be subject to repainting unless turned off from the user settings.
The indicator includes integrated alerts for trendline breakouts.
🔶 USAGE
Any valid trendlines methodology can be used with the indicator, users can identify breakouts in order to infer future price movements.
The calculation method of the slope greatly affects the trendline's behaviors. By default, an average true range is used, returning a more constant slope amongst trendlines. Other methods might return trendlines with significantly different slopes.
Stdev makes use of the standard deviation for the slope calculation, while Linreg makes use of the slope of a linear regression.
The above chart shows the indicator using "Stdev" as a slope calculation method. The chart below makes use of the "Linreg" method.
By default trendlines are subject to backpainting, and as such are offset by length bars in the past. Disabling backpainting will not offset the trendlines.
🔶 SETTINGS
Length: Pivot points period
Slope: Slope steepness, values greater than 1 return a steeper slope. Using a slope of 0 would be equivalent to obtaining levels.
Slope Calculation Method: Determines how the slope is calculated.
Backpaint: Determine whether trendlines are backpainted, that is offset to past.

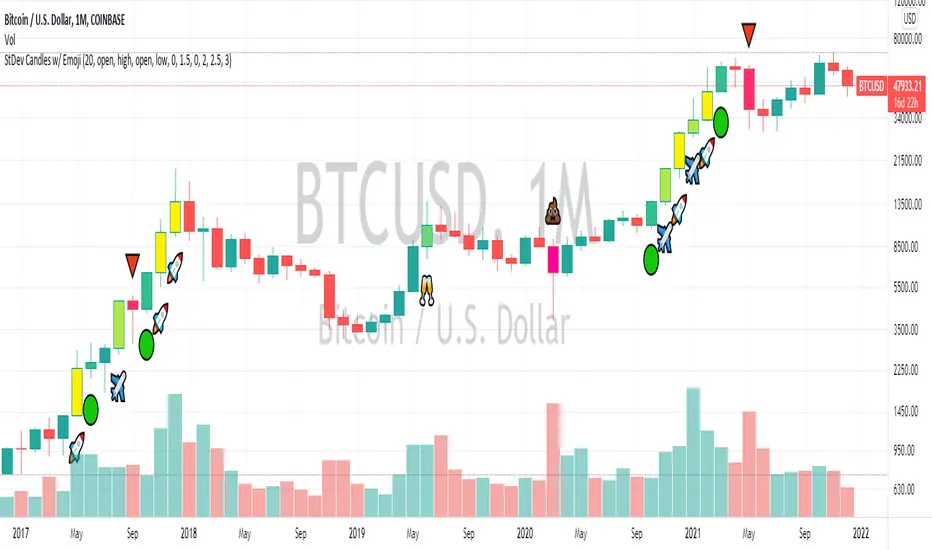
Standard Deviation Candles (With Emoji)In crypto, significant price moves can be a sign of continuation or reversal. This script measures if price move is greater than a certain number of standard deviations vs. previous periods, then alters bar colours and/or prints an emoji signal.
DMI & ST DEV zone intersection [LM]Hello Traders,
This indicator uses two indicators st dev extremes and DMI extremes and visualize intersection of both indicators extreme zones using crosses. It means where cross is rendered intersection of extremes has occurred.
The standard deviation uses the same calculation as my Standard deviation zones Support & Resistance indicator, DMI indicator measures both the strength and direction of a price movement. I am using both indicators to find the intersection of extreme zones between them.
ST DEV settings:
source
tops setting
bottom setting
DMI settings:
length settings
extreme zone setting
Enjoy,
Lukas

Ultimate Moving Average Bands [CC+RedK]The Ultimate Moving Average Bands were created by me and @RedKTrader and this converts our Ultimate Moving Average into volatility bands that use the same adaptive logic to create the bands. I have enabled everything to be fully adjustable so please let me know if you find a more useful setting than what I have here by default. I'm sure everyone is familiar with volatility bands but generally speaking if a price goes above the volatility bands then this is either a sign of an extremely strong uptrend or a potential reversal point and vice versa. I have included strong buy and sell signals in addition to normal ones so darker colors are strong signals and lighter colors are normal ones. Buy when the lines turn green and sell when they turn red.
Let me know if there are any other scripts you would like to see me publish!

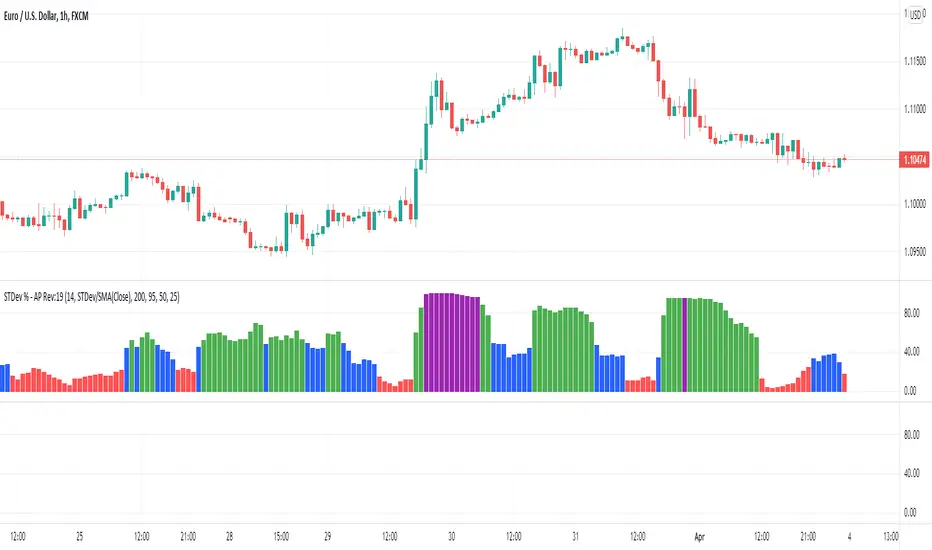
STDev % by Alejandro PThis is a simple indicator that expands the usability of Standard deviation into a universally usable indicator.
This indicator displays the volatility as standard deviation as a % of asset value, this allows using more standardized and comparable values across multiple instruments and asset classes.
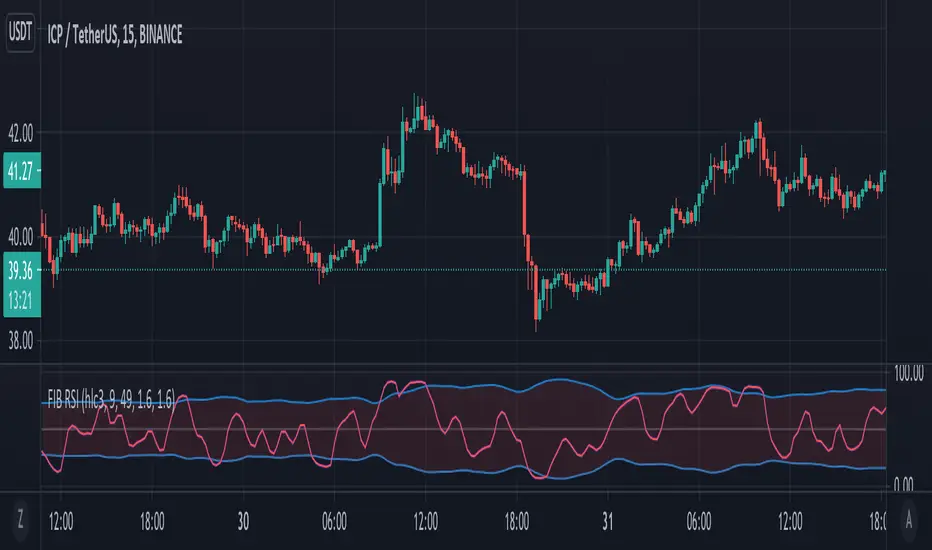
[EG] Fib RSIExtrapolated Fibonacci MA (FMA) into an RSI
i.e. FMA(up) and FMA(dn) of lengths 2, 3, 5, 8, 13, 21, 34, 55, 89 etc. averaged into RSI values.
Keep in mind it does not use 'Length' - it uses 'Interval' - how many fib intervals to include in the RSI calculation.
I threw in Ehler's Smoothing as well - seems to work quite well, thanks to TV Community for inspiration and code to look at for help
(Standard RSI included for comparison)
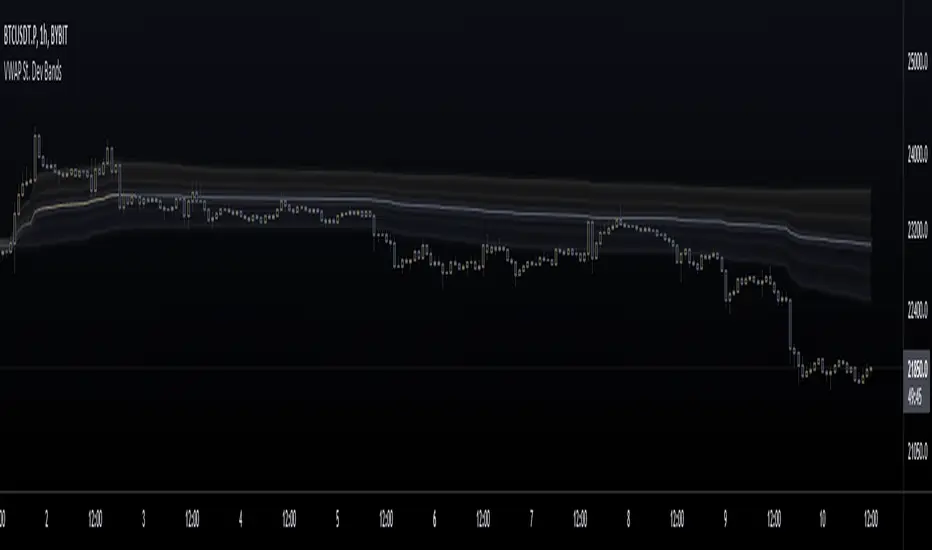
VWAP St. Dev BandsThis indicator allows you to add up to 3 volatility bands to VWAP based on its Standard Deviation.
Best use is for intraday but you can choose higher timeframes too.
For day trading a band of 3 standard deviations usually works well as an overbought/oversold region, allowing for mean reversion trading, but you are free to come up with your own strategies.
Enjoy!
RSI Div at Daily VWAP StDevMean Reversion indicator based on RSI Divergences at Overbought/Oversold conditions with Price above/below a Standard Deviation from Daily VWAP. Useful for intra-day trading.
Signal criteria:
1. RSI is at Overbought/Oversold
2. RSI Divergence present (not hidden)
3. RSI has not reached Neutral level (i.e. 50)
4. Price has crossed above/below a Standard Deviation from Daily VWAP
Config Options:
- RSI length (default:14)
- Divergence Lookback Period (default:14)
- RSI Oversold/Overbought tresholds (default: 70/30)
- RSI Reset Level (default: 55/45)
- Use VWAP Std Dev (default: yes)
- Standard Deviation from Daily VWAP (default: 1.51)
Use with discretion.

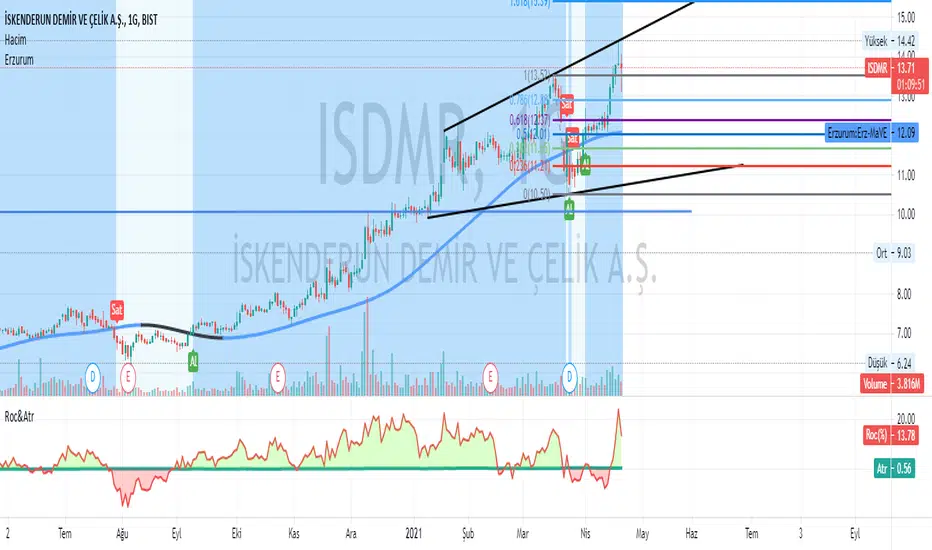
Erzurum Indicators (By DadashKadir)Erzurum Indicators (By DadashKadir)
An indicator in which you will keep track of the buying and selling movements by adding the movements of the three moving averages together. The parameters were determined as Moving Average (SMA), Exponential Moving Average (EMA), Weighted Moving Average (WMA) and Volume Weighted Moving Average (VWMA). Its constant value was taken as WMA. It is used to calculate the averages of 3 - 5 and 7. You can include the standard deviation (STDEV) in these moving averages.
The name of the indicator is taken from our city of Erzurum, the pearl of Eastern Anatolia.
Weighted stdev/BBThe basis/mean is the equivalent to the pine built in function wma(). It assigns greater weighting to recent data points and less weighting on past data points. The weighted moving average is calculated by multiplying each observation in the data set by a predetermined weighting factor.
Similarly the stdev is calculated using the same weighting factors where recent deviations are given greater weight than past deviations.

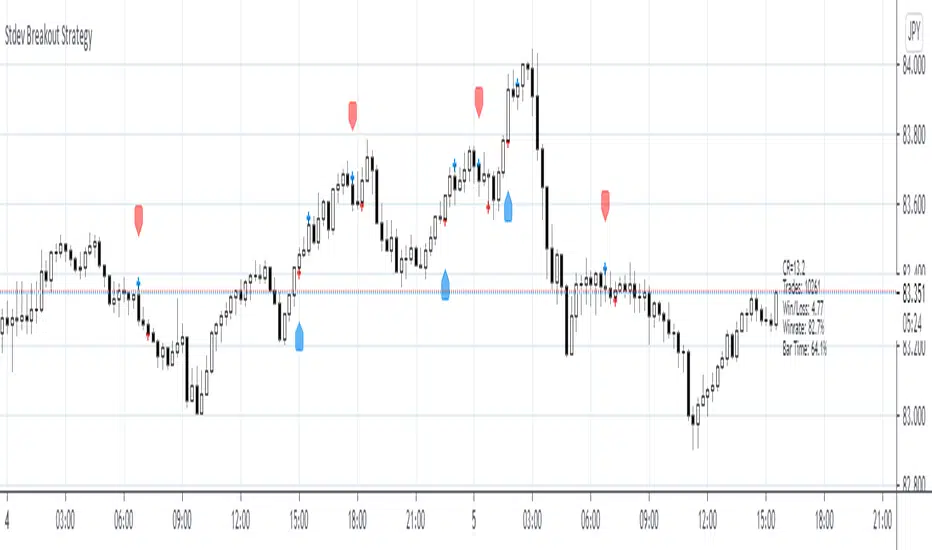
Stdev Breakout StrategyStdev Breakout Strategy
Description:
This script generates a long entry signal when the Standard Deviation crosses over the Simple Moving Average and the Close is greater than the Open, and/or generates a short entry signal when the Standard Deviation crosses under the Simple Moving Average and the Close is less than the Open.
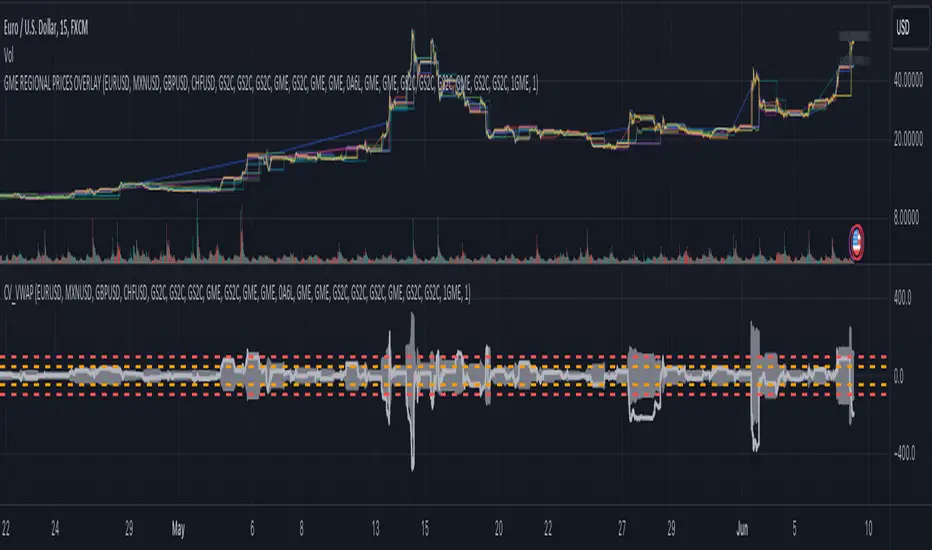
CV_VWAP_GMECoefficient of variance GME ‰
Gray area: Regional price variance of GME in per milles
Light gray thick line: NYSE:GME deviation from global mean
1. Select a chart 24-hour ticker like FX_IDC:USDEUR
2. Select a timescale (5 min, 15 min, ...)
3. Monitor the regional price variance
Exchanges included: NYSE, XETR, BMV, FWB, SWB, BITTREX, FTX
Currency conversion: Forex
Adapted from Detecting the great short squeeze on Volkswagen, Godfrey, K. (2016, February 18).
ATR Without OutliersIt is an ATR indicator which filters out outliers.
Outliers are values which are higher than the standard deviation of the true range.
It may be better than normal ATR for stop loss, because it does not keep large values after pump or dump.
It is very useful for high volatile markets like crypto markets.

SuperTrendRange by DGTSuperTrendRange study attempts to determine the state of the market
• whether a well-established bull/bear trend is present
• whether the market is trading in a range
SuperTrendRange (STR) takes into account the volatility of the market - further details regarding volatility can be found in the description of “Volatility Bands by DGT” study
Due to its similarities to SupertTrend (ST) and Parabolic SAR (SAR), I will try to explain by stating differences between them
SuperTrendRange uses both the ATR (Average True Range) and STDEV (Standard Deviation) as part of its calculations - unlike ST and SAR where they use only ATR
Sensitivity of the indicator is adjusted using the multiplier setting of both ATR and STDEV
Additionally, unlike ST, the source of the basis of SuperTrendRange can be selected among the assets price value or its moving average
Source and Length are adjustable too
The SuperTrendRange, like Parabolic SAR indicator, appears on a chart as a series of dots, either above, below or unlike Parabolic SAR both above and below of the asset's price
A dot placed
- below the price when the market is trending upward
- above the price when it is trending downward
- both above and below when the price starts moving sideways – this is a feature that both SuperTrend and Parabolic SAR misses, where they are known to produce false signals and losing trades, whereas SuperTrendRange emphasis the zones of the ranges occurring and in most cases are considered no trade recommended zones. Please note that the range width may vary depending on how the market is volatile. It is up to the users to trade if it fits their trading strategies
Dots plotted above and below can be assumed as Support and Resistance levels
Example usages – with trading opportunities
Gold Monthly Chart
Bitcoin Daily Chart
Disclaimer:
Trading success is all about following your trading strategy and the indicators should fit within your trading strategy, and not to be traded upon solely
The script is for informational and educational purposes only. Use of the script does not constitute professional and/or financial advice. You alone have the sole responsibility of evaluating the script output and risks associated with the use of the script. In exchange for using the script, you agree not to hold dgtrd TradingView user liable for any possible claim for damages arising from any decision you make based on use of the script

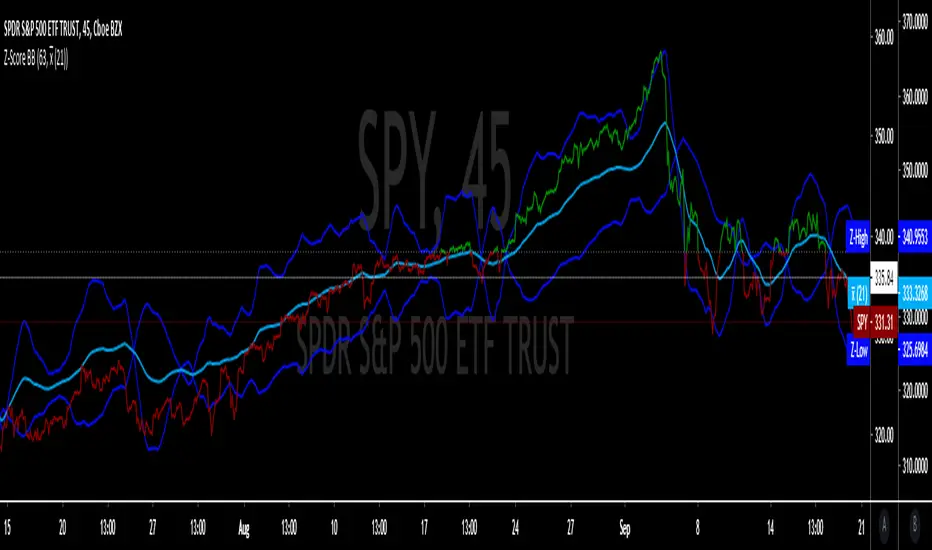
Z-Score 'Bollinger Bands'The following script is an application of the Z-Score (previous script).
Z-Scores can be used in place of standard deviation (sigma) in 'Bollinger Bands'.
The average of the sample (x-bar) over 21 days (N)
21 average trading days per month, fixed value
The average of the population (mu) over 63 days (n)
63 days per quarter, default is set to 63
Z-Score is calculated by formula in previous script, and the absolute value is taken of "Z".
Z-High = absolute value of Z + (x-bar).
Z-Low = absolute value of Z - (x-bar).
Will update with Z from mu and Z from avg (working on UX and visualization details).
Portfolio: alpha, beta, stdev, variance, mean, max drawdown...Portfolio Metrics **New**
'returns'
'log returns'
'geometric returns'
portfolio alpha
portfolio beta
portfolio,market correlation
portfolio standard deviation
portfolio variance
mean portfolio returns
maximum drawdown
maximum gain

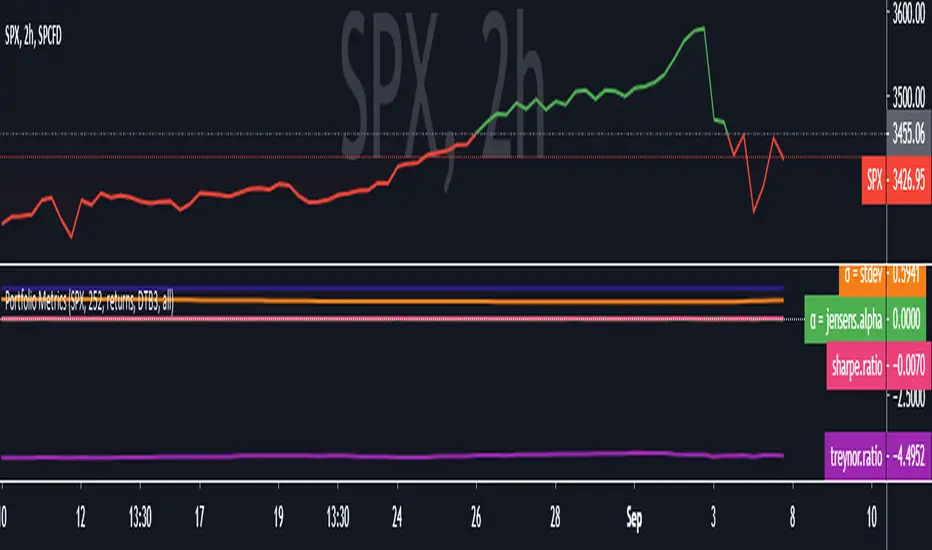
Portfolio Metrics = α(Jensen's), β, CAPM(Ra), Sharpe, TreynorPortfolio Metrics...
Standard Deviation
Jensen's Alpha
Beta
Expected Return (CAPM, Ra)
Sharpe Ratio
Treynor Ratio
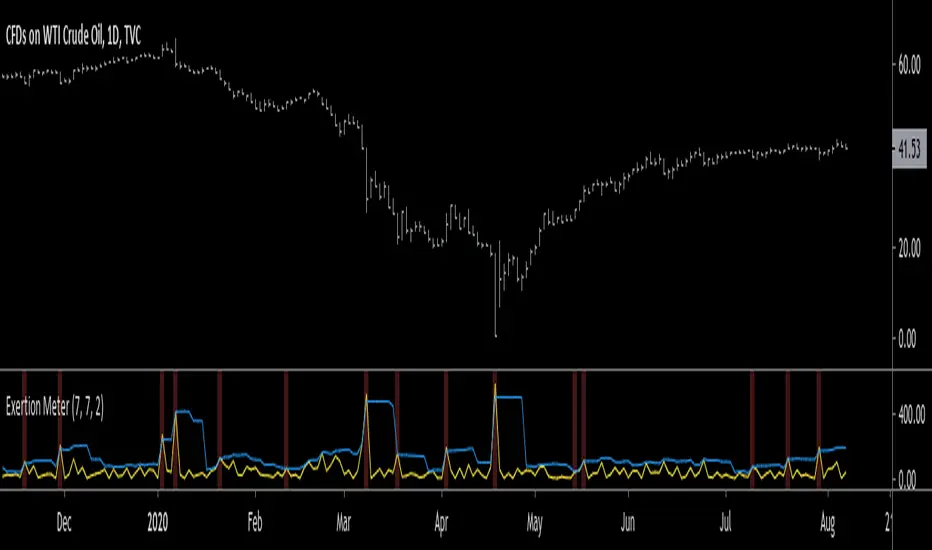
Exertion MeterHello traders, today I wanted to present you something special. I present you the Exertion Meter!
Created from scratch, this idea is based on a theory of mine called "Exertion".
Exertion occurs when price moves beyond the previous bar's range thus it has "exerted itself".
The idea is that when price moves a lot, it exerts a lot of energy which eventually leads to calmer motion, usually in the direction price has exerted itself.
Now, when price has exerted itself a lot in a particular direction, it's telling you that it will likely continue in that direction.
Once this happens, it will gradually calm down until price begins the cycle again, exerting itself in either the same or opposite direction.
This theory is similar to the theory of expansion & contraction phases.
This indicator attempts to show you where price has exerted itself by giving you a two lines cross signal.
The default settings are recommended, but experimentation is encouraged to fit your own personal system.
Both settings control the standard deviation line ( aka . Upper Bollinger Band ).
Enjoy, and hit the follow button to get easy access to all my indicators and to follow my latest publications!
Volatility based Standarde Deviation and Fib. Pivot PointsThis indicator plots Standard deviation levels and Fib. Pivot Points. I prefer to use only SD levels but Fib. levels also come handy in providing support and resistance.
How to use this indicator:
You have to manually enter instrument's Closing Price / Settlement Price and VIX closing price to draw each day's levels.
For NQ, I use VXN closign price and for ES or RTY, I use VIX closing price.
This indicator can be used on individual stocks and forex pairs.
