Sma

Torasko SMASimple Moving Averages for both momentum (21, 50 day), as well as mid- and long term support/resistance (100, 200 day).

PPO spreadScript requested by @sergebtpepper7, hope it will serve someone else :)
You can use it and modify it by your needs.

(JS) Ultimate Multi Time Frame Moving AveragesSick of having to pull up tons of charts to check the moving averages on various time frames? Me too, so I decided to make the "Ultimate Multi Time Frame Moving Averages" overlay.
So what's it do? Simple. It allows you to plot moving averages from other time frames on your current chart. There's a bunch of built in MA's, and I also added space for two custom SMAs and three custom EMAs.
The custom moving averages can be set to any length or time frame that you desire.
The ones that come built in include:
5 Day SMA
10 Day SMA
20 Day SMA
50 Day SMA
100 Day SMA
200 Day SMA
5 Week SMA
10 Week SMA
20 Week SMA
50 Week SMA
100 Week SMA
200 Week SMA
Now you can simply check or un-check any of the following to see where these MAs fall on your current chart, no more flipping back and forth! Enjoy!


2xIchimoku Cloud + 4xMA + Williams FractalUpdated version of the previously published multi-indicator which includes
4x Moving Averages
2x Ichimoku Clouds
Bill Williams Fractals
Changes:
-Toggle switches for each indicator on input tab for easy on/off
-MA Type Selector (EMA/SMA/WMA/VWMA)
-Various default style change
Many thanks to both redwraith and jedireza for helping me work out the MA section
www.tradingview.com
www.tradingview.com
Next improvements: Ichimoku settings

Seven Moving AvveragesThis is a simple yet very flexible moving average script. There are more than few moving average scripts out there but non of them are as flexible as this one.
This script lets you have seven different moving averages. Each moving average can be set separately, each can :
1- switch the moving average between EMA and SMA
2- set the flat percentage, this setting will be used to determine where we don't have trend in that moving average to set the color to black (default)
3- set the source
You can easily set the colors in the style tab.
This script was developed by request of few of my friends.

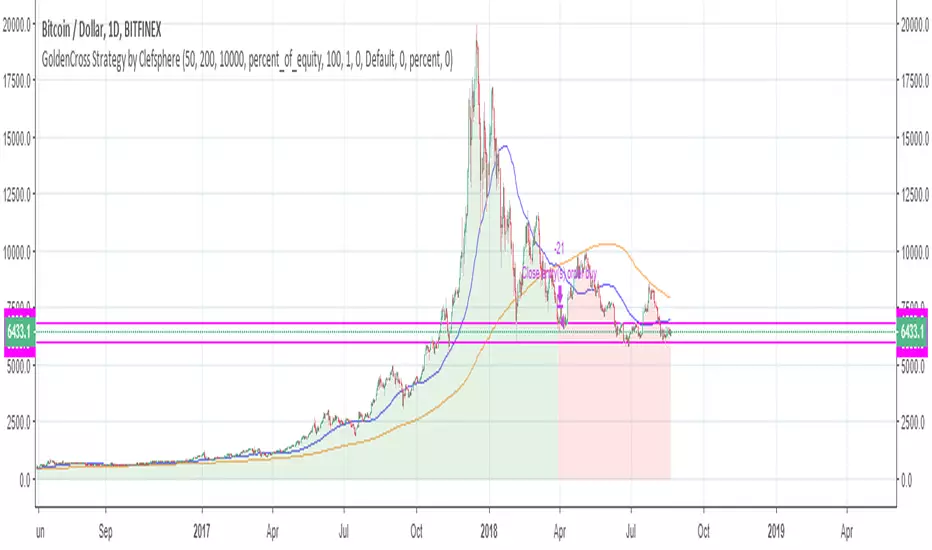
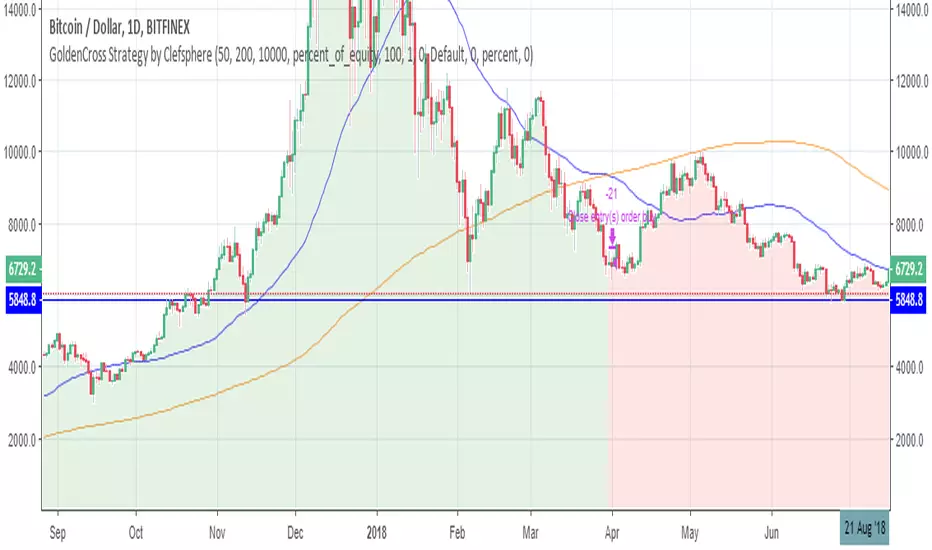
GoldenCross Strategy by ClefsphereGolden cross when 50SMA crosses 200SMA. Can be used for any market. Day time frame is ideal.
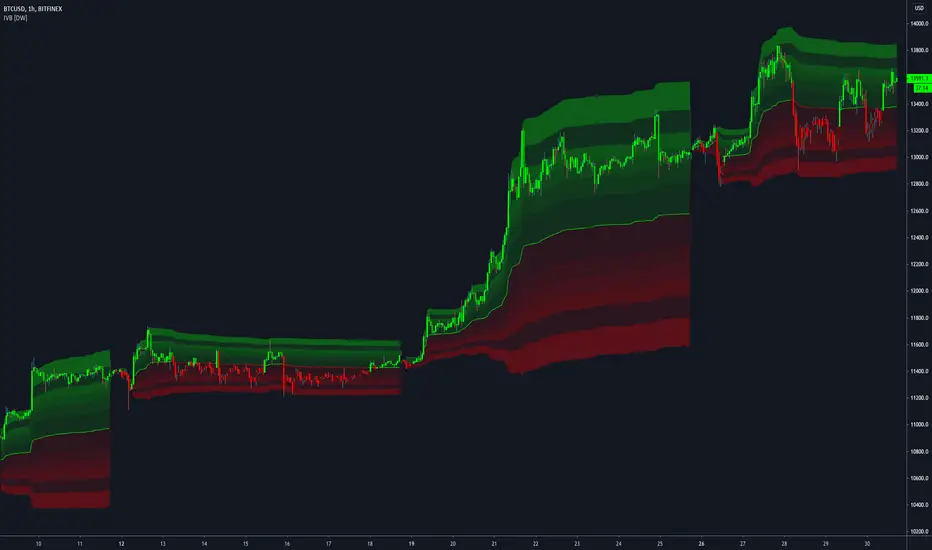
Interval Volatility Bands [DW]This is an experimental study that utilizes Volume Weighted Average Price or Time Weighted Average Price calculations, Bollinger Bands, and Fibonacci numbers to estimate volatility over a specified interval.
First, the basis is calculated by selecting:
-VWAP, which has the option to be calculated using real volume or tick volume
-TWAP, which has the option to be calculated using the standard method or exponential method
Next, standard deviation from the basis is calculated and multiplied by a specified expansion coefficient. The result is then added to and subtracted from the basis to calculate the high and low bands.
There are three band calculation methods to chosse from in this script:
-Standard, which uses the default calculations
-Average, which takes a cumulative average of standard deviation
-Hybrid, which takes the maximum of the standard and average standard deviation methods
Lastly, the high and low band ranges are multiplied by Fibonacci Percentages 23.6 - 78.6.
A custom color scheme with eight default presets to choose from is included.
Multiple Moving Averages using only 1 indicator! (configurable)Simple modification to an existing script that allows for configurable MA lookback-lengths


MACD and RSI Long/Short Strategy v0.1 by MoppleHello,
It is my first script. I would like to share it with you people. It is not the best one, but maybe someone needs it. It is version v0.1

Triple Power Moving Average v.02 by @Nico.MuselleALL THE POWER OF MULTIPLE MOVING AVERAGES ---- NOW COMPLETELY FOR FREE
Did you ever want to apply the Daily Moving Averages to an hourly chart ?
Are you tired of switching between time frames for seeing where that moving average is on the higher time frame ?
Do you want to display these moving averages on your current time frame ?
NOW YOU CAN !
In comes the Power Moving Average which offers you the opportunity to :
Display moving averages of any (higher) time frame you wish
In this version we added 4 hour, 6 hour, 8 hour and 12 hour selection for your moving averages
Select which type of Moving Average you want to display
Select up to 3 different types, lengths and time frames to display
Power Moving Average offers the following types of averages :
SMA - Simple Moving Average
EMA - Exponential Moving Average
WMA - Weighted Moving Average
VWMA - Volume Weighted Moving Average
RMA
See the configuration options here :
i.imgur.com
Q : Why are the Power Moving Averages not smooth historically ?
A : As the moving average is calculated on the close of the higher time frame and this close does not change for X- candles, the moving value does not change
Q : Can I add more than one Power Moving Average ?
A : Yes you can, just apply the Power Moving Average multiple times to your chart (free TradingView accounts are limited to 3 indicators)
Q : Can I apply lower time frame Moving Averages ?
A : While this is possible, the value will change during your current time frame candle, this might however be something scalpers want ?
Q : I have a free TradingView account and reached my indicator limit, what can I do ?
A : There are 2 possible solutions, first one is to get a TradingView Pro account (www.tradingview.com), second option is to get our Triple Power Moving Average for FREE.
If you like the indicator, please like and share !
Thank you !

Leeloo Triple Simple Moving AverageAllows you to have three simple moving averages in one indicator.


Volume Zone Oscillator and Price Zone (VZO/PZO) [NeoButane]" Volume Precedes Price is the conceptual idea for the oscillator."
"The main idea of the VZO was to try to change the OBV to look like an oscillator rather than an indicator, also to include time; primarily to identify which zone the volume is located in during a specific period "
How to read this indicator:
Positive reading -> bullish
Negative reading -> bearish
-60 or 60 is seen as the limit of the oscillator range, and a pullback should be expected from there.
Plus and minus signs have been added to the top and bottom for VZO and PZO, with an adjustable threshold to trigger.
Alert conditions have been added to this indicator for ease of use.
Volume Zone Oscillator, write-up by the author (recommended reading)
http:capitalsynergy.com/resources/IFTA09VZO.pdf
Volume Zone Oscillator, uses and formula
https:www.investopedia.com/articles/active-trading/072815/how-interpret-volume-zone-oscillator.asp
Price Zone Oscillator, uses and formula
https:www.investopedia.com/terms/p/price-zone-oscillator.asp

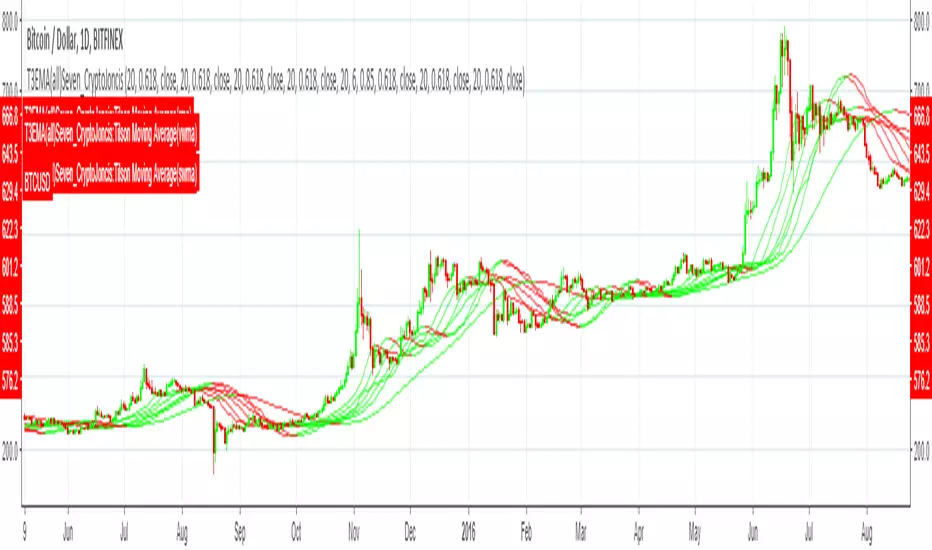
Tillson Moving Average(all_basic) SevenT3 Moving Average indicator was originally developed by Tim Tillson in 1998/99.
T3 Moving Average is considered as improved and better to traditional moving averages as it is smoother and performs better in trending market conditions.
It offers multiple opportunities when the price is in the state of retracement and therefore allows to minimize your exposed risk and allowing your profits run.
This version provides T3 MA
Source options - all standard + HA
T3 based on 6x ema, sma, rma, wma, alma, swma, vwma
Adds up to 7 different T3 on chart
Consider a tip in ETH to
0xac290B4A721f5ef75b0971F1102e01E1942A4578
Thank you and have a nice day
CryptoJoncis
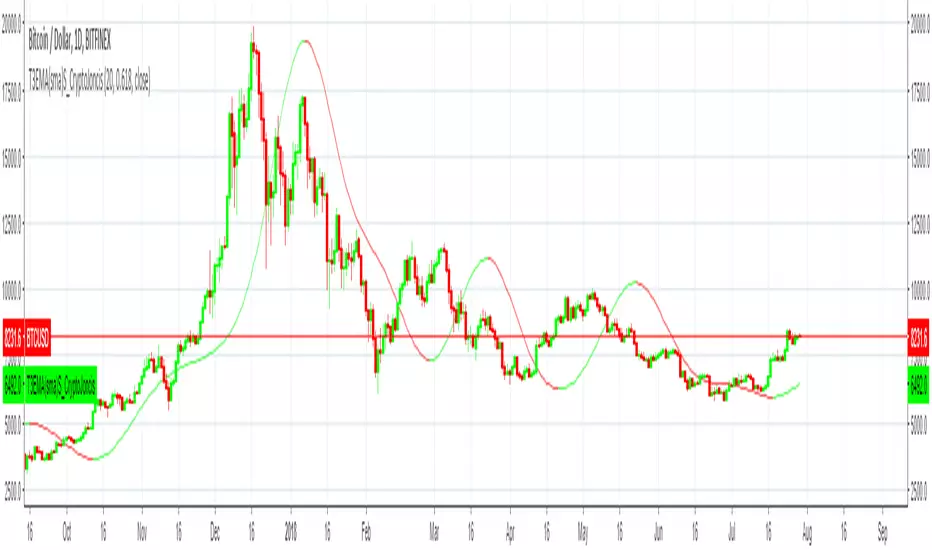
Tillson Moving Average(sma) singleT3 Moving Average indicator was originally developed by Tim Tillson in 1998/99.
T3 Moving Average is considered as improved and better to traditional moving averages as it is smoother and performs better in trending market conditions.
It offers multiple opportunities when the price is in the state of retracement and therefore allows to minimize your exposed risk and allowing your profits run.
This version provides simple T3 MA
Source options - all standard + HA
T3 based on 6x sma
Only adds 1 T3 MA on chart
Consider a tip in ETH to
0xac290B4A721f5ef75b0971F1102e01E1942A4578
Thank you and have a nice day
CryptoJoncis
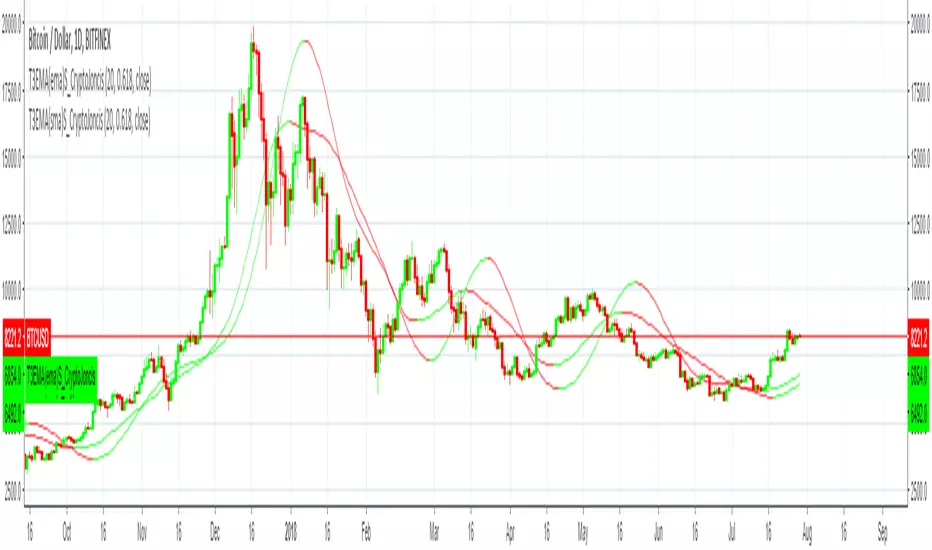
Tillson Moving Average(sma) singleT3 Moving Average indicator was originally developed by Tim Tillson in 1998/99.
T3 Moving Average is considered as improved and better to traditional moving averages as it is smoother and performs better in trending market conditions.
It offers multiple opportunities when the price is in the state of retracement and therefore allows to minimize your exposed risk and allowing your profits run.
This version provides simple T3 MA
Source options - all standard + HA
T3 based on 6x sma
Only adds 1 T3 MA on chart
Consider a tip in ETH to
0xac290B4A721f5ef75b0971F1102e01E1942A4578
Thank you and have a nice day
CryptoJoncis
Major Moving AveragesThis script includes the 100 & 200 SMA, EMA, WMA, VWMA, RMA, HMA, LSMA. You can turn off the one's you don't want under Style.

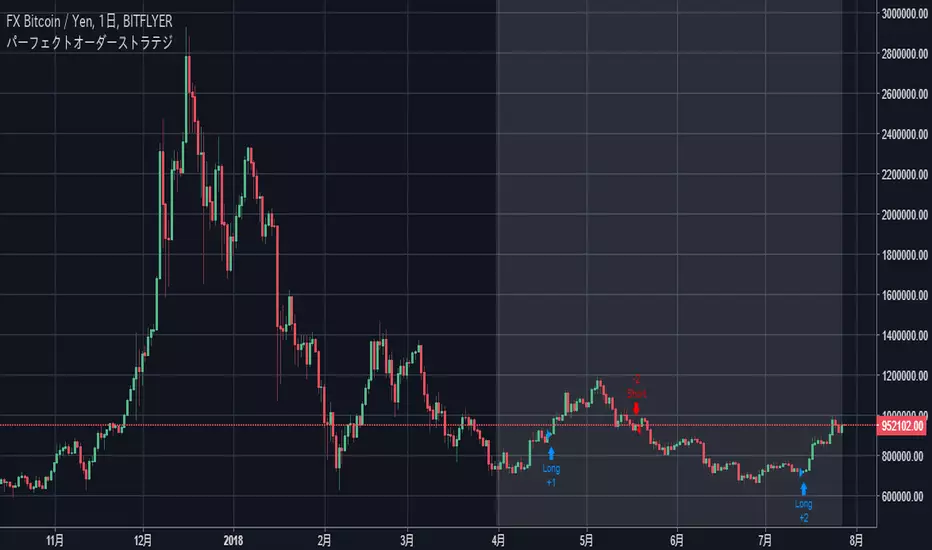
パーフェクトオーダーストラテジIt is a perfect order strategy of moving average lines.
With period specification / numerical value setting / stage selection function.
移動平均線のパーフェクトオーダーストラテジーです。
期間指定・数値設定・ステージ選択機能付き。