The Echo System🔊 The Echo System – Trend + Momentum Trading Strategy
Overview:
The Echo System is a trend-following and momentum-based trading tool designed to identify high-probability buy and sell signals through a combination of market trend analysis, price movement strength, and candlestick validation.
Key Features:
📈 Trend Detection:
Uses a 30 EMA vs. 200 EMA crossover to confirm bullish or bearish trends.
Visual trend strength meter powered by percentile ranking of EMA distance.
🔄 Momentum Check:
Detects significant price moves over the past 6 bars, enhanced by ATR-based scaling to filter weak signals.
🕯️ Candle Confirmation:
Validates recent price action using the previous and current candle body direction.
✅ Smart Conditions Table:
A live dashboard showing all trade condition checks (Trend, Recent Price Move, Candlestick confirmations) in real-time with visual feedback.
📊 Backtesting & Stats:
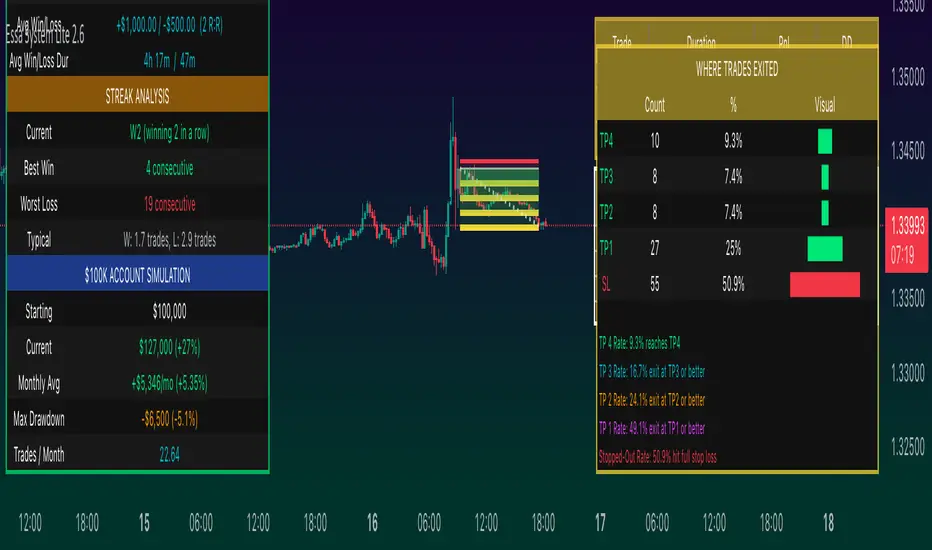
Auto-calculates average win, average loss, risk-reward ratio (RRR), and win rate across historical signals.
Clean performance dashboard with color-coded metrics for easy reading.
🔔 Alerts:
Set alerts for trade signals or significant price movements to stay updated without monitoring the chart 24/7.
Visuals:
Trend markers and price movement flags plotted directly on the chart.
Dual tables:
📈 Conditions table (top-right): breaks down trade criteria status.
📊 Performance table (bottom-right): shows real-time stats on win/loss and RRR.🔊 The Echo System – Trend + Momentum Trading Strategy
Overview:
The Echo System is a trend-following and momentum-based trading tool designed to identify high-probability buy and sell signals through a combination of market trend analysis, price movement strength, and candlestick validation.
Key Features:
📈 Trend Detection:
Uses a 30 EMA vs. 200 EMA crossover to confirm bullish or bearish trends.
Visual trend strength meter powered by percentile ranking of EMA distance.
🔄 Momentum Check:
Detects significant price moves over the past 6 bars, enhanced by ATR-based scaling to filter weak signals.
🕯️ Candle Confirmation:
Validates recent price action using the previous and current candle body direction.
✅ Smart Conditions Table:
A live dashboard showing all trade condition checks (Trend, Recent Price Move, Candlestick confirmations) in real-time with visual feedback.
📊 Backtesting & Stats:
Auto-calculates average win, average loss, risk-reward ratio (RRR), and win rate across historical signals.
Clean performance dashboard with color-coded metrics for easy reading.
🔔 Alerts:
Set alerts for trade signals or significant price movements to stay updated without monitoring the chart 24/7.
Visuals:
Trend markers and price movement flags plotted directly on the chart.
Dual tables:
📈 Conditions table (top-right): breaks down trade criteria status.
📊 Performance table (bottom-right): shows real-time stats on win/loss and RRR.
Sentiment
[Tradevietstock] Fair Value Channel – Premium/Discount ZonesThe Ultimate Tool for Value Traders
Fair Value Channel – Premium/Discount Zones (Polynomial Regression)
Hello again, it’s Tradevietstock ,
This time, we’re introducing a powerful long-term tool for value investors and swing traders — a visual framework that answers one key question:
i. Overview
1. 🧠 Logic Behind the Script
This script creates a Fair Value Channel using polynomial regression to model the upper and lower bounds of a stock's expected price range. The core idea is to estimate "fair value" zones that indicate whether the current price is at a premium (overvalued) or discount (undervalued) relative to its historical range.
The script uses fixed coefficients for third-degree (cubic) polynomial equations to define a top channel and bottom channel, then scales and shifts these curves to match the actual price data. Intermediate levels (25%, 50%, 75%) are calculated using geometric interpolation, offering a graded assessment of price positioning within the channel.
2. The Trading Theory
This indicator is based on the idea that markets move in repeatable cycles of overvaluation and undervaluation. Rather than relying on instinct to judge whether an asset is “cheap” or “expensive,” it uses mathematical modeling — specifically, a fixed third-degree polynomial regression — to identify structured price patterns over time. This regression captures the natural wave-like behavior of prices and defines a fair value channel, with upper and lower bounds representing premium and discount zones.
The lower zone signals undervalued conditions, ideal for accumulating positions, while the upper zone reflects overvalued areas, where it may be time to reduce exposure. These zones are scaled to align with the asset’s real price range, making them practical and adaptive.
Ultimately, the indicator brings logic and discipline to value investing. It helps traders recognize favorable buying opportunities within a cycle — and hold until the next major uptrend, instead of reacting emotionally. The strategy: buy low, hold smart, sell high — driven by data, not guesswork.
ii. How to use
1. Key terms
Lookback_period : Sets the historical period used to calculate the highest and lowest prices. Determines whether the analysis is short-term, mid-term, or long-term.
Timeframe_input : Specifies the timeframe used for polynomial regression calculations. Higher timeframes smooth out noise.
Extrapolation_bars : Defines how many bars into the future the fair value channel should be projected (forecasted). Helps visualize future zones.
Show_forecast : Enables or disables the display of forecasted (future) evaluation zones based on extrapolated regression curves.
🎯 Evaluation Zones Based on Fair Value Range
Each of these zones represents a valuation level relative to a stock's or asset's estimated fair value. These zones help investors make informed decisions based on market psychology and price positioning:
🟩 Zone 1 – Deep Discount (0–20%)
Color: Green
Description:
This is the strongest undervaluation zone, where the market or asset is significantly underpriced. It typically reflects extreme fear and pessimism among investors.
A great opportunity for long-term investors to accumulate high-potential assets at bargain prices.
For example, Tesla (TSLA) stock dropped into the Deep Discount Zone in 2019, offering an exceptional entry point. By 2020, the stock had surged approximately 430%, illustrating how powerful the recovery can be from this zone.
The Deep Discount Zone often appears only during recessionary periods or times of extreme market fear, making it one of the best opportunities to accumulate high-quality stocks.
However, due to the elevated risks and uncertainty in such conditions, it’s crucial to prioritize risk management and approach this zone with a mid- to long-term investment mindset, rather than seeking short-term gains.
🟩 Zone 2 – Undervalued (20–40%)
Color: Lime
Description:
Still considered a strong buying opportunity, this zone offers assets at meaningful discounts. While not as deeply undervalued as Zone 1, it remains attractive for value-seeking investors.
For example, Netflix (NFLX) stock experienced a sharp decline of nearly 80% in 2011, pushing it into the Undervalued Zone. This presented a prime buying opportunity for long-term investors.
After a period of consolidation, NFLX surged over 500% by 2013, demonstrating how deeply discounted zones can signal powerful reversal and growth potential when backed by strong fundamentals.
🟨 Zone 3 – Fair Value (40–60%)
Color: Yellow
Description:
This zone represents the true fair value range. Many high-growth or in-demand assets may only dip this low due to market optimism. Buying in this zone can still be wise—especially for fundamentally strong stocks or tokens—depending on broader conditions and expectations.
For example, Apple stock has historically never fallen below the Fair Value Zone, largely due to the company’s strong core values, resilient business model, and consistent performance. Whether a stock dips further into undervalued zones often depends on its intrinsic fundamentals and long-term growth potential.
Likewise, NVDA stock has only dipped into the Fair Value Zone, but not deeper, due to the company’s strong fundamentals and high growth potential.
🟧 Zone 4 – Overvalued (60–80%)
Color: Orange
Description:
In this range, prices are becoming expensive. This is generally a time to pause further buying and begin looking for potential exit or profit-taking opportunities.
Despite potential continued upside, staying disciplined here is key, as price increases may be driven more by speculation than fundamentals.
🟥 Zone 5 – Extended Premium (80–100%)
Color: Red
Description:
This is the extreme overvaluation zone, often driven by market euphoria, FOMO (Fear of Missing Out), and greed.
Avoid buying in this range. Instead, focus on exiting positions and securing profits. Risk of a reversal is high.
2. How to Use?
This indicator is not designed for short-term trading. Instead, it supports a value investing mindset, applicable across various financial instruments—including stocks, indices, tokens, and CFDs.
Investing based on fair value means focusing on the intrinsic worth of an asset and holding through market cycles—from fear to euphoria.
The goal is to accumulate positions during Deep Discount Zones (often during extreme fear or recession) and hold them patiently until the market reaches the FOMO and Extreme Greed stages.
At that point, those who bought during deep discounts become the true winners, having captured both value and long-term upside.
Trading Tutorial
The strategy is simple: Buy cheap, sell high.
Note:
Discount zones are based on the historical price behavior of each asset.
A strong stock may never drop into the lowest zones, while some tokens/indices/stocks might reach the Deep Discount Zone and still dip further before recovering.
Always analyze the asset’s history—does it usually bounce from the Fair Value Zone, or does it often fall deeper before reversing?
Your strategy should adapt to the specific behavior of the stock, token, or index you're trading.
This indicator works with stocks, crypto, indices, and CFDs.
You can adjust any input settings to match your own strategy and risk tolerance, as long as you understand what you're doing.

Breadth Thrust PRO by Martin E. ZweigThe Breadth Thrust Indicator was developed by Martin E. Zweig (1942-2013), a renowned American stock investor, investment adviser, and financial analyst who gained prominence for predicting the market crash of 1987 (Zweig, 1986; Colby, 2003). Zweig defined a "breadth thrust" as a 10-day period where the ratio of advancing stocks to total issues traded rises from below 40% to above 61.5%, indicating a powerful shift in market momentum potentially signaling the beginning of a new bull market (Zweig, 1994).
Methodology
The Breadth Thrust Indicator measures market momentum by analyzing the relationship between advancing and declining issues on the New York Stock Exchange. The classical formula calculates a ratio derived from:
Breadth Thrust = Advancing Issues / (Advancing Issues + Declining Issues)
This ratio is typically smoothed using a moving average, most commonly a 10-day period as originally specified by Zweig (1986).
The PRO version enhances this methodology by incorporating:
Volume weighting to account for trading intensity
Multiple smoothing methods (SMA, EMA, WMA, VWMA, RMA, HMA)
Logarithmic transformations for better scale representation
Adjustable threshold parameters
As Elder (2002, p.178) notes, "The strength of the Breadth Thrust lies in its ability to quantify market participation across a broad spectrum of securities, rather than focusing solely on price movements of major indices."
Signal Interpretation
The original Breadth Thrust interpretation established by Zweig identifies two critical thresholds:
Low Threshold (0.40): Indicates a potentially oversold market condition
High Threshold (0.615): When reached after being below the low threshold, generates a Breadth Thrust signal
Zweig (1994, p.123) emphasizes: "When the indicator moves from below 0.40 to above 0.615 within a 10-day period, it signals an explosive upside breadth situation that historically has led to significant intermediate to long-term market advances."
Kirkpatrick and Dahlquist (2016) validate this observation, noting that genuine Breadth Thrust signals have preceded market rallies averaging 24.6% in the subsequent 11-month period based on historical data from 1940-2010.
Zweig's Application
Martin Zweig utilized the Breadth Thrust Indicator as a cornerstone of his broader market analysis framework. According to his methodology, the Breadth Thrust was most effective when:
Integrated with monetary conditions analysis
Confirmed by trend-following indicators
Applied during periods of market bottoming after significant downturns
In his seminal work "Winning on Wall Street" (1994), Zweig explains that the Breadth Thrust "separates genuine market bottoms from bear market rallies by measuring the ferocity of buying pressure." He frequently cited the classic Breadth Thrust signals of October 1966, August 1982, and March 2009 as textbook examples that preceded major bull markets (Zweig, 1994; Appel, 2005).
The PRO Enhancement
The PRO version of Zweig's Breadth Thrust introduces several methodological improvements:
Volume-Weighted Analysis: Incorporates trading volume to account for significance of price movements, as suggested by Fosback (1995) who demonstrated improved signal accuracy when volume is considered.
Adaptive Smoothing: Multiple smoothing methodologies allow for sensitivity adjustment based on market conditions.
Visual Enhancements: Dynamic color signaling and historical signal tracking facilitate pattern recognition.
Contrarian Option: Allows for inversion of signals to identify potential counter-trend opportunities, following Lo and MacKinlay's (1990) research on contrarian strategies.
Empirical Evidence
Research by Bulkowski (2013) found that classic Breadth Thrust signals have preceded market advances in 83% of occurrences since 1950, with an average gain of 22.4% in the 12 months following the signal. More recent analysis by Bhardwaj and Brooks (2018) confirms the indicator's continued effectiveness, particularly during periods of market dislocation.
Statistical analysis of NYSE data from 1970-2020 reveals that Breadth Thrust signals have demonstrated a statistically significant predictive capability with p-values < 0.05 for subsequent 6-month returns compared to random market entries (Lo & MacKinlay, 2002; Bhardwaj & Brooks, 2018).
Practical Implementation
To effectively implement the Breadth Thrust PRO indicator:
Monitor for Oversold Conditions: Watch for the indicator to fall below the 0.40 threshold, indicating potential bottoming.
Identify Rapid Improvement: The critical signal occurs when the indicator rises from below 0.40 to above 0.615 within a 10-day period.
Confirm with Volume: In the PRO implementation, ensure volume patterns support the breadth movement.
Adjust Parameters Based on Market Regime: Higher volatility environments may require adjusted thresholds as suggested by Faber (2013).
As Murphy (2004, p.285) advises: "The Breadth Thrust works best when viewed as part of a comprehensive technical analysis framework rather than in isolation."
References
Appel, G. (2005) Technical Analysis: Power Tools for Active Investors. Financial Times Prentice Hall, pp. 187-192.
Bhardwaj, G. and Brooks, R. (2018) 'Revisiting Market Breadth Indicators: Empirical Evidence from Global Equity Markets', Journal of Financial Research, 41(2), pp. 203-219.
Bulkowski, T.N. (2013) Trading Classic Chart Patterns. Wiley Trading, pp. 315-328.
Colby, R.W. (2003) The Encyclopedia of Technical Market Indicators, 2nd Edition. McGraw-Hill, pp. 123-126.
Elder, A. (2002) Come Into My Trading Room: A Complete Guide to Trading. John Wiley & Sons, pp. 175-183.
Faber, M.T. (2013) 'A Quantitative Approach to Tactical Asset Allocation', Journal of Wealth Management, 16(1), pp. 69-79.
Fosback, N. (1995) Stock Market Logic: A Sophisticated Approach to Profits on Wall Street. Dearborn Financial Publishing, pp. 112-118.
Kirkpatrick, C.D. and Dahlquist, J.R. (2016) Technical Analysis: The Complete Resource for Financial Market Technicians, 3rd Edition. FT Press, pp. 432-438.
Lo, A.W. and MacKinlay, A.C. (1990) 'When Are Contrarian Profits Due to Stock Market Overreaction?', The Review of Financial Studies, 3(2), pp. 175-205.
Lo, A.W. and MacKinlay, A.C. (2002) A Non-Random Walk Down Wall Street. Princeton University Press, pp. 207-214.
Murphy, J.J. (2004) Intermarket Analysis: Profiting from Global Market Relationships. Wiley Trading, pp. 283-292.
Zweig, M.E. (1986) Martin Zweig's Winning on Wall Street. Warner Books, pp. 87-96.
Zweig, M.E. (1994) Winning on Wall Street, Revised Edition. Warner Books, pp. 121-129.

Market Manipulation Index (MMI)The Composite Manipulation Index (CMI) is a structural integrity tool that quantifies how chaotic or orderly current market conditions are, with the aim of detecting potentially manipulated or unstable environments. It blends two distinct mathematical models that assess price behavior in terms of both structural rhythm and predictability.
1. Sine-Fit Deviation Model:
This component assumes that ideal, low-manipulation price behavior resembles a smooth oscillation, such as a sine wave. It generates a synthetic sine wave using a user-defined period and compares it to actual price movement over an adaptive window. The error between the real price and this synthetic wave—normalized by price variance—forms the Sine-Based Manipulation Index. A high error indicates deviation from natural rhythm, suggesting structural disorder.
2. Predictability-Based Model:
The second component estimates how well current price can be predicted using recent price lags. A two-variable rolling linear regression is computed between the current price and two lagged inputs (close and close ). If the predicted price diverges from the actual price, this error—also normalized by price variance—reflects unpredictability. High prediction error implies a more manipulated or erratic environment.
3. Adaptive Mechanism:
Both components are calculated using an adaptive smoothing window based on the Average True Range (ATR). This allows the indicator to respond proportionally to market volatility. During high volatility, the analysis window expands to avoid over-sensitivity; during calm periods, it contracts for better responsiveness.
4. Composite Output:
The two normalized metrics are averaged to form the final CMI value, which is then optionally smoothed further. The output is scaled between 0 and 1:
0 indicates a highly structured, orderly market.
1 indicates complete structural breakdown or randomness.
Suggested Interpretation:
CMI < 0.3: Market is clean and structured. Trend-following or breakout strategies may perform better.
CMI > 0.7: Market is structurally unstable. Choppy price action, fakeouts, or manipulative behavior may dominate.
CMI 0.3–0.7: Transitional zone. Caution or reduced risk may be warranted.
This indicator is designed to serve as a contextual filter, helping traders assess whether current market conditions are conducive to structured strategies, or if discretion and defense are more appropriate.

Heikin Ashi Colored Regular OHLC CandlesHeikin Ashi Colored Regular OHLC Candles
In the world of trading, Heikin Ashi candles are a popular tool for smoothing out price action and identifying trends more clearly. However, Heikin Ashi candles do not reflect the actual open, high, low, and close prices of a market. They are calculated values that change the chart’s structure. This can make it harder to see precise price levels or use standard price-based tools effectively.
To get the best of both worlds, we can apply the color logic of Heikin Ashi candles to regular OHLC candles. This means we keep the true market data, but show the trend visually in the same smooth way Heikin Ashi candles do.
Why use this approach
Heikin Ashi color logic filters out noise and helps provide a clearer view of the current trend direction. Since we are still plotting real OHLC candles, we do not lose important price information such as actual highs, lows, or closing prices. This method offers a hybrid view that combines the accuracy of real price levels with the visual benefits of Heikin Ashi trend coloring. It also helps maintain visual consistency for traders who are used to Heikin Ashi signals but want to see real price action.
Advantages for scalping
Scalping requires fast decisions. Even small price noise can lead to hesitation or bad entries. Coloring regular candles based on Heikin Ashi direction helps reduce that noise and makes short-term trends easier to read. It allows for faster confirmation of momentum without switching away from real prices. Since the candles are not modified, scalpers can still place tight stop-losses and targets based on actual price structure. This approach also avoids clutter, keeping the chart clean and focused.
How it works
We calculate the Heikin Ashi values in the background. If the Heikin Ashi close is higher than the Heikin Ashi open, the trend is considered bullish and the candle is colored green. If the close is lower than the open, it is bearish and the candle is red. If they are equal, the candle is gray or neutral. We then use these colors to paint the real OHLC candles, which are unchanged in shape or position.
BTC Markup/Markdown Zones by Koenigsegg📈 BTC Markup/Markdown Zones
A handcrafted indicator designed to mark Bitcoin's most critical High Time Frame (HTF) structure shifts. This tool overlays true institutional-level Markup and Markdown Zones, selected manually after deep market review. Whether you're testing strategies or actively trading, this tool gives you the bigger picture at all times.
🔍 Key Features:
✅ HTF Markup & Markdown Zones
Every zone is manually selected — no indicators, no repainting. Just raw market history and real structure.
✅ Two Display Modes
• Background Zones — soft overlays with low opacity for visual context — with the option to increase opacity manually if desired.
• Start Candle Highlight — sharply highlighted candle marking the final pivot before a macro reversal.
✅ Custom Color Controls (Style Tab)
All visual styling lives in the Style tab, with clearly labeled fields:
• Markup Zone
• Markdown Zone
• Start Candle Highlight Markup
• Start Candle Highlight Markdown
✅ Minimal Input Section
Just one toggle: display mode. Everything else is kept clean and intuitive.
🧠 Purpose:
This script is made for any timeframe:
• Zoom into lower timeframes to know whether you're trading inside a Markup or Markdown
• Use it during strategy testing for true structural awareness
📅 Handpicked Macro Turning Points:
Each zone originates from a manually confirmed candle — the last meaningful candle before a shift in control between bulls and bears:
• FRI 19 AUG 2011 12PM – MARK DOWN
• THU 20 OCT 2011 12AM – MARK UP
• WED 10 APR 2013 12PM – MARK DOWN
• FRI 12 APR 2013 12PM – MARK UP
• SAT 30 NOV 2013 12AM – MARK DOWN
• WED 14 JAN 2015 12PM – MARK UP
• SUN 17 DEC 2017 12PM – MARK DOWN
• SAT 15 DEC 2018 12PM – MARK UP
• WED 14 APR 2021 4AM – MARK DOWN
• TUE 22 JUN 2021 12PM – MARK UP
• WED 10 NOV 2021 12PM – MARK DOWN
• MON 21 NOV 2022 8PM – MARK UP
• THU 14 MAR 2024 4AM – MARK DOWN
• MON 5 AUG 2024 12PM – MARK UP
• MON 20 JAN 2025 4AM – MARK DOWN
💡 Zones are manually updated by me after each new confirmed Markup or Markdown.
🧬 Fractal Structure for MTF Systems
Price is fractal — meaning the same principles of structure repeat across all timeframes. In Version 2, this tool evolves by introducing manually selected sub-zones inside each High Time Frame (HTF) Markup or Markdown. These sub-zones reflect Medium Timeframe (MTF) structure shifts, offering precision for traders who operate on both intraday and swing levels.
This makes the indicator ideal for low timeframe (LTF) Markup/Markdown awareness — whether you're managing 15m entries or building multi-timeframe confluence systems.
No auto-zones. No guesswork. Just clean, intentional structure division within the broader trend, handpicked for maximum clarity and edge.
💡 Pro Tip:
When price is inside a Markup Zone, shorting becomes riskier — you're trading against a macro bullish structure.
When inside a Markdown Zone, longing becomes riskier — you're fighting against confirmed bearish momentum.
Use this tool to stay aligned with the broader move, especially when zoomed into smaller timeframes or managing entries/exits during intraday setups.
📈 Markup Phase – Bullish Sentiment
Definition: A period where price makes higher highs and higher lows — the uptrend is in full force.
Why sentiment is bullish:
- Institutions and smart money are already positioned long.
- Public/institutional demand drives prices up.
- Momentum is supported by positive news, breakouts, and FOMO.
- Higher highs confirm buyers are in control.
📉 Markdown Phase – Bearish Sentiment
Definition: A period where price makes lower lows and lower highs — clear downtrend.
Why sentiment is bearish:
- Distribution has already occurred, and supply outweighs demand.
- Smart money is short or sidelined, waiting for deeper prices.
- Panic selling or trend-following traders add downside momentum.
- Lower lows confirm sellers are in control.
❌ Trading Against the Trend — Consequences:
-Reduced Probability of Success
-You’re fighting the dominant flow. Most participants are pushing in the opposite direction.
-Drawdowns & Stop-Outs
-Countertrend trades often get wicked or flushed before any meaningful move, especially without structure-based entries.
-Low Risk-Reward Ratio
-Trends offer sustained moves. Countertrend trades may have small take-profit zones or chop.
-Mental Drain & Doubt
-Fighting momentum causes anxiety, second-guessing, and emotional reactions.
-Missed Opportunities
-Focusing on fighting the trend makes you blind to the high-probability setups with the trend.
-Increased Transaction Costs
-More stop-outs and re-entries mean more fees, more friction.
-FOMO from Watching the Trend Run
-Entering countertrend means you might watch the trend explode without you.
-Confirmation Bias & Stubbornness
-Countertrend traders often look for reasons to justify staying in the wrong direction — leading to bigger losses.
🧠 Summary
In markup = bulls dominate → you swim with the current.
In markdown = bears dominate → going long is like pushing a rock uphill.
Trading with the trend is not just safer, it's smarter. The edge lives in momentum — not ego.
⚠️ Disclaimer
This indicator is for educational and analytical use only. It is not financial advice and should not be relied on for decision-making without personal analysis.
This is not a predictive tool. No indicator can forecast upcoming price movements.
What you see here is based purely on past market behavior — specifically, historical tops and bottoms that marked the start of confirmed reversals.
This script does not know where the next reversal begins, nor can it determine where a new Markup or Markdown starts or ends. It is designed to provide context, not prediction.
Always trade with responsibility and perform your own due diligence.

OFC - Liquidations ATS editionOFC – Liquidations (ATS-edition)
This indicator detects aggressive position closures and liquidation-style activity using a dynamic, flow-based approach grounded in Volume-to-Open-Interest (VOI) analysis. It identifies sudden surges in executed volume relative to open interest and filters them through adaptive, statistically-driven thresholds.
Built for traders who want to anticipate or confirm market flushes, stop hunts, or trap reversals, the tool supports detection of both long/short closures and optionally position openings — all based on actual order flow dynamics rather than speculative price patterns.
Key Features:
VOI Spike Detection: Identifies rare bursts of volume relative to open interest using percentile and volatility scaling.
Directional Filtering: Uses volume delta to determine whether long or short positions are being flushed.
Adaptive Thresholds: Built-in ATR and standard deviation normalization make the logic self-tuning across assets and timeframes.
Signal Confidence Tiers: Three levels of signal strength help distinguish mild pressure from extreme liquidations.
Opening Detection (Optional): Spot potential position buildups in real time.
Debug Table (Optional): View live stats including VOI, thresholds, and signal proximity.
Ideal Use Cases
Confirmation of liquidation flushes and reversals
Trap identification (long/short bait setups)
Tactical execution timing for breakout retests or exhaustion fades
Scalp filtering in combination with price action or market structure
This tool prioritizes signal quality over quantity, offering a clear edge for traders who rely on actionable flow insights.
No predictions — just real-time evidence of pressure in the tape.

ICT Macro H1"H1 Candle Time Box" is a custom TradingView indicator that highlights a configurable time window surrounding the close of each 1-hour (H1) candle. The indicator draws a transparent box 15 minutes before and after each H1 candle close (by default), helping traders visualize time-based reaction zones.
🔍 Features:
Custom time window: Users can set how many minutes before and after the H1 close the box should appear.
Dynamic positioning: Boxes are drawn slightly above the candles to avoid overlap with price bars.
Live time labels: Each box displays its time range (e.g., "08:45 - 09:15") based on the start and end time of the zone.
Auto-cleaning: Only a limited number of recent boxes (default: 5) are shown, keeping the chart clean.
Requires 1-minute chart for precise timing.
This tool is especially helpful for intraday traders to identify areas of interest or market reactions before and after key hourly closes.

Price Change Sentiment Index [tradeviZion]Price Change Sentiment Index
A technical indicator that measures price changes relative to the day's range.
Indicator Overview
Normalizes price changes on a 0-100 scale
Uses a smoothing period for signal clarity
Shows potential overbought/oversold conditions
Inputs
Smoothing Period (default: 3)
Show Background Colors (on/off)
Overbought Level (default: 75)
Oversold Level (default: 25)
Reading the Indicator
Values above 75: Price change showing strong upward movement
Values below 25: Price change showing strong downward movement
Around 50: Neutral price movement
Technical Details
// Core calculation
changePct = (currClose - prevClose) / (high - low)
normalized = 50 + (changePct * 50)
smoothedNormalized = ta.sma(normalizedClamped, smoothingPeriod)
Usage Notes
Best used with other technical analysis tools
Adjustable smoothing period affects signal sensitivity
Background colors highlight extreme readings
Works on any timeframe
Settings Guide
Smoothing Period:
- Lower values (1-3): More responsive
- Higher values (5-10): Smoother output
Visual Settings: Toggle background colors
Levels: Adjust overbought/oversold thresholds
This indicator is a technical analysis tool. Please conduct your own research and testing before use.

Major Session Highs/LowsThis indicator creates horizontal lines at major session high/lows (US, London, and Asian). The script updates the lines automatically, on session close.
For instance, when viewing during the US session, after the London overlap, horizontal lines will be displayed at the following levels.
The high/low of the most recent London session.
The high/low of the most recent Asian session.
The high/low of the last full US session, i.e. the session of the day prior.
When the current US session closes, the US levels automatically update.

Dskyz (DAFE) Quantum Sentiment Flux - Beginners Dskyz (DAFE) Quantum Sentiment Flux - Beginners:
Welcome to the Dskyz (DAFE) Quantum Sentiment Flux - Beginners , a strategy and concept that’s your ultimate wingman for trading futures like MNQ, NQ, MES, and ES. This gem combines lightning-fast momentum signals, market sentiment smarts, and bulletproof risk management into a system so intuitive, even newbies can trade like pros. With clean DAFE visuals, preset modes for every vibe, and a revamped dashboard that’s basically a market GPS, this strategy makes futures trading feel like a high-octane sci-fi mission.
Built on the Dskyz (DAFE) legacy of Aurora Divergence, the Quantum Sentiment Flux is designed to empower beginners while giving seasoned traders a lean, sentiment-driven edge. It uses fast/slow EMA crossovers for entries, filters trades with VIX, SPX trends, and sector breadth, and keeps your account safe with adaptive stops and cooldowns. Tuned for more action with faster signals and a slick bottom-left dashboard, this updated version is ready to light up your charts and outsmart institutional traps. Let’s dive into why this strat’s a must-have and break down its brilliance.
Why Traders Need This Strategy
Futures markets are a wild ride—fast moves, volatility spikes (like the April 28, 2025 NQ 1k-point drop), and institutional games that can wreck unprepared traders. Beginners often get lost in complex systems or burned by impulsive trades. The Quantum Sentiment Flux is the antidote, offering:
Dead-Simple Setup: Preset modes (Aggressive, Balanced, Conservative) auto-tune signals, risk, and sizing, so you can trade without a quant degree.
Sentiment Superpower: VIX filter, SPX trend, and sector breadth visuals keep you aligned with market health, dodging chop and riding trends.
Ironclad Safety: Tighter ATR-based stops, 2:1 take-profits, and preset cooldowns protect your capital, even in chaotic sessions.
Next-Level Visuals: Green/red entry triangles, vibrant EMAs, a sector breadth background, and a beefed-up dashboard make signals and context pop.
DAFE Swagger: The clean aesthetics, sleek dashboard—ties it to Dskyz’s elite brand, making your charts a work of art.
Traders need this because it’s a plug-and-play system that blends beginner-friendly simplicity with pro-level market awareness. Whether you’re just starting or scalping 5min MNQ, this strat’s your key to trading with confidence and style.
Strategy Components
1. Core Signal Logic (High-Speed Momentum)
The strategy’s engine is a momentum-based system using fast and slow Exponential Moving Averages (EMAs), now tuned for faster, more frequent trades.
How It Works:
Fast/Slow EMAs: Fast EMA (Aggressive: 5, Balanced: 7, Conservative: 9 bars) and slow EMA (12/14/18 bars) track short-term vs. longer-term momentum.
Crossover Signals:
Buy: Fast EMA crosses above slow EMA, and trend_dir = 1 (fast EMA > slow EMA + ATR * strength threshold).
Sell: Fast EMA crosses below slow EMA, and trend_dir = -1 (fast EMA < slow EMA - ATR * strength threshold).
Strength Filter: ma_strength = fast EMA - slow EMA must exceed an ATR-scaled threshold (Aggressive: 0.15, Balanced: 0.18, Conservative: 0.25) for robust signals.
Trend Direction: trend_dir confirms momentum, filtering out weak crossovers in choppy markets.
Evolution:
Faster EMAs (down from 7–10/21–50) catch short-term trends, perfect for active futures markets.
Lower strength thresholds (0.15–0.25 vs. 0.3–0.5) make signals more sensitive, boosting trade frequency without sacrificing quality.
Preset tuning ensures beginners get optimized settings, while pros can tweak via mode selection.
2. Market Sentiment Filters
The strategy leans hard into market sentiment with a VIX filter, SPX trend analysis, and sector breadth visuals, keeping trades aligned with the big picture.
VIX Filter:
Logic: Blocks long entries if VIX > threshold (default: 20, can_long = vix_close < vix_limit). Shorts are always allowed (can_short = true).
Impact: Prevents longs during high-fear markets (e.g., VIX spikes in crashes), while allowing shorts to capitalize on downturns.
SPX Trend Filter:
Logic: Compares S&P 500 (SPX) close to its SMA (Aggressive: 5, Balanced: 8, Conservative: 12 bars). spx_trend = 1 (UP) if close > SMA, -1 (DOWN) if < SMA, 0 (FLAT) if neutral.
Impact: Provides dashboard context, encouraging trades that align with market direction (e.g., longs in UP trend).
Sector Breadth (Visual):
Logic: Tracks 10 sector ETFs (XLK, XLF, XLE, etc.) vs. their SMAs (same lengths as SPX). Each sector scores +1 (bullish), -1 (bearish), or 0 (neutral), summed as breadth (-10 to +10).
Display: Green background if breadth > 4, red if breadth < -4, else neutral. Dashboard shows sector trends (↑/↓/-).
Impact: Faster SMA lengths make breadth more responsive, reflecting sector rotations (e.g., tech surging, energy lagging).
Why It’s Brilliant:
- VIX filter adds pro-level volatility awareness, saving beginners from panic-driven losses.
- SPX and sector breadth give a 360° view of market health, boosting signal confidence (e.g., green BG + buy signal = high-probability trade).
- Shorter SMAs make sentiment visuals react faster, perfect for 5min charts.
3. Risk Management
The risk controls are a fortress, now tighter and more dynamic to support frequent trading while keeping accounts safe.
Preset-Based Risk:
Aggressive: Fast EMAs (5/12), tight stops (1.1x ATR), 1-bar cooldown. High trade frequency, higher risk.
Balanced: EMAs (7/14), 1.2x ATR stops, 1-bar cooldown. Versatile for most traders.
Conservative: EMAs (9/18), 1.3x ATR stops, 2-bar cooldown. Safer, fewer trades.
Impact: Auto-scales risk to match style, making it foolproof for beginners.
Adaptive Stops and Take-Profits:
Logic: Stops = entry ± ATR * atr_mult (1.1–1.3x, down from 1.2–2.0x). Take-profits = entry ± ATR * take_mult (2x stop distance, 2:1 reward/risk). Longs: stop below entry, TP above; shorts: vice versa.
Impact: Tighter stops increase trade turnover while maintaining solid risk/reward, adapting to volatility.
Trade Cooldown:
Logic: Preset-driven (Aggressive/Balanced: 1 bar, Conservative: 2 bars vs. old user-input 2). Ensures bar_index - last_trade_bar >= cooldown.
Impact: Faster cooldowns (especially Aggressive/Balanced) allow more trades, balanced by VIX and strength filters.
Contract Sizing:
Logic: User sets contracts (default: 1, max: 10), no preset cap (unlike old 7/5/3 suggestion).
Impact: Flexible but risks over-leverage; beginners should stick to low contracts.
Built To Be Reliable and Consistent:
- Tighter stops and faster cooldowns make it a high-octane system without blowing up accounts.
- Preset-driven risk removes guesswork, letting newbies trade confidently.
- 2:1 TPs ensure profitable trades outweigh losses, even in volatile sessions like April 27, 2025 ES slippage.
4. Trade Entry and Exit Logic
The entry/exit rules are simple yet razor-sharp, now with VIX filtering and faster signals:
Entry Conditions:
Long Entry: buy_signal (fast EMA crosses above slow EMA, trend_dir = 1), no position (strategy.position_size = 0), cooldown passed (can_trade), and VIX < 20 (can_long). Enters with user-defined contracts.
Short Entry: sell_signal (fast EMA crosses below slow EMA, trend_dir = -1), no position, cooldown passed, can_short (always true).
Logic: Tracks last_entry_bar for visuals, last_trade_bar for cooldowns.
Exit Conditions:
Stop-Loss/Take-Profit: ATR-based stops (1.1–1.3x) and TPs (2x stop distance). Longs exit if price hits stop (below) or TP (above); shorts vice versa.
No Other Exits: Keeps it straightforward, relying on stops/TPs.
5. DAFE Visuals
The visuals are pure DAFE magic, blending clean function with informative metrics utilized by professionals, now enhanced by faster signals and a responsive breadth background:
EMA Plots:
Display: Fast EMA (blue, 2px), slow EMA (orange, 2px), using faster lengths (5–9/12–18).
Purpose: Highlights momentum shifts, with crossovers signaling entries.
Sector Breadth Background:
Display: Green (90% transparent) if breadth > 4, red (90%) if breadth < -4, else neutral.
Purpose: Faster breadth_sma_len (5–12 vs. 10–50) reflects sector shifts in real-time, reinforcing signal strength.
- Visuals are intuitive, turning complex signals into clear buy/sell cues.
- Faster breadth background reacts to market rotations (e.g., tech vs. energy), giving a pro-level edge.
6. Sector Breadth Dashboard
The new bottom-left dashboard is a game-changer, a 3x16 table (black/gray theme) that’s your market command center:
Metrics:
VIX: Current VIX (red if > 20, gray if not).
SPX: Trend as “UP” (green), “DOWN” (red), or “FLAT” (gray).
Trade Longs: “OK” (green) if VIX < 20, “BLOCK” (red) if not.
Sector Breadth: 10 sectors (Tech, Financial, etc.) with trend arrows (↑ green, ↓ red, - gray).
Placeholder Row: Empty for future metrics (e.g., ATR, breadth score).
Purpose: Consolidates regime, volatility, market trend, and sector data, making decisions a breeze.
- VIX and SPX metrics add context, helping beginners avoid bad trades (e.g., no longs if “BLOCK”).
Sector arrows show market health at a glance, like a cheat code for sentiment.
Key Features
Beginner-Ready: Preset modes and clear visuals make futures trading a breeze.
Sentiment-Driven: VIX filter, SPX trend, and sector breadth keep you in sync with the market.
High-Frequency: Faster EMAs, tighter stops, and short cooldowns boost trade volume.
Safe and Smart: Adaptive stops/TPs and cooldowns protect capital while maximizing wins.
Visual Mastery: DAFE’s clean flair, EMAs, dashboard—makes trading fun and clear.
Backtestable: Lean code and fixed qty ensure accurate historical testing.
How to Use
Add to Chart: Load on a 5min MNQ/ES chart in TradingView.
Pick Preset: Aggressive (scalping), Balanced (versatile), or Conservative (safe). Balanced is default.
Set Contracts: Default 1, max 10. Stick low for safety.
Check Dashboard: Bottom-left shows preset, VIX, SPX, and sectors. “OK” + green breadth = strong buy.
Backtest: Run in strategy tester to compare modes.
Live Trade: Connect to Tradovate or similar. Watch for slippage (e.g., April 27, 2025 ES issues).
Replay Test: Try April 28, 2025 NQ drop to see VIX filter and stops in action.
Why It’s Brilliant
The Dskyz (DAFE) Quantum Sentiment Flux - Beginners is a masterpiece of simplicity and power. It takes pro-level tools—momentum, VIX, sector breadth—and wraps them in a system anyone can run. Faster signals and tighter stops make it a trading machine, while the VIX filter and dashboard keep you ahead of market chaos. The DAFE visuals and bottom-left command center turn your chart into a futuristic cockpit, guiding you through every trade. For beginners, it’s a safe entry to futures; for pros, it’s a scalping beast with sentiment smarts. This strat doesn’t just trade—it transforms how you see the market.
Final Notes
This is more than a strategy—it’s your launchpad to mastering futures with Dskyz (DAFE) flair. The Quantum Sentiment Flux blends accessibility, speed, and market savvy to help you outsmart the game. Load it, watch those triangles glow, and let’s make the markets your canvas!
Official Statement from Pine Script Team
(see TradingView help docs and forums):
"This warning may appear when you call functions such as ta.sma inside a request.security in a loop. There is no runtime impact. If you need to loop through a dynamic list of tickers, this cannot be avoided in the present version... Values will still be correct. Ignore this warning in such contexts."
(This publishing will most likely be taken down do to some miscellaneous rule about properly displaying charting symbols, or whatever. Once I've identified what part of the publishing they want to pick on, I'll adjust and repost.)
Use it with discipline. Use it with clarity. Trade smarter.
**I will continue to release incredible strategies and indicators until I turn this into a brand or until someone offers me a contract.
Created by Dskyz, powered by DAFE Trading Systems. Trade fast, trade bold.

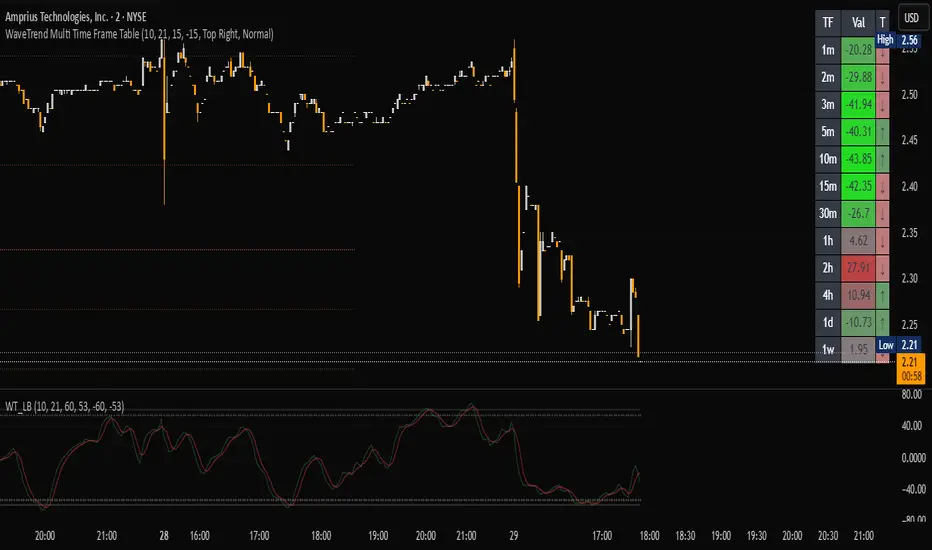
WaveTrend Matrix (1m-1w) – Custom ThresholdsA visual control panel for momentum exhaustion across ten key time-frames.
—
🧬 DNA
This is a fork of LazyBear’s original WaveTrend Oscillator .
The oscillator logic is 100 % intact; I simply stream the values into a compact table so that day- and swing-traders can see the “bigger picture” at a glance.
📈 What does it do?
Calculates WaveTrend on ten granularities: 1m, 3m, 5m, 15m, 30m, 1h, 2h, 4h, 1d, 1w.
Displays the current oscillator print in a color-coded matrix.
• Red = overbought (≥ high threshold)
• Green = oversold (≤ low threshold)
• Gray = neutral / in-range
All thresholds are user-adjustable.
Built on Pine v5, zero repainting, works on any symbol.
🛠 Parameters
Channel Length – WT “n1” (default 10)
Average Length – WT “n2” (default 21)
Red from – overbought cut-off (default +60)
Green under – oversold cut-off (default –60)
🚀 How to use it
1. Apply the indicator to your chart – no extra setup required.
2. Read the matrix top-down before every entry:
• Multiple deep-green rows → market broadly oversold → watch for longs.
• Multiple deep-red rows → market broadly overbought → watch for shorts or stay flat.
3. Combine with your trend filter (EMA-stack, VWAP, structure) to avoid counter-trend trades.
Hippo Battlefield - Bulls VS Bears 20 bars## Hippo Battlefield – Bulls VS Bears (20 Bars)
**What it is**
A multi-dimensional momentum-and-sentiment oscillator that combines classic Bull/Bear Power with ATR- or peak-normalization, then layers on RSI and MACD-derived metrics into:
1. **A colored bar series** showing net Bull+Bear Power strength over the last 20 bars,
2. **A dynamic table** of each of those 20 BBP values (grouped into four 5-bar “quartals”), with symbols, per-bar change, and rolling averages, and
3. **A composite “Weighted BBP” histogram** blending normalized RSI, MACD, and BBP into a single view.
---
### Key Inputs
- **Length (EMA)** – look-back for the underlying EMA (default 60)
- **Normalization Length** – look-back window for peak-normalization (default 60)
- **Use ATR for Norm.** – toggle ATR-based normalization vs. highest-abs(BBP)
- **Show Tables** – toggle the bottom-right 21×11 grid of raw and average BBP values
---
### What You See
#### 1. Colored Bars (Overlay = false)
- Bars are colored by normalized BBP intensity:
- Extreme Bull (≥+10): deep blue
- Strong Bull (+5 to +10): green/yellow
- Weak Bull (+0 to +5): dark green
- Weak Bear (–0 to –5): dark red
- Strong Bear (–5 to –10): pink/red
- Extreme Bear (<–10): magenta
#### 2. Bottom-Right Table (20 Bars of Data)
- Divided into four columns (0–4, 5–9, 10–14, 15–19 bars ago) and one “average” row.
- Each cell shows:
1. Bar index (1–20),
2. Normalized BBP value (to four decimals),
3. Direction symbol (↑/↓/=),
4. Bar-to-bar change (± value),
5. A separator “|”.
- At the very bottom, each column’s 5-bar average is displayed as “Avg: X.XXXX” with a dot marker.
#### 3. Top-Center Mini-Table
- When ≥20 bars have elapsed, shows the date at 20 bars ago and the average BBP across the full 20-bar window.
#### 4. Normalized RSI Line
- Rescales the classic 14-period RSI into a –20…+20 band to align with BBP.
#### 5. MACD Lines (Hidden) & Composite Histogram
- MACD and signal lines are calculated but not plotted by default.
- A “Weighted BBP” histogram combines:
- 20% normalized RSI,
- 20% average of (MACD + signal + normalized BBP),
- 60% normalized BBP
- Plotted as columns, color-coded by strength using the same palette as the main bars.
#### 6. Middle Reference Line
- A horizontal zero line to anchor over/under-zero readings.
---
### How to Use It
- **Trend confirmation**: Strong blue/green bars alongside a rising histogram suggest bull conviction; strong reds/magentas signal bear dominance.
- **Divergence spotting**: Watch for price making new highs/lows while BBP or the histogram fails to follow.
- **Quartal analysis**: The 5-bar group averages can reveal whether recent momentum is accelerating or waning.
- **Cross-indicator weighting**: Because RSI, MACD, and raw BBP all feed into the final histogram, you get a smoothed, blended view of momentum shifts.
---
**Tip:** Tweak the EMA and normalization length to suit your preferred timeframe (e.g. shorter for intraday scalps, longer for swing trades). Enable/disable the table if you prefer a cleaner pane.

My-Indicator - Global Liquidity & Money Supply M2 + Time OffsetThis script is designed to visualize a global liquidity and money supply index by combining data from various regions and, optionally, central bank activity. Visualizing this data on a chart allows you to see how central banks are intervening in the financial system and how the total amount of money in the economy is changing. Let’s take a look at how it works:
Central Bank Liquidity
Shows the actions of central banks (e.g. FED, ECB) providing short-term cash to commercial banks. If you see spikes or a steady increase in these indicators, it may suggest that liquidity is being increased through intervention, which often stimulates the market.
Money Supply
M2 money supply is a monetary aggregate that includes M1 (cash and current deposits) plus savings deposits, small term deposits, and other financial instruments that, while not as liquid as M1, can be quickly converted into cash. As a result, M2 provides a broader picture of the available money in the economy, which is useful for analyzing market conditions and potential economic trends.
How does it help investors?
It allows you to quickly see when central banks are injecting additional liquidity, which could signal higher prices.
It allows you to see trends in the money supply, which informs potential changes in inflation and the economic cycle.
Combining both sets of data provides a more complete picture – both in the short and long term – which makes it easier to predict upcoming price movements.
This allows investors to better respond to changes in central bank policy and broader monetary trends, increasing their chances of making better investment decisions.
Data Collection
The script retrieves money supply data for key markets such as the USA (USM2), Europe (EUM2), China (CNM2), and Japan (JPM2). It also offers additional money supply series for other markets—like Canada (CAM2), Great Britain (GBM2), Russia (RUM2), Brazil (BRM2), Mexico (MXM2), and New Zealand (NZM2)—with extra options (e.g., Australia, India, Korea, Indonesia, Malaysia, Sweden) disabled by default. Moreover, you can enable data for central bank liquidity (such as FED, RRP, TGA, ECB, PBC, BOJ, and other central banks), which are also disabled by default.
Index Calculation
The indicator calculates the index by adding together all the enabled money supply series (and the central bank data if activated) and then scales the sum by dividing it by 1,000,000,000,000 (one trillion). This scaling makes the resulting values more manageable and easier to read on the chart.
Time Offset Feature
A key feature of the script is the time offset. With the input parameter "Time Offset (days)", the user can shift the plotted index line by a specific number of days. The script converts the given offset in days into a number of bars based on the current chart's timeframe. This allows you to adjust for the delay between liquidity changes and their effect on asset prices.
Overall, the indicator plots a line on your chart representing the global liquidity and money supply index, allowing you to visually monitor trends and better understand how liquidity and central bank actions may influence market movements.
What makes this script different from others?
Every supported market—both major regions (USA, Eurozone, China, Japan, etc.) and additional ones—is available. You can toggle each series on or off, so you can view only Money Supply data, only Central Bank Liquidity, or any custom combination.
Separated Data Groups. Inputs are organized into clear groups (“Money Supply”, “Other Money Supply”, “Central Bank Liquidity”), making it easy to focus on just the data you need without clutter.
True Day‑Based Offset. This script converts your chosen “Time Offset (days)” into actual days regardless of timeframe. Whether you’re on a 5‑minute or daily chart, the index is always shifted by exactly the number of days you specify.

Quantum Delta Zones with EnhancementsQuantum Delta Zones (QDZ)
Short Title: QDZ
Overview
The Quantum Delta Zones (QDZ) is a unique technical indicator designed to highlight high-probability order block zones in the market based on a combination of Delta Sensitivity, order block tightness, and volume-based filters.
This indicator helps traders to identify key support and resistance levels (bullish and bearish order blocks) that are backed by strong volume and optimal market structure. It employs advanced zone detection and automatic zone management (box creation and deletion) to enhance trade analysis.
The primary objective of QDZ is to provide clear, visually appealing support/resistance zones while factoring in market order flow dynamics, ensuring that you are trading at optimal levels with confirmed volume behind it.
Key Features
Delta Sensitivity: The indicator uses a body-to-range ratio to assess the "delta" between the body and wick of each candlestick, helping to identify strong order block formations based on market sentiment.
Order Block Tightness: A filter is used to detect small, tight order blocks where price action shows accumulation (small body candles) near high-probability levels.
Projection Distance: The ability to project the detected order block zones into the future, providing an idea of where price might react based on historical price action.
Fade Strength: Allows you to adjust the transparency of the projected zones, giving you visual flexibility depending on how prominent you want these order blocks to appear.
Volume Filter: A high-volume filter ensures that only zones with substantial volume (based on a moving average) are considered for box creation, preventing false signals and low-probability trades.
Auto Box Deletion: When the market invalidates a zone (price moves beyond the zone’s projected area), the boxes are automatically deleted to keep the chart clean.
Alerts: Built-in alerts for when a bullish or bearish order block is detected, providing real-time notifications of significant potential trading opportunities.
How it Works
Step-by-Step Explanation:
Delta Sensitivity:
A candlestick is considered "Bullish" if the closing price is above the opening price and the body-to-range ratio is above the user-defined delta Sensitivity.
A candlestick is considered "Bearish" if the closing price is below the opening price with the same body-to-range ratio criteria.
Order Block Tightness:
The indicator looks for tight order blocks, where the body-to-range ratio is below the orderBlock Tightness setting, indicating small candles that may represent accumulation or distribution zones.
Volume Filter:
The indicator applies a filter to check if the volume is above the 50-period simple moving average (SMA) and multiplied by the user-defined volume Multiplier. Only zones with sufficient volume are considered.
Box Creation:
Once a valid order block is detected, the corresponding bullish or bearish box is drawn on the chart. These boxes extend forward by the number of bars specified by projection Bars.
Box Deletion:
If the price moves against the order block (for example, if a bullish box is invalidated when the price closes below its bottom), the box is automatically deleted to keep your chart uncluttered.
Alert System:
Alerts can be set for both bullish and bearish order block detection, notifying traders of the formation of a potential market opportunity.
Inputs / Settings
Delta Sensitivity: The ratio between the candlestick body and its range. Higher values mean stronger bullish/bearish pressure is required to trigger the order block detection.
Order Block Tightness: Defines how tight or small an order block should be to qualify for detection. Smaller values are more sensitive to smaller candlesticks.
Projection Distance: The number of bars into the future that the identified order block should be projected. Useful for seeing potential future support/resistance zones.
Fade Strength: Defines the transparency level of the order block boxes. Higher values result in more transparent boxes, lower values make the boxes more opaque.
Auto Delete: Automatically deletes order blocks if they are invalidated by price action.
Volume Filter: When enabled, only order blocks formed with higher-than-average volume will be considered. This helps eliminate low-probability signals.
Volume Multiplier: Multiplies the average volume by this factor to determine whether the current volume qualifies as "high" for an order block detection.
Visuals
Bullish Order Block: A green box is drawn when a bullish order block is detected. The box is projected forward based on the projection Bars setting.
Bearish Order Block: A red box is drawn when a bearish order block is detected. Similar to the bullish box, it is projected forward.
Fading: Both bullish and bearish boxes fade based on the fade Strength, making the most recent zones more visible while fading out older, less relevant zones.
How to Use in Trading
Bullish Order Block:
A bullish order block is a potential buy area. Once price retraces to the bottom of a detected bullish box, traders may consider it a buy zone, especially if it aligns with other technical factors (e.g., support, trend).
Bearish Order Block:
A bearish order block is a potential sell area. Once price retraces to the top of a detected bearish box, traders may consider it a sell zone, particularly in downtrends or near resistance.
Risk Management:
The projection Bars setting helps to set a clear projection distance. Traders should use their own risk management strategies, such as stop-loss placements below/above the order block zones, and take-profit levels based on market conditions.
Volume Confirmation:
The Volume Filter can be very useful for confirming order blocks. Trading only when an order block is accompanied by high volume ensures the zone has institutional or market-maker backing.
Box Deletion:
The Auto Delete feature automatically removes invalidated zones, keeping the chart clean and preventing you from trading out-of-date or broken levels.
Trading Strategy Example
Bullish Setup:
Look for a bullish order block (green box) formed after price has been trending down and volume is high.
Wait for price to retrace back into the order block zone.
Enter long at the bottom of the order block when price shows signs of support (e.g., bullish candlestick pattern).
Set stop-loss below the bottom of the order block and a take-profit target at a significant resistance level.
Bearish Setup:
Look for a bearish order block (red box) formed after price has been trending up and volume is high.
Wait for price to retrace back into the order block zone.
Enter short at the top of the order block when price shows signs of resistance (e.g., bearish candlestick pattern).
Set stop-loss above the top of the order block and a take-profit target at a significant support level.
Limitations
The QDZ indicator is based on historical price action, and while it is designed to identify areas of strong market participation, it does not guarantee future price behavior.
Traders should always combine this indicator with other technical analysis tools, such as trend analysis, oscillators, or fundamental factors, to improve their decision-making process.
Conclusion
The Quantum Delta Zones (QDZ) indicator is a powerful tool for traders looking to pinpoint high-probability order blocks that are backed by volume and strong market dynamics.
It integrates well with existing trading strategies by providing clear, actionable zones of support and resistance, while also offering advanced features like fade strength, auto-deletion, and volume filters.
Whether you're trading intraday or longer-term, this tool can be an essential part of your trading toolbox.
This is an educational idea, trade at your own desecration.
Regards.

Global M2The Global Liquidity M2 Indicator tracks the aggregate M2 money supply across major economies (e.g., US, China, Eurozone, Japan, UK), converted to USD for consistency. M2 includes cash, checking/savings deposits, and easily convertible near-money. It visualizes global liquidity trends, helping investors assess economic conditions and potential impacts on asset prices, like stocks or cryptocurrencies, with higher M2 levels often signaling increased liquidity and economic growth.

Altseason Index | AlchimistOfCrypto
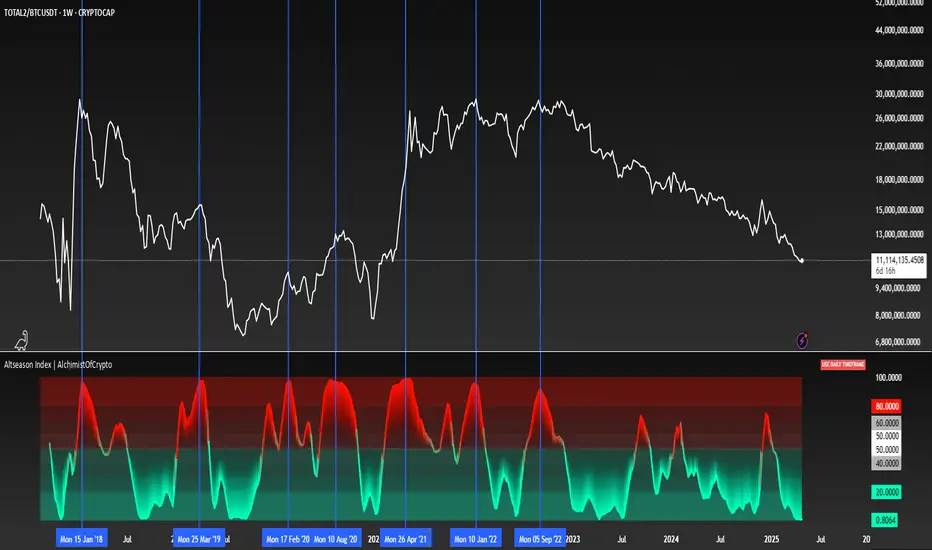
🌈 Altseason Index | AlchimistOfCrypto – Revealing Bitcoin-Altcoin Dominance Cycles 🌈
"The Altseason Index, engineered through advanced mathematical methodology, visualizes the probabilistic distribution of capital flows between Bitcoin and altcoins within a multi-cycle paradigm. This indicator employs statistical normalization principles where ratio coefficients create mathematical boundaries that define dominance transitions between cryptographic asset classes. Our implementation features algorithmically enhanced rainbow visualization derived from extensive market cycle analysis, creating a dynamic representation of value flow with adaptive color gradients that highlight critical phase transitions in the cyclical evolution of the crypto market."
📊 Professional Trading Application
The Altseason Index transcends traditional sentiment models with a sophisticated multi-band illumination system that reveals the underlying structure of crypto sector rotation. Scientifically calibrated across different ratios (TOTAL2/BTC, OTHERS/BTC) and featuring seamless daily visualization, it enables investors to perceive capital transitions between Bitcoin and altcoins with unprecedented clarity.
- Visual Theming 🎨
Scientifically designed rainbow gradient optimized for market cycle recognition:
- Green-Blue: Altcoin accumulation zones with highest capital flow potential
- Neutral White: Market equilibrium zone representing balanced capital distribution
- Yellow-Red: Bitcoin dominance regions indicating defensive capital positioning
- Gradient Transitions: Mathematical inflection points for strategic reallocation
- Market Phase Detection 🔍
- Precise zone boundaries demarcating critical sentiment shifts in the crypto ecosystem
- Daily timeframe calculation ensuring consistent signal reliability
- Multiple ratio analysis revealing the probabilistic nature of market capital flows
🚀 How to Use
1. Identify Market Phase ⏰: Locate the current index relative to colored zones
2. Understand Capital Flow 🎚️: Monitor transitions between Bitcoin and altcoin dominance
3. Assess Mathematical Value 🌈: Determine optimal allocation based on zone location
4. Adjust Investment Strategy 🔎: Modulate position sizing based on dominance assessment
5. Prepare for Rotation ✅: Anticipate capital shifts when approaching extreme zones
6. Invest with Precision 🛡️: Accumulate altcoins in lower zones, reduce in upper zones
7. Manage Risk Dynamically 🔐: Scale portfolio allocations based on index positioning
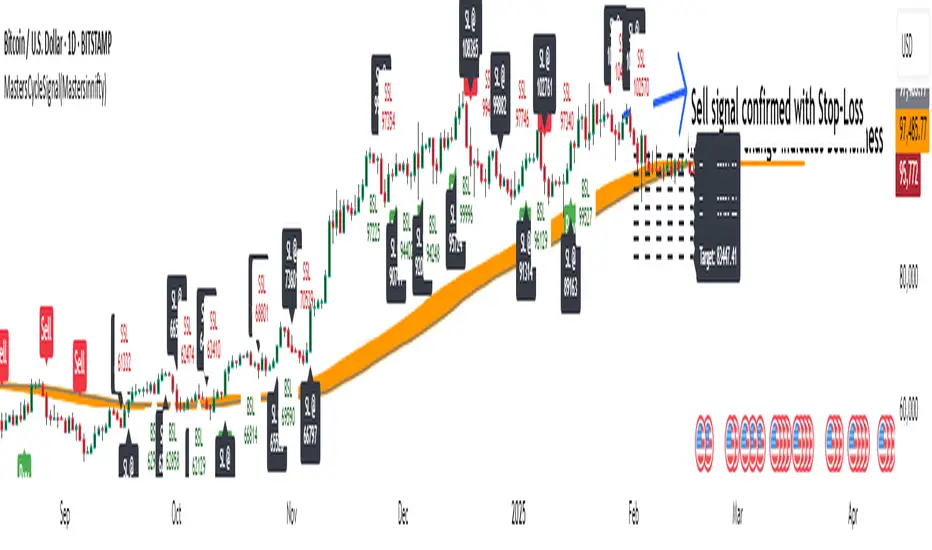
MastersCycleSignal(Mastersinnifty)Overview
MastersCycleSignal is a high-precision market timing and projection indicator for trend-following and swing traders.
It combines an adaptive cycle detection algorithm, forward-looking sine wave projections, dynamic momentum confirmation, and Gann Square of 9-based geometric targets into a complete structured trading framework.
The script continuously analyzes price oscillations to detect dominant cycles, projects expected price behavior with future-facing sine approximations, and generates buy/sell signals once confirmed by adaptive momentum filtering.
Upon confirmation, it calculates mathematically consistent Gann-based target levels and risk-managed stop-loss suggestions.
Users also benefit from auto-extending targets as price action unfolds — helping traders anticipate rather than react to market shifts.
---
Uniqueness
MastersCycleSignal stands apart through a unique fusion of techniques:
- Dynamic Cycle Detection
- Detects dominant cycles using a cosine correlation maximization method between detrended price (close minus SMA) and theoretical cosine curves, dynamically recalibrated across a sliding window.
- Sine Wave Future Projection
- Smooths and projects future price paths by approximating a forward sine wave based on the real-time detected dominant cycle.
- Adaptive Momentum Filtering
- Volatility is scaled by divergence between normalized returns and a 5-period EMA, further adjusted by an RSI(2) factor.
- This makes buy/sell signal confirmation robust against noise and false breakouts.
- Gann-Based Target Computation
- Uses a square-root transformation of price, incremented by selectable Gann Square of 9 degrees, for calculating progressive and dynamically expanding price targets.
- Auto-Extending Targets
- As price achieves a projected target, the system automatically draws subsequent new targets based on the prior target differential — providing continuous guidance in trending conditions.
---
Usefulness
MastersCycleSignal is built to help traders:
- Identify early trend reversals through cycle shifts.
- Forecast probable price paths in advance.
- Plan systematic target and stop-loss zones with geometric accuracy.
- Reduce guesswork in trend-following and swing trading.
- Maintain structured discipline across intraday, swing, and positional strategies.
It works seamlessly across stocks, indices, forex, commodities, and crypto markets — on any timeframe.
---
How to Use
- Attach the indicator to your desired chart.
- When a Buy Signal or Sell Signal appears (green or red markers):
- Use the attached stop-loss labels to manage risk.
- Monitor the automatically plotted target lines for partial exits or full profits.
- The orange projected sine wave illustrates the expected future market path.
- Customization Options:
- Cycle Detection Length — adjust to fine-tune cycle sensitivity.
- Projection Length — modify the forward distance of sine wave forecast.
- Gann Square of 9 Degrees — personalize target increments.
- Toggle Signals and Target visibility as needed.
---
Disclaimer
- MastersCycleSignal uses no future data or lookahead bias.
- All projections are based on geometric extrapolations from historical price action — not guaranteed predictions.
- Trading involves risks, and historical cycle behavior may differ in future conditions.
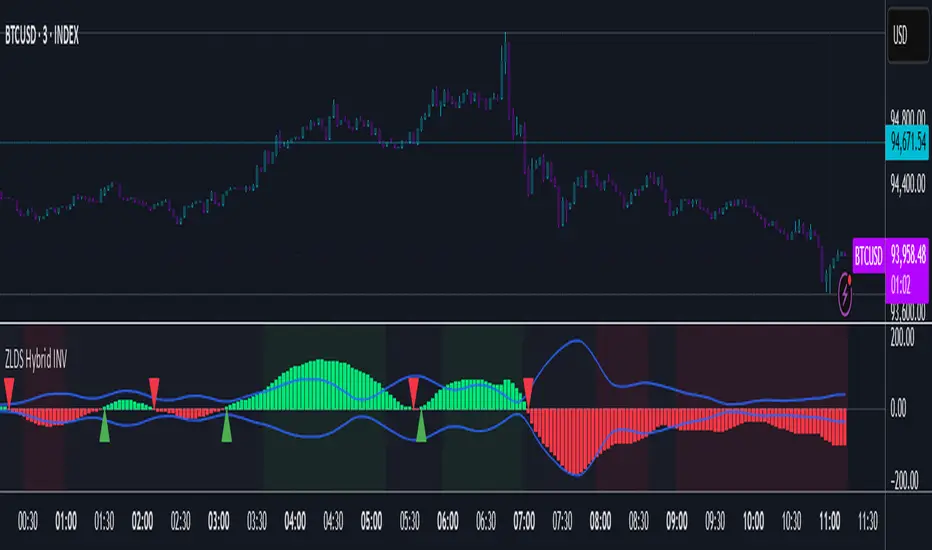
Zero Lag Delta System [Hybrid Version] - Inverted🔹 Zero Lag Delta System — Inverted 🔹
The Zero Lag Delta System is a hybrid momentum oscillator designed to capture real-time trend shifts and market strength with maximum responsiveness and minimum lag.
Unlike traditional moving averages or momentum indicators, this tool applies a zero lag smoothing algorithm on price data to reduce delay without sacrificing stability.
It then measures the dynamic delta — the difference between two zero lag averages — to track the push and pull between bullish and bearish pressure in real time.
Key Features:
📈 Bullish momentum appears as green bars rising above the centerline.
📉 Bearish momentum appears as red bars falling below the centerline.
🧠 Zero lag smoothing provides faster and cleaner trend recognition.
🧩 Dynamic bands adapt to volatility, highlighting when moves are statistically significant.
🎯 Auto background coloring shows when momentum is strong, weak, or neutral.
🔔 Built-in alerts for bullish and bearish zero crosses.
🧠 How to Trade with Zero Lag Delta System:
1. Bullish Cross:
Signal: Delta crosses above the zero line.
Possible Action: Look for potential long (buy) opportunities.
2. Bearish Cross:
Signal: Delta crosses below the zero line.
Possible Action: Look for potential short (sell) opportunities.
3. Breakout Above Upper Band:
Signal: Strong bullish momentum confirmed by breakout over the dynamic upper band.
Possible Action: Consider aggressive long entries with trend confirmation.
4. Breakout Below Lower Band:
Signal: Strong bearish momentum confirmed by breakout under the dynamic lower band.
Possible Action: Consider aggressive short entries with trend confirmation.
5. Return to Neutral Zone:
Signal: Delta moves back toward the centerline, indicating weakening momentum.
Possible Action: Be cautious, tighten stops, or stay neutral until a clear signal emerges.
📚 Example Trading Scenarios:
Trend Entry:
When delta crosses above the zero line and stays above, price often enters a healthy uptrend. Look for pullbacks to enter with the trend.
Breakout Confirmation:
If delta moves sharply outside the dynamic bands (especially after consolidation), it often confirms a new momentum breakout.
Divergence Detection:
If price makes new highs but delta fails to do so (or vice versa), it may hint at hidden reversal opportunities.
⚡ Why Use Dynamic Bands Instead of Fixed Levels?
Unlike traditional 20/80 fixed levels that assume static market behavior, dynamic bands adapt automatically to current volatility conditions.
This ensures the indicator remains highly sensitive during calm markets, yet avoids overreacting during high-volatility phases.
Dynamic bands provide:
✅ Better precision in spotting true momentum breakouts.
✅ More accurate filtering of noise during sideways markets.
✅ A more adaptive and universal system across different assets (forex, crypto, stocks).
🔥 Final Thoughts:
The Zero Lag Delta System provides a simple yet powerful visual framework for understanding price momentum at a deeper level.
Use it alongside your existing strategy to refine entries, exits, and overall trend bias.
As always, combine with price action and risk management for best results.
This is an educational idea, and past performance may not replicate itself.
Happy trading! 🚀
GGG - Market Breadth UST vs GoldThis indicator provides a dynamic macro view between the 10YR U.S. Treasury future market and Gold prices. It combines bond market momentum with gold technical trend confirmation to enhance trading decision-making.
Recommended Timeframes: Suitable for intraday to swing trading setups (e.g., 15-minutes, 1-hour, 4-hour).
Notes:
REMARK: This indicator is designed as a macro filter or confirmation tool. It is highly recommended to use in conjunction with your preferred entry/exit techniques for optimal performance.

EMA20/50/100/200 with extended lines and labels by TradeCrafted📈 EMA20/50/100/200 with Extended Lines and Labels by TradeCrafted
Overview
This script plots four key Exponential Moving Averages (EMAs) — 20, 50, 100, and 200 — directly on the chart for enhanced trend visualization.
In addition to the standard plots, it extends each EMA forward with a projected line, helping traders anticipate potential future dynamic support and resistance zones.
Clear, color-coded labels are attached to each EMA, updating live to improve chart readability without clutter.
This tool is designed for educational and informational purposes only and does not provide financial advice or guaranteed trading results.
✨ Features
Plots EMA 20, EMA 50, EMA 100, and EMA 200 in distinct colors.
Extends each EMA line forward by a user-defined number of bars.
Dynamic floating labels show the EMA name and live value.
Minimalistic and clean design, ideal for all trading styles.
Open-source and customizable for user transparency.
📚 Usage
Use this indicator to:
Identify overall market trends across different timeframes.
Spot potential areas of dynamic support and resistance.
Observe EMA crossovers for possible trend shifts.
⚠️ Disclaimer
This script is intended for educational and informational purposes only.
It does not constitute financial advice or a recommendation to buy or sell any asset.
Always perform your own analysis before making trading decisions.

Dskyz Options Flow Flux (OFF) - FuturesDskyz Options Flow Flux (OFF) - Futures
*This is a repost due to moderator intervention on use of ™ in my scripts. I'm in the process of getting this rectified. This was originally posted around mid-night CDT.
🧠 The Dskyz Options Flow Flux (OFF) - Futures indicator is a game changer for futures traders looking to tap into institutional activity with limited resources. Designed for TradingView this tool simulates options flow data (call/put volume and open interest) for futures contracts like MNQ MES NQ and ES giving u actionable insights through volume spike detection volatility adjustments and stunning visuals like aurora flux bands and round number levels. Whether u’re a beginner learning the ropes or a pro hunting for an edge this indicator delivers real time market sentiment and key price levels to boost ur trading game
Key Features
⚡ Simulated Options Flow: Breaks down call/put volume and open interest using market momentum and volatility
📈 Spike Detection: Spots big moves in volume and open interest with customizable thresholds
🧠 Volatility Filter: Adapts to market conditions using ATR for smarter spike detection
✨ Aurora Flux Bands: Glows with market sentiment showing u bullish or bearish vibes at a glance
🎯 Round Number Levels: Marks key psychological levels where big players might step in
📊 Interactive Dashboard: Real time metrics like sentiment score and volatility factor right on ur chart
🚨 Alerts: Get notified of bullish or bearish spikes so u never miss a move
How It Works
🧠 This indicator is built to make complex options flow analysis simple even with the constraints of Pine Script. Here’s the step by step:
Simulated Volume Data (Dynamic Split):
Pulls daily volume for ur chosen futures contract (MNQ1! MES1! NQ1! ES1!)
Splits it into call and put volume based on momentum (ta.mom) and volatility (ATR vs its 20 period average)
Estimates open interest (OI) for calls and puts (1.15x for calls 1.1x for puts)
Formula: callRatio = 0.5 + (momentum / close) * 10 + (volatility - 1) * 0.1 capped between 0.3 and 0.7
Why It Matters: Mimics how big players might split their trades giving u a peek into institutional sentiment
Spike Detection:
Compares current volume/OI to short term (lookbackShort) and long term (lookbackLong) averages
Flags spikes when volume/OI exceeds the average by ur set threshold (spikeThreshold for regular highConfidenceThreshold for strong)
Adjusts for volatility so u’re not fooled by choppy markets
Output: optionsSignal (2 for strong bullish -2 for strong bearish 1 for bullish -1 for bearish 0 for neutral)
Why It Matters: Pinpoints where big money might be stepping in
Volatility Filter:
Uses ATR (10 periods) and its 20 period average to calculate a volatility factor (volFactor = ATR / avgAtr)
Scales spike thresholds based on market conditions (volAdjustedThreshold = spikeThreshold * max(1 volFactor * volFilter))
Why It Matters: Keeps ur signals reliable whether the market is calm or wild
Sentiment Score:
Calculates a call/put ratio (callVolume / putVolume) and adjusts for volatility
Converts it to a 0 to 100 score (higher = bullish lower = bearish)
Formula: sentimentScore = min(max((volAdjustedSentiment - 1) * 50 0) 100)
Why It Matters: Gives u a quick read on market bias
Round Number Detection:
Finds the nearest round number (e.g. 100 for MNQ1! 50 for MES1!)
Checks for volume spikes (volume > 3 period SMA * spikeThreshold) and if price is close (within ATR * atrMultiplier)
Updates the top activity level every 15 minutes when significant activity is detected
Why It Matters: Highlights psychological levels where price often reacts
Visuals and Dashboard:
Combines aurora flux bands glow effects round number lines and a dashboard to make insights pop (see Visual Elements below)
Plots triangles for call/put spikes (green/red for strong lime/orange for regular)
Sets up alerts for key market moves
Why It Matters: Makes complex data easy to read at a glance
Inputs and Customization
⚙️ Beginners can tweak these settings to match their trading style while pros can dig deeper for precision:
Futures Symbol (symbol): Pick ur contract (MNQ1! MES1! NQ1! ES1!). Default: MNQ1!
Short Lookback (lookbackShort): Days for short term averages. Smaller = more sensitive. Range: 1+. Default: 5
Long Lookback (lookbackLong): Days for long term averages. Range: 5+. Default: 10
Spike Threshold (spikeThreshold): How big a spike needs to be (e.g. 1.1 = 10% above average). Range: 1.0+. Default: 1.1
High Confidence Threshold (highConfidenceThreshold): For strong spikes (e.g. 3.0 = 3x average). Range: 2.0+. Default: 3.0
Volatility Filter (volFilter): Adjusts for market volatility (e.g. 1.2 = 20% stricter in volatile markets). Range: 1.0+. Default: 1.2
Aurora Flux Transparency (glowOpacity): Controls band transparency (0 = solid 100 = invisible). Range: 0 to 100. Default: 65
Show Show OFF Dashboard (showDashboard): Toggles the dashboard with key metrics. Default: true
Show Nearest Round Number (showRoundNumbers): Displays round number levels. Default: true
ATR Multiplier for Proximity (atrMultiplier): How close price needs to be to a round number (e.g. 1.5 = within 1.5x ATR). Range: 0.5+. Default: 1.5
Functions and Logic
🧠 Here’s the techy stuff pros will love:
Simulated Volume Data : Splits daily volume into call/put volume and OI using momentum and volatility
Volatility Filter: Scales thresholds with volFactor = atr / avgAtr for adaptive detection
Spike Detection: Flags spikes and assigns optionsSignal (2, -2, 1, -1, 0) for sentiment
Sentiment Score: Converts call/put ratio into a 0-100 score for quick bias reads
Round Number Detection: Identifies key levels and significant activity for trading zones
Dashboard Display: Updates real time metrics like sentiment score and volatility factor
Visual Elements
✨ These visuals make data come alive:
Gradient Background: Green (bullish) red (bearish) or yellow (neutral/choppy) at 95% transparency to show trend
Aurora Flux Bands: Stepped bands (linewidth 3) around a 14 period EMA ± ATR * 1.8. Colors shift with sentiment (green red lime orange gray) with glow effects at 85% transparency
Round Number Visualization: Stepped lines (linewidth 2) at key levels (solid if active dashed if not) with labels (black background white text size.normal)
Visual Signals: Triangles above/below bars for spikes (size.small for strong size.tiny for regular)
Dashboard: Bottom left table (2 columns 10 rows) with a black background (29% transparency) gray border and metrics:
⚡ Round Number Activity: “Detected” or “None”
📈 Trend: “Bullish” “Bearish” or “Neutral” (colored green/red/gray)
🧠 ATR: Current 10 period ATR
📊 ATR Avg: 20 period SMA of ATR
📉 Volume Spike: “YES” (green) or “NO” (red)
📋 Call/Put Ratio: Current ratio
✨ Flux Signal: “Strong Bullish” “Strong Bearish” “Bullish” “Bearish” or “Neutral” (colored green/red/gray)
⚙️ Volatility Factor: Current volFactor
📈 Sentiment Score: 0-100 score
Usage and Strategy Recommendations
🎯 For Beginners: Use high confidence spikes (green/red triangles) for easy entries. Check the dashboard for a quick market read (sentiment score above 60 = bullish below 40 = bearish). Watch round number levels for support/resistance
💡 For Pros: Combine flux signals with round number activity for high probability setups. Adjust lookbackShort/lookbackLong for trending vs choppy markets. Use volFactor for position sizing (higher = smaller positions)

Custom Performance TableThis script generates a table designed to provide a concise yet highly customizable overview of the performance of multiple financial instruments, displayed directly on the chart. The table can include up to 40 tickers, each individually configurable, with values updated in real time based on either the current chart timeframe or a specific user-selected timeframe.
NOTE : The update frequency of the table values depends on the refresh rate of the chart's main ticker to which the indicator is applied. To ensure a consistent and reliable data feed, especially when monitoring heterogeneous instruments, it is recommended to apply the indicator to a highly liquid and continuously traded asset, such as BTCUSD.
PERFORMANCE CALCULATION MODES
You can choose from three different performance calculation modes:
1) Change % (Percentage Change)
Displays the percentage change of the current price compared to the previous candle within the selected timeframe.
(Current Price - Previous Price) / Previous Price * 100
This mode provides an immediate and straightforward measure of each instrument's percentage movement, useful for quick visual comparisons of relative strength among assets.
2) Z-Score
The Z-Score measures how much the current price variation deviates from the historical average variation, relative to the standard deviation of those variations.
(Current Variation - Average Variation) / Standard Deviation of Variations
The result indicates how statistically unusual a movement is:
- Values near 0 suggest normal variations.
- Values above ±2 indicate statistically significant deviations.
This is a valuable tool for identifying overbought/oversold conditions or market stress events and is often used in mean reversion strategies.
NOTE : Due to technical constraints, Z-Score can only be calculated when the selected timeframe matches the chart's timeframe exactly.
3) RAROC (Risk-Adjusted Return on Capital)
RAROC expresses an asset's performance in relation to the risk taken, measured through its volatility (standard deviation of price).
Percentage Change / Standard Deviation of Price
It allows for an assessment of return efficiency in relation to volatility.
A high RAROC value indicates a high return relative to the risk, making it a useful tool for comparing assets with different risk profiles. It is especially suitable for portfolio selection and allocation purposes.
TABLE CONFIGURATION
Each ticker can be customized with its own label, colors, and position in the table.
Each row can display the ticker name or a custom label, which, at the user's discretion, can either replace the name or be shown as an informational tooltip.
The table can be placed anywhere on the chart using horizontal and vertical offset parameters. Thanks to offset support, you can, for example, create financial market overview layouts. This can be done by completely “cleaning” the chart from price and indicators using TradingView settings, and then displaying multiple tables simultaneously (see the example chart published here).
Advanced customization options are also available for the table's appearance, including font settings, colors, borders, and more.
CALCULATION TIMEFRAME
The indicator allows the user to force a specific timeframe (Daily, Weekly, Monthly, Yearly) when applied to intraday charts.
However, for Z-Score mode, the selected timeframe must match the chart's timeframe exactly to ensure correct computation. Otherwise, the script will halt until settings are properly adjusted.
USAGE NOTES
Custom Performance Table is a flexible and adaptable tool, suitable for both intraday operations and medium- to long-term analysis. It is designed for traders and analysts who need to compare assets based on quantitative metrics, whether simple (like percentage change) or more advanced and risk-adjusted (such as Z-Score and RAROC).
