ILM & IFVG StrategyPlease feel free to adjust in any way possible. Let me know if you can create something better from this initial coding.
//═══════════════════════════════════════════════════════════════════════
// Inverted Liquidity Model (ILM) – Strategy
//═══════════════════════════════════════════════════════════════════════
//
// The **Inverted Liquidity Model (ILM)** is a liquidity-based algorithm
// built to capture high-probability reversals after:
//
// • A liquidity sweep (SSL/BSL taken)
// • Rejection back inside the range
// • A Fair Value Gap (FVG) forms
// • That FVG becomes invalidated → becomes an IFVG entry zone
//
// ILM combines:
// • LTF BOS / CHOCH structure confirmation
// • HTF structure (expansion) filtering
// • Premium / Discount filter (17:00 CST session midline)
// • Optional ATR volatility filter
// • Optional trading session restrictions
// • Optional partial profit-taking + runners
//
// When all conditions align, the strategy enters:
// ✔ Long after sweep of SSL + valid long IFVG + trend confirmation
// ✔ Short after sweep of BSL + valid short IFVG + trend confirmation
//
// Stops are placed at the sweep wick.
// Full target is set at the next structural high/low.
// Optional partial TP sends a runner to full target.
//
// Visual tools (labels, sweep lines, IFVG boxes, midline) assist
// with review and forward testing.
//
//───────────────────────────────────────────────────────────────────────
// USER CONFIGURABLE FEATURES
//───────────────────────────────────────────────────────────────────────
//
// • **Liquidity & Structure**
// - pivotLen → swing length for pivots / liquidity
// - htfOn → toggle higher-timeframe pivots
// - htfTF → timeframe for HTF structure/liquidity
// - useStructureFilter → enforce LTF BOS/CHOCH trend
// - useHtfExpansionFilter → enforce HTF trend
// - showStructureLabels → show BOS/CHOCH labels
// - showHtfStructureLabels → show HTF BOS/CHOCH labels
//
// • **Premium / Discount Midline**
// - usePremiumDiscountFilter → only long in discount / short in premium
// - pdSession → session used for midline (default 17:00 CST)
// - showPdMidLine → show 50% midline
//
// • **FVG / IFVG Detection**
// - useBodyGapFVG → FVG uses candle bodies instead of wicks
// - useDisplacementFVG → require displacement bar
// - dispAtrMult → minimum ATR threshold for displacement
// - showIFVG → draw IFVG boxes
//
// • **ATR / Volatility / Sessions**
// - useRangeFilter → require minimum ATR%
// - atrLen → ATR period
// - minAtrPerc → minimum ATR% of price
// - useSessionFilter → restrict trading hours
// - sessionTimes → allowed trading session
//
// • **Sweep Visualization**
// - showSweepLines → draw sweep lines at SSL/BSL sweeps
// - sweepLineWidth → thickness of sweep lines
//
// • **Exits: Partial Targets & Runners**
// - usePartialTargets → enable partial TP logic
// - tp1QtyPercent → percent closed at TP1
// - tp1FractionOfPath → TP1 relative to path to full target
//
// • **Formatting / Visibility**
// - labelFontSizeInput → tiny / small / normal / large / huge
// - showEntries → entry markers
// - showTargets → target lines
//
//═══════════════════════════════════════════════════════════════════════
// END OF STRATEGY DESCRIPTION
//═══════════════════════════════════════════════════════════════════════
Buscar en scripts para "zone"

Bollinger Bands Breakout StrategyHey guys check out this strategy script.
Chart plotting:
I use a classic plot of Bollinger Bands to define a consolidation zone, I also use a separate Trend Filter (SMA).
Logic:
When the price is above the SMA and above the Bollinger Upper Band the strategy goes Long. When the price is below the SMA and below the Bollinger Lower Band the strategy goes Short. Simple.
Exits:
TP and SL are a percentage of the price.
Notes: This simple strategy can be used at any timeframe (I prefer the 15min for day trading). It avoids consolidation, when the price is inside the Bollinger Bands, and has a good success rate. Adjust the Length of the BB to suit your style of trading (Lower numbers=more volatile, Higher numbers=more restrictive). Also you can adjust the Trend Filter SMA, I presonally chose the 50 SMA. Finally the SL/TP can be also adjusted from the input menu.
Test it for yourself!
Have great trades!

Pump-Smart Shorting StrategyThis strategy is built to keep your portfolio hedged as much as possible while maximizing profitability. Shorts are opened after pumps cool off and on new highs (when safe), and closed quickly during strong upward moves or if stop loss/profit targets are hit. It uses visual overlays to clearly show when hedging is on, off, or blocked due to momentum, ensuring you’re protected in most market conditions but never short against the pump. Fast re-entry keeps the hedge active with minimal downtime.
Pump Detection:
RSI (Relative Strength Index): Calculated over a custom period (default 14 bars). If RSI rises above a threshold (default 70), the strategy considers the market to be in a pump (strong upward momentum).
Volume Spike: The current volume is compared to a 20-bar simple moving average of volume. If it exceeds the average by 1.5× and price increases at least 5% in one bar, pump conditions are triggered.
Price Jump: Measured by (close - close ) / close . A single-bar change > 5% helps confirm rapid momentum.
Pump Zone (No Short): If any of these conditions is true, an orange or red background is shown and shorts are blocked.
Cooldown and Re-Entry:
Cooldown Detection: After the pump ends, RSI must fall below a set value (default ≤ 60), and either volume returns towards average or price momentum is less than half the original spike (oneBarUp <= pctUp/2).
barsWait Parameter: You can specify a waiting period after cooldown before a short is allowed.
Short Entry After Pump/Cooldown: When these cooldown conditions are met, and no short is active, a blue background is shown and a short position is opened at the next signal.
New High Entry:
Lookback New High: If the current high is greater than the highest high in the last N bars (default 20), and pump is NOT active, a short can be opened.
Take Profit (TP) & Stop Loss (SL):
Take Profit: Short is closed if price falls to a threshold below the entry (minProfitPerc, default 2%).
Stop Loss: Short is closed if price rises to a threshold above the entry (stopLossPerc, default 6%).
Preemptive Exit:
Any time a pump is detected while a short position is open, the strategy closes the short immediately to avoid losses.
Visual Feedback:
Orange Background: Market is pumping, do not short.
Red Background: Other conditions block shorts (cooldown or waiting).
Blue Background: Shorts allowed.
Triangles/Circles: Mark entries, pump start/end, for clear trading signals.

PG DMean & Price Sync ver 9.4 - ConsolidatedPG DMean & Price Sync Strategy (SD Filter)
This strategy combines the momentum-oscillator properties of the Detrended Mean (DMean) with a Standard Deviation (SD) Price Filter for confirming trend direction, aiming to isolate high-conviction trades while actively managing risk.
🔑 Core Logic
DMean Momentum Signal: The strategy's primary engine is the DMean, which measures the percentage difference between the current closing price and a longer-term Moving Average (price_ma). It is then smoothed by a DMean Signal line (MA of the DMean).
Entry Signal: A trade is triggered when the DMean line crosses above (for Long) or below (for Short) its Signal Line, but it must clear a user-defined Dead Zone Threshold to confirm momentum commitment.
SD Filter Confirmation (Price Sync): A Standard Deviation Channel, based on a separate user-defined price source and period, is used to filter trades.
Long Filter: Allows Long entries only when the price is trading above the lower SD band, suggesting the current price action is stronger than the recent average volatility to the downside.
Short Filter: Allows Short entries only when the price is currently below the Filter Basis (SMA), confirming a bearish stance within the SD channel.
🛡️ Risk & Exit Management
Primary Exit: All trades are exited by reverse DMean Crossover/Crossunder, meaning the position is closed when the DMean momentum reverses against the open trade (e.g., DMean crosses under the Signal to exit a Long).
Hard Stop Loss (Short Trades): A mandatory percentage-based Hard Stop Loss is implemented only for short positions to protect against sudden upward price spikes, closing the trade if the loss exceeds the set percentage. (Note: This version does not include a Hard SL for Long trades).
📊 Performance Dashboard
A custom Performance Dashboard Table is displayed at the bottom right of the chart to provide real-time, at-a-glance comparison of the strategy's equity performance versus a simple Buy & Hold over the selected backtesting date range.

Scalping Strategy: FVG + Engulfing
This is a scalping strategy based on the Fair Value Gap (FVG) and Engulfing pattern confirmation. It identifies the high and low of the first 5-minute candle after the 9:30 AM EST market open and waits for a breakout supported by a Fair Value Gap. A trade is only triggered after a retest of the FVG zone followed by an engulfing candle in the direction of the breakout. Trades are entered with a fixed 3:1 risk-to-reward ratio and limited to 2 entries per trading day to avoid overtrading. Ideal for NASDAQ scalping on a 1-minute chart.

J12Matic Builder by galgoomA flexible Renko/tick strategy that lets you choose between two entry engines (Multi-Source 3-way or QBand+Moneyball), with a unified trailing/TP exit engine, NY-time trading windows with auto-flatten, daily profit/loss and trade-count limits (HALT mode), and clean webhook routing using {{strategy.order.alert_message}}.
Highlights
Two entry engines
Multi-Source (3): up to three long/short sources with Single / Dual / Triple logic and optional lookback.
QBand + Moneyball: Gate → Trigger workflow with timing windows, OR/AND trigger modes, per-window caps, optional same-bar fire.
Unified exit engine: Trailing by Bricks or Ticks, plus optional static TP/SL.
Session control (NY time): Evening / Overnight / NY Session windows; auto-flatten at end of any enabled window.
Day controls: Profit/Loss (USD) and Trade-count limits. When hit, strategy HALTS new entries, shows an on-chart label/background.
Alert routing designed for webhooks: Every order sets alert_message= so you can run alerts with:
Condition: this strategy
Notify on: Order fills only
Message: {{strategy.order.alert_message}}
Default JSONs or Custom payloads: If a Custom field is blank, a sensible default JSON is sent. Fill a field to override.
How to set up alerts (the 15-second version)
Create a TradingView alert with this strategy as Condition.
Notify on: Order fills only.
Message: {{strategy.order.alert_message}} (exactly).
If you want your own payloads, paste them into Inputs → 08) Custom Alert Payloads.
Leave blank → the strategy sends a default JSON.
Fill in → your text is sent as-is.
Note: Anything you type into the alert dialog’s Message box is ignored except the {{strategy.order.alert_message}} token, which forwards the payload supplied by the strategy at order time.
Publishing notes / best practices
Renko users: Make sure “Renko Brick Size” in Inputs matches your chart’s brick size exactly.
Ticks vs Bricks: Exit distances switch instantly when you toggle Exit Units.
Same-bar flips: If enabled, a new opposite signal will first close the open trade (with its exit payload), then enter the new side.
HALT mode: When day profit/loss limit or trade-count limit triggers, new entries are blocked for the rest of the session day. You’ll see a label and a soft background tint.
Session end flatten: Auto-closes positions at window ends; these exits use the “End of Session Window Exit” payload.
Bar magnifier: Strategy is configured for on-close execution; you can enable Bar Magnifier in Properties if needed.
Default JSONs (used when a Custom field is empty)
Open: {"event":"open","side":"long|short","symbol":""}
Close: {"event":"close","side":"long|short|flat","reason":"tp|sl|flip|session|limit_profit|limit_loss","symbol":""}
You can paste any text/JSON into the Custom fields; it will be forwarded as-is when that event occurs.
Input sections — user guide
01) Entries & Signals
Entry Logic: Choose Multi-Source (3) or QBand + Moneyball (pick one).
Enable Long/Short Signals: Master on/off switches for entering long/short.
Flip on opposite signal: If enabled, a new opposite signal will close the current position first, then open the other side.
Signal Logic (Multi-Source):
Single: any 1 of the 3 sources > 0
Dual: Source1 AND Source2 > 0
Triple (default): 1 AND 2 AND 3 > 0
Long/Short Signal Sources 1–3: Provide up to three series (often indicators). A positive value (> 0) is treated as a “pulse”.
Use Lookback: Keeps a source “true” for N bars after it pulses (helps catch late triggers).
Long/Short Lookback (bars): How many bars to remember that pulse.
01b) QBands + Moneyball (Gate -> Trigger)
Allow same-bar Gate->Trigger: If ON, a trigger can fire on the same bar as the gate pulse.
Trigger must fire within N bars after Gate: Size of the gate window (in bars).
Max signals per window (0 = unlimited): Cap the number of entries allowed while a gate window is open.
Buy/Sell Source 1 – Gate: Gate pulse sources that open the buy/sell window (often a regime/zone, e.g., QBands bull/bear).
Trigger Pulse Mode (Buy/Sell): How to detect a trigger pulse from the trigger sources (Change / Appear / Rise>0 / Fall<0).
Trigger A/B sources + Extend Bars: Primary/secondary triggers plus optional extension to persist their pulse for N bars.
Trigger Mode: Pick S2 only, S3 only, S2 OR S3, or S2 AND S3. AND mode remembers both pulses inside the window before firing.
02) Exit Units (Trailing/TP)
Exit Units: Choose Bricks (Renko) or Ticks. All distances below switch accordingly.
03) Tick-based Trailing / Stops (active when Exit Units = Ticks)
Initial SL (ticks): Starting stop distance from entry.
Start Trailing After (ticks): Start trailing once price moves this far in your favor.
Trailing Distance (ticks): Offset of the trailing stop from peak/trough once trailing begins.
Take Profit (ticks): Optional static TP distance.
Stop Loss (ticks): Optional static SL distance (overrides trailing if enabled).
04) Brick-based Trailing / Stops (active when Exit Units = Bricks)
Renko Brick Size: Must match your chart’s brick size.
Initial SL / Start Trailing After / Trailing Distance (bricks): Same definitions as tick mode, measured in bricks.
Take Profit / Stop Loss (bricks): Optional static distances.
05) TP / SL Switch
Enable Static Take Profit: If ON, closes the trade at the fixed TP distance.
Enable Static Stop Loss (Overrides Trailing): If ON, trailing is disabled and a fixed SL is used.
06) Trading Windows (NY time)
Use Trading Windows: Master toggle for all windows.
Evening / Overnight / NY Session: Define each session in NY time.
Flatten at End of : Auto-close any open position when a window ends (sends the Session Exit payload).
07) Day Controls & Limits
Enable Profit Limits / Profit Limit (Dollars): When daily net PnL ≥ limit → auto-flatten and HALT.
Enable Loss Limits / Loss Limit (Dollars): When daily net PnL ≤ −limit → auto-flatten and HALT.
Enable Trade Count Limits / Number of Trades Allowed: After N entries, HALT new entries (does not auto-flatten).
On-chart HUD: A label and soft background tint appear when HALTED; a compact status table shows Day PnL, trade count, and mode.
08) Custom Alert Payloads (used as strategy.order.alert_message)
Long/Short Entry: Payload sent on entries (if blank, a default open JSON is sent).
Regular Long/Short Exit: Payload sent on closes from SL/TP/flip (if blank, a default close JSON is sent).
End of Session Window Exit: Payload sent when any enabled window ends and positions are flattened.
Profit/Loss/Trade Limit Close: Payload sent when daily profit/loss limit causes auto-flatten.
Tip: Any tokens you include here are forwarded “as is”. If your downstream expects variables, do the substitution on the receiver side.
Known limitations
No bracket orders from Pine: This strategy doesn’t create OCO/attached brackets on the broker; it simulates exits with strategy logic and forwards your payloads for external automation.
alert_message is per order only: Alerts fire on order events. General status pings aren’t sent unless you wire a separate indicator/alert.
Renko specifics: Backtests on synthetic Renko can differ from live execution. Always forward-test on your instrument and settings.
Quick checklist before you publish
✅ Brick size in Inputs matches your Renko chart
✅ Exit Units set to Bricks or Ticks as you intend
✅ Day limits/Windows toggled as you want
✅ Custom payloads filled (or leave blank to use defaults)
✅ Your alert uses Order fills only + {{strategy.order.alert_message}}

Script_Algo - ORB Strategy with Filters🔍 Core Concept: This strategy combines three powerful technical analysis tools: Range Breakout, the SuperTrend indicator, and a volume filter. Additionally, it features precise customization of the number of candles used to construct the breakout range, enabling optimized performance for specific assets.
🎯 How It Works:
The strategy defines a trading range at the beginning of the trading session based on a selected number of candles.
It waits for a breakout above the upper or below the lower boundary of this range, requiring a candle close.
It filters signals using the SuperTrend indicator for trend confirmation.
It utilizes trading volume to filter out false breakouts.
⚡ Strategy Features
📈 Entry Points:
Long: Candle close above the upper range boundary + SuperTrend confirmation
Short: Candle close below the lower range boundary + SuperTrend confirmation
🛡️ Risk Management:
Stop-Loss: Set at the opposite range boundary.
Take-Profit: Calculated based on a risk/reward ratio (3:1 by default).
Position Size: 10 contracts (configurable).
⚠️ IMPORTANT SETTINGS
🕐 Time Parameters:
Set the correct time and time zone!
❕ATTENTION: The strategy works ONLY with correct time settings! Set the time corresponding to your location and trading session.
📊 This strategy is optimized for trading TESLA stock!
Parameters are tailored to TESLA's volatility, and trading volumes are adequate for signal filtering. Trading time corresponds to the American session.
📈 If you look at the backtesting results, you can see that the strategy could potentially have generated about 70 percent profit on Tesla stock over six months on 5m timeframe. However, this does not guarantee that results will be repeated in the future; remain vigilant.
⚠️ For other assets, the following is required:
Testing and parameter optimization
Adjustment of time intervals and the number of candles forming the range
Calibration of stop-loss and take-profit levels
⚠️ Limitations and Drawbacks
🔗 Automation Constraints:
❌ Cannot be directly connected via Webhook to CFD brokers!
Additional IT solutions are required for automation, thus only manual trading based on signals is possible.
📉 Risk Management:
Do not risk more than 2-3% of your account per trade.
Test on historical data before live use.
Start with a demo account.
💪 Strategy Advantages
✅ Combined approach – multiple signal filters
✅ Clear entry and exit rules
✅ Visual signals on the chart
✅ Volume-based false breakout filtering
✅ Automatic position management
🎯 Usage Recommendations
Always test the strategy on historical data.
Start with small trading volumes.
Ensure time settings are correct.
Adapt parameters to current market volatility.
Use only for stocks – futures and Forex require adaptation.
📚 Suitable Timeframes - M1-M15
Only highly liquid stocks
🍀 I wish all subscribers good luck in trading and steady profits!
📈 May your charts move in the right direction!
⚠️ Remember: Trading involves risk. Do not invest money you cannot afford to lose!

Medico Action Zone self adjust TF version 2to create buy sell signal with adjusted EMA and timeframe

Options Strategy V2.0📈 Options Strategy V2.0 – Intraday Reversal-Resilient Momentum System
Overview:
This strategy is designed specifically for intraday SPY, TSLA, MSFT, etc. options trading (0DTE or 1DTE), using high-probability signals derived from a confluence of technical indicators: EMA crossovers, RSI thresholds, ATR-based risk control, and volume spikes. The strategy aims to capture strong directional moves while avoiding overtrading, thanks to a built-in cooldown logic and optional time/session filters.
⚙️ Core Concept
The strategy executes trades only in the direction of the prevailing trend, determined by short- and long-term Exponential Moving Averages (EMA). Entry signals are generated when the Relative Strength Index (RSI) confirms momentum in the direction of the trend, and volume spikes suggest institutional activity.
To increase adaptability and user control, it includes a highly customizable parameter set for both long and short entries independently.
📌 Key Features
✅ Trend-Following Logic
Long entries are only allowed when EMA(short) > EMA(long)
Short entries are only allowed when EMA(short) < EMA(long)
✅ RSI Confirmation
Long: Requires RSI crossover above a configurable threshold
Short: Requires RSI crossunder below a configurable threshold
Optional rejection filters: Entry blocked above/below specific RSI extremes
✅ Volume Spike Filter
Confirms institutional participation by comparing current volume to an average multiplied by a user-defined factor.
✅ ATR-Based Risk Management
Both Stop Loss (SL) and Take Profit (TP) are dynamically calculated using ATR × a multiplier.
TP/SL ratio is fully configurable.
✅ Cooldown Control
After every trade, the system waits for a set number of bars before allowing new entries.
This prevents overtrading and increases signal quality.
Optionally, cooldown is ignored for reversal trades, ensuring the system can react immediately to a confirmed trend change.
✅ Candle Body Filter (Noise Control)
Avoids trades on candles with too small bodies relative to wicks (often noise or indecision candles).
✅ VWAP Confirmation (Optional)
Ensures price is trading above VWAP for long entries, or below for short entries.
✅ Time & Session Filters
Trades only during regular market hours (09:30–16:00 EST).
No-trade zone (e.g., 14:15–15:45 EST) to avoid low-liquidity traps or late-day whipsaws.
✅ End-of-Day Auto Close
All open positions are force-closed at 15:55 EST, protecting against overnight risk (especially relevant for 0DTE options).
📊 Visual Aids
EMA plots show trend direction
VWAP line provides real-time mean-reversion context
Stop Loss and Take Profit lines appear dynamically with each trade
Alerts notify of entry signals and exit triggers
🔧 Customization Panel
Nearly every element of the strategy can be tailored:
EMA lengths (short and long, for both sides)
RSI thresholds and length
ATR length, SL multiplier, and TP/SL ratio
Volume spike sensitivity
Minimum EMA distance filter
Candle body ratio filter
Session restrictions
Cooldown logic (duration + reversal exception)
This makes the strategy extremely versatile, allowing both conservative and aggressive configurations depending on the trader’s profile and the market context.
📌 Example Use Case: SPY Options (0DTE or 1DTE)
This system was designed and tested specifically for SPY and other intraday options trading, where:
Delta is around 0.50 or higher
Trades are short-lived (often 1–5 candles)
You aim to trade 1–3 signals per day, filtering out weak entries
🚫 Important Notes
It is not a scalping strategy; it relies on confirmed breakouts with trend support
No pyramiding or re-entries without cooldown to preserve risk integrity
Should be used with real-time alerts and manual broker execution
📈 Alerts Included
📈 Long Entry Signal
📉 Short Entry Signal
⚠️ Auto-closed all positions at 15:55 EST
✅ Proven Settings – Real Trades + Backtest Results
The current version of the strategy includes the optimal settings I’ve arrived at through extensive backtesting, as well as 3 months of real trading with consistent profitability. These results reflect real-world execution under live market conditions using 0DTE SPY options, with disciplined trade management and risk control.
🧠 Final Thoughts
Options Strategy V2.0 is a robust, highly tunable intraday strategy that blends momentum, trend-following, and volume confirmation. It is ideal for disciplined traders focused on SPY or other 0DTE/1DTE options, and it includes guardrails to reduce false signals and improve execution timing.
Perfect for those who seek precision, flexibility, and risk-defined setups—not blind automation.

SOXL Trend Surge v3.0.2 – Profit-Only RunnerSOXL Trend Surge v3.0.2 – Profit-Only Runner
This is a trend-following strategy built for leveraged ETFs like SOXL, designed to ride high-momentum waves with minimal interference. Unlike most short-term scalping scripts, this model allows trades to develop over multiple days to even several months, capitalizing on the full power of extended directional moves — all without using a stop-loss.
🔍 How It Works
Entry Logic:
Price is above the 200 EMA (long-term trend confirmation)
Supertrend is bullish (momentum confirmation)
ATR is rising (volatility expansion)
Volume is above its 20-bar average (liquidity filter)
Price is outside a small buffer zone from the 200 EMA (to avoid whipsaws)
Trades are restricted to market hours only (9 AM to 2 PM EST)
Cooldown of 15 bars after each exit to prevent overtrading
Exit Strategy:
Takes partial profit at +2× ATR if held for at least 2 bars
Rides the remaining position with a trailing stop at 1.5× ATR
No hard stop-loss — giving space for volatile pullbacks
⚙️ Strategy Settings
Initial Capital: $500
Risk per Trade: 100% of equity (fully allocated per entry)
Commission: 0.1%
Slippage: 1 tick
Recalculate after order is filled
Fill orders on bar close
Timeframe Optimized For: 45-minute chart
These parameters simulate an aggressive, high-volatility trading model meant for forward-testing compounding potential under realistic trading costs.
✅ What Makes This Unique
No stop-loss = fewer premature exits
Partial profit-taking helps lock in early wins
Trailing logic gives room to ride large multi-week moves
Uses strict filters (volume, ATR, EMA bias) to enter only during high-probability windows
Ideal for leveraged ETF swing or position traders looking to hold longer than the typical intraday or 2–3 day strategies
⚠️ Important Note
This is a high-risk, high-reward strategy meant for educational and testing purposes. Without a stop-loss, trades can experience deep drawdowns that may take weeks or even months to recover. Always test thoroughly and adjust position sizing to suit your risk tolerance. Past results do not guarantee future returns. Backtest range: May 8, 2020 – May 23, 2025

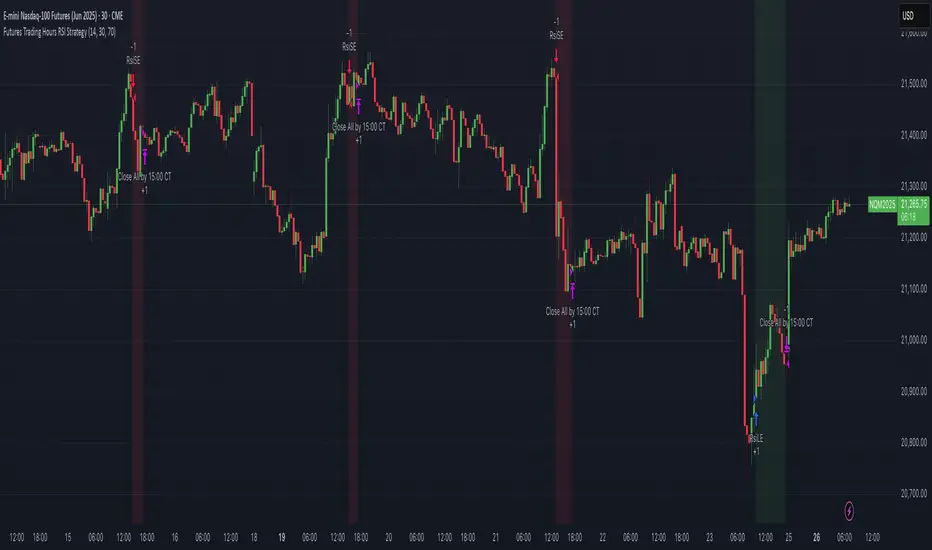
Futures Trading Hours RSI StrategyFutures Trading Hours RSI Strategy
A lightweight, session-filtered RSI strategy designed for equity-index futures (e.g. NQ, ES, YM) on a 30-minute chart. It dynamically enters long when RSI crosses above your oversold threshold and short when RSI crosses below your overbought threshold—but only during regular U.S. trading hours (08:30–15:00 CT, Monday–Friday). All positions are set to close at 15:00 CT to avoid overnight risk, and optional background shading highlights your open longs (green) and shorts (red).
⸻
Key Features
• RSI-based entries: configurable length, oversold, and overbought levels
• Session filter: trades only between 08:30–15:00 CT, Monday through Friday
• Automatic exit: closes all positions at or after 15:00 CT each day
• Visual cues: optional background shading for open long/short positions
• Easy customization: adjust length, overSold, overBought, and time offsets
Backtest Performance (NQ Jun 2025, 30 min)
• Total P&L: +$10,230 (+1.02%)
• Profit Factor: 4.61
• Win Rate: 57.1% (4 wins / 7 trades)
• Max Drawdown: $2,215 (0.22%)
(Results shown are for illustrative purposes only; past performance does not guarantee future returns.)
How to Use
1. Add this script to your 30-minute futures chart.
2. Tweak the RSI parameters and time-zone offset to suit your instrument.
3. Enable “background shading” if you’d like a visual reminder of open positions.
4. Run in paper-trade mode to validate performance before going live.
⸻
⚠️ Disclaimer: Trading carries risk. Always backtest and paper-trade before using real capital. Adjust position sizing and risk controls to your own tolerance.
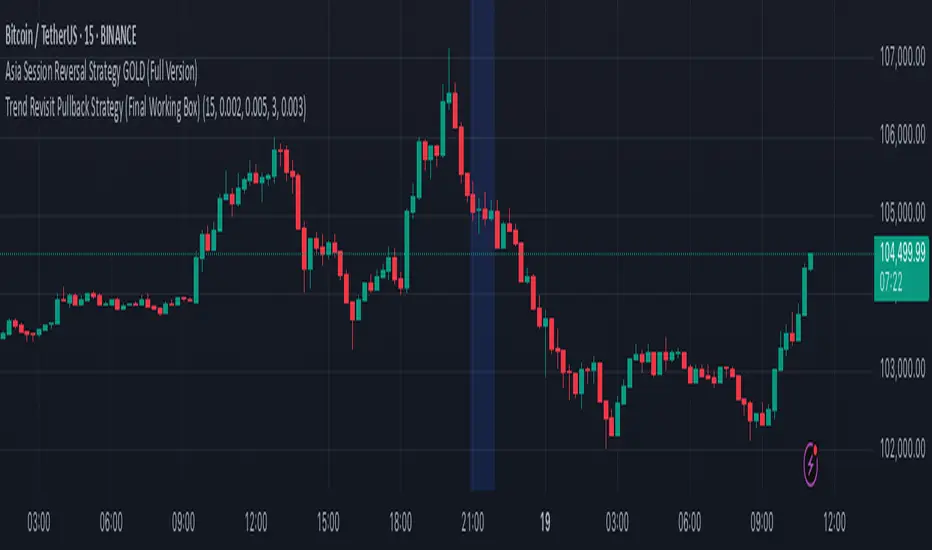
Trend Revisit Pullback Strategy (Final Working Box)📈 Trend Revisit Pullback Strategy
This TradingView Pine Script strategy identifies strong trend breakouts and accounts for natural pullbacks by:
Entering long or short on strong 1-bar breakouts
Allowing for pullback averaging if price retraces after entry
Expecting a revisit to the original entry price within 15 bars
Automatically exiting at break-even or using a custom TP/SL
Drawing a visual trade zone (entry → SL → revisit window) for easy reference
Optional labels and color-coded boxes to track each trade’s lifecycle
Ideal for trend traders who anticipate a pullback and prefer to manage risk with break-even exits or reward-to-risk parameters.
External Signals Strategy Tester v5External Signals Strategy Tester v5 – User Guide (English)
1. Purpose
This Pine Script strategy is a universal back‑tester that lets you plug in any external buy/sell series (for example, another indicator, webhook feed, or higher‑time‑frame condition) and evaluate a rich set of money‑management rules around it – with a single click on/off workflow for every module.
2. Core Workflow
Feed signals
Buy Signal / Sell Signal inputs accept any series (price, boolean, output of request.security(), etc.).
A crossover above 0 is treated as “signal fired”.
Date filter
Start Date / End Date restricts the test window so you can exclude unwanted history.
Trade engine
Optional Long / Short enable toggles.
Choose whether opposite signals simply close the trade or reverse it (flip direction in one transaction).
Risk modules – all opt‑in via check‑boxes
Classic % block – fixed % Take‑Profit / Stop‑Loss / Break‑Even.
Fibonacci Bollinger Bands (FBB) module
Draws dynamic VWMA/HMA/SMA/EMA/DEMA/TEMA mid‑line with ATR‑scaled Fibonacci envelopes.
Every line can be used for stops, trailing, or multi‑target exits.
Separate LONG and SHORT sub‑modules
Each has its own SL plus three Take‑Profits (TP1‑TP3).
Per TP you set line, position‑percentage to close, and an optional trailing flag.
Executed TP/SLs deactivate themselves so they cannot refire.
Trailing behaviour
If Trail is checked, the selected line is re‑evaluated once per bar; the order is amended via strategy.exit().
3. Inputs Overview
Group Parameter Notes
Trade Settings Enable Long / Enable Short Master switches
Close on Opposite / Reverse Position How to react to a counter‑signal
Risk % Use TP / SL / BE + their % Traditional fixed‑distance management
Fibo Bands FIBO LEVELS ENABLE + visual style/length Turn indicator overlay on/off
FBB LONG SL / TP1‑TP3 Enable, Line, %, Trail Rules applied only while a long is open
FBB SHORT SL / TP1‑TP3 Enable, Line, %, Trail Rules applied only while a short is open
Line choices: Basis, 0.236, 0.382, 0.5, 0.618, 0.764, 1.0 – long rules use lower bands, short rules use upper bands automatically.
4. Algorithm Details
Position open
On the very first bar after entry, the script checks the direction and activates the corresponding LONG or SHORT module, deactivating the other.
Order management loop (every bar)
FBB Stop‑Loss: placed/updated at chosen band; if trailing, follows the new value.
TP1‑TP3: each active target updates its limit price to the selected band (or holds static if trailing is off).
The classic % block runs in parallel; its exits have priority because they call strategy.close_all().
Exit handling
When any strategy.exit() fires, the script reads exit_id and flips the *_Active flag so that order will not be recreated.
A Stop‑Loss (SL) also disables all remaining TPs for that leg.
5. Typical Use Cases
Scenario Suggested Setup
Scalping longs into VWAP‐reversion Enable LONG TP1 @ 0.382 (30 %), TP2 @ 0.618 (40 %), SL @ 0.236 + trailing
Fade shorts during news spikes Enable SHORT SL @ 1.0 (no trail) and SHORT TP1,2,3 on consecutive lowers with small size‑outs
Classic trend‑follow Use only classic % TP/SL block and disable FBB modules
6. Hints & Tips
Signal quality matters – this script manages exits, it does not generate entries.
Keep TV time zone in mind when picking start/end dates.
For portfolio‑style testing allocate smaller default_qty_value than 100 % or use strategy.percent_of_equity sizing.
You can combine FBB exits with fixed‑% ones for layered management.
7. Limitations / Safety
No pyramiding; the script holds max one position at a time.
All calculations are bar‑close; intra‑bar touches may differ from real‑time execution.
The indicator overlay is optional, so you can run visual‑clean tests by unchecking FIBO LEVELS ENABLE.

Rawstocks 15 Minute ModelRawstocks 15-Minute Model
The Rawstocks 15-Minute Model is a precision intraday trading strategy designed for the US stock market (9:30 AM - 4:00 PM ET), optimized for the 15-minute timeframe. It combines institutional order flow concepts with Fibonacci retracements to identify high-probability reversal setups while enforcing strict risk management and session-based rules.
Key Features
Time-Based Execution
Trading Hours: 9:30 AM - 4:00 PM ET (no new entries after 4:00 PM)
Force Close: All positions auto-exit at 4:30 PM ET (prevents overnight risk)
Entry Logic
Order Block + Fib Confluence:
Identifies institutional order blocks (previous swing highs/lows)
Requires price pullback to 61.8% or 79% Fibonacci level
Liquidity Confirmation:
Waits for stop runs (liquidity sweeps) before reversal entries
Exit Rules
Stop Loss: 1x ATR (14) from entry
Take Profit: 2:1 Risk-Reward (adjustable)
Visual Signals
Green Triangle: Valid long setup (pullback to bullish OB + Fib)
Red Triangle: Valid short setup (pullback to bearish OB + Fib)
Blue/Purple Background: Highlights active trading vs. close period
How It Works
Identify the Setup
Wait for a strong impulse move (break of structure)
Mark the order block (institutional zone)
Confirm Pullback
Price must retrace to 61.8% or 79% Fib level
Must occur within trading hours (9:30 AM - 4:00 PM)
Enter on Confirmation
Long: Break of pullback candle high (stop below recent swing low)
Short: Break of pullback candle low (stop above recent swing high)
Manage the Trade
Trail stop or exit at 2R (risk-to-reward)
All positions close at 4:30 PM sharp

Advanced Multi-Timeframe Trading System (Risk Managed)Description:
This strategy is an original approach that combines two main analytical components to identify potential trade opportunities while simulating realistic trading conditions:
1. Market Trend Analysis via an Approximate Hurst Exponent
• What It Does:
The strategy computes a rough measure of market trending using an approximate Hurst exponent. A value above 0.5 suggests persistent, trending behavior, while a value below 0.5 indicates a tendency toward mean-reversion.
• How It’s Used:
The Hurst exponent is calculated on both the chart’s current timeframe and a higher timeframe (default: Daily) to capture both local and broader market dynamics.
2. Fibonacci Retracement Levels
• What It Does:
Using daily high and low data from a selected timeframe (default: Daily), the script computes key Fibonacci retracement levels.
• How It’s Used:
• The 61.8% level (Golden Ratio) serves as a key threshold:
• A long entry is signaled when the price crosses above this level if the daily Hurst exponent confirms a trending market.
• The 38.2% level is used to identify short-entry opportunities when the price crosses below it and the daily Hurst indicates non-trending conditions.
Signal Logic:
• Long Entry:
When the price crosses above the 61.8% Fibonacci level (Golden Ratio) and the daily Hurst exponent is greater than 0.5, suggesting a trending market.
• Short Entry:
When the price crosses below the 38.2% Fibonacci level and the daily Hurst exponent is less than 0.5, indicating a less trending or potentially reversing market.
Risk Management & Trade Execution:
• Stop-Loss:
Each trade is risk-managed with a stop-loss set at 2% below (for longs) or above (for shorts) the entry price. This ensures that no single trade risks more than a small, sustainable portion of the account.
• Take Profit:
A take profit order targets a risk-reward ratio of 1:2 (i.e., the target profit is twice the amount risked).
• Position Sizing:
Trades are executed with a fixed position size equal to 10% of account equity.
• Trade Frequency Limits:
• Daily Limit: A maximum of 5 trades per day
• Overall Limit: No more than 510 trades during the backtesting period (e.g., since 2019)
These limits are imposed to simulate realistic trading frequency and to avoid overtrading in backtest results.
Backtesting Parameters:
• Initial Capital: $10,000
• Commission: 0.1% per trade
• Slippage: 1 tick per bar
These settings aim to reflect the conditions faced by the average trader and help ensure that the backtesting results are realistic and not misleading.
Chart Overlays & Visual Aids:
• Fibonacci Levels:
The key Fibonacci retracement levels are plotted on the chart, and the zone between the 61.8% and 38.2% levels is highlighted to show a key retracement area.
• Market Trend Background:
The chart background is tinted green when the daily Hurst exponent indicates a trending market (value > 0.5) and red otherwise.
• Information Table:
An on-chart table displays key parameters such as the current Hurst exponent, daily Hurst value, the number of trades executed today, and the global trade count.
Disclaimer:
Past performance is not indicative of future results. This strategy is experimental and provided solely for educational purposes. It is essential that you backtest and paper trade using your own settings before considering any live deployment. The Hurst exponent calculation is an approximation and should be interpreted as a rough gauge of market behavior. Adjust the parameters and risk management settings according to your personal risk tolerance and market conditions.
Additional Notes:
• Originality & Usefulness:
This script is an original mashup that combines trend analysis with Fibonacci retracement methods. The description above explains how these components work together to provide trading signals.
• Realistic Results:
The strategy uses realistic account sizes, commission rates, slippage, and risk management rules to generate backtesting results that are representative of real-world trading.
• Educational Purpose:
This script is intended to support the TradingView community by offering insights into combining multiple analysis techniques in one strategy. It is not a “get-rich-quick” system but rather an educational tool to help traders understand risk management and trade signal logic.
By using this script, you acknowledge that trading involves risk and that you are responsible for testing and adjusting the strategy to fit your own trading environment. This publication is fully open source, and any modifications should include proper attribution if significant portions of the code are reused.

Negroni Opening Range StrategyStrategy Summary:
This tool can be used to help identify breakouts from a range during a time-zone of your choosing. It plots a pre-market range, an opening range, it also includes moving average levels that can be used as confluence, as well as plotting previous day SESSION highs and lows.
There are several options on how you wish to close out the trades, all described in more detail below.
Back-testing Inputs:
You define your timezone.
You define how many trades to open on any given day.
You decide to go: long only, short only, or long & short (CAREFUL: "Long & Short" can open trades that effectively closes-out existing ones, for better AND worse!)
You define between which times the strategy will open trades.
You define when it closes any open trades (preventing overnight trades, or leaving trades open into US data times!!).
This hopefully helps make back-testing reflect YOUR trading hours.
NOTE: Renko or Heikin-Ashi charts
For ALL strategies, don’t use Renko or Heikin-Ashi charts unless you know EXACTLY the implications.
Specific to my strategy, using a renko chart can make this 85-90% profitable (I wish it was!!) Although they can be useful, renko charts don’t always capture real wicks, so the renko chart may show your trade up-only but your broker (who is not using renko!!) will have likely stopped you out on a wick somewhere along the line.
NOTE: TradingView ‘Deep backtesting’
For ALL strategies, be cynical of all backtesting (e.g. repainting issues etc) as well as ‘Deep backtesting’ results.
Specific to this strategy, the default settings here SHOULD BE OK, but unfortunately at the time of writing, we can’t see on the chart what exactly ‘deep backtesting’ is calculating. In the past I have noted a number of trades that were not closed at the end of the day, despite my ‘end of day’ trade closing being enabled, so there were big winners and losers that would not have materialized otherwise. As I say, this seems ok at these settings but just always be cynical!!
Opening Range Inputs
You define a pre-market range (example: 08:00 - 09:00).
You define an opening range (example: 09:00 - 09:30).
The strategy will give an update at the close of the opening range to let you know if the opening range has broken out the pre-market range (OR Breakout), or if it has remained inside (OR Inside). The label appears at the end of the opening range NOT at the bar that ‘broke-out’.
This is just a visual cue for you, it has no bearing on what the strategy will do.
The strategy default will trade off the pre-market range, but you can untick this if you prefer to trade off the opening range.
Opening Trades:
Strategy goes long when the bar (CLOSE) crosses-over the ‘pre-market’ high (not the ‘opening range’ high); and the time is within your trading session, and you have not maxed out your number of trades for the day!
Strategy goes short when the bar (CLOSE) crosses-under the ‘pre-market’ low (not the ‘opening range low); and the time is within your trading session, and you have not maxed out your number of trades for the day!
Remember, you can untick this if you prefer to trade off the opening range instead.
NOTES:
Using momentum indicators can help (RSI and MACD): especially to trade range plays in failed breakouts, when momentum shifts… but the strategy won’t do this for you!
Using an anchored vwap at the session open can also provide nice confluence, as well as take-profit levels at the upper/lower of 3x standard deviation.
CLOSING TRADES:
You have 6 take-profit (TP) options:
1) Full TP: uses ATR Multiplier - Full TP at the ATR parameters as defined in inputs.
2) Take Partial profits: ATR Multiplier - Takes partial profits based on parameters as defined in inputs (i.e close 40% of original trade at TP1, close another 40% of original trade at TP2, then the remainder at Full TP as set in option 1.).
3) Full TP: Trailing Stop - Applies a Trailing Stop at the number of points, as defined in inputs.
4) Full TP: MA cross - Takes profit when price crosses ‘Trend MA’ as defined in inputs.
5) Scalp: Points - closes at a set number of points, as defined in inputs.
6) Full TP: PMKT Multiplier - places a SL at opposite pre-market Hi/Low (we go long at a break-out of the pre-market high, 50% would place a SL at the pre-market range mid-point; 100% would place a SL at the pre-market low)'. This takes profit at the input set in option 1).

SILVER Midnight Candle Color Strategy 1-Hour Delay and SL/TP Overview:
The "Midnight Candle Color Strategy with 1-Hour Delay and SL/TP" is a unique trading strategy designed for the Forex market. This strategy capitalizes on the color of the midnight candle based on New York time, making trade decisions one hour later, at 1:00 AM.
Key Features:
Time Zone Adjustment: Automatically adjusts to New York time (UTC-5 or UTC-4 during Daylight Saving Time).
Midnight Candle Analysis: Utilizes the color of the midnight candle to gauge market sentiment.
Trade Execution at 1 AM: Trades are executed one hour after midnight based on the previous day's candle color.
Strategic SL/TP: Incorporates predefined stop loss (SL) and take profit (TP) levels for each trade.
How It Works:
The script first determines whether the current bar represents 12:00 AM or 1:00 AM in New York time.
At midnight, it records the color of the candle (green for bullish, red for bearish).
At 1:00 AM, the strategy:
Enters a long position if the midnight candle was green, with specific TP and SL settings.
Enters a short position if the midnight candle was red, again with defined TP and SL.
Visualization:
Optional markers are plotted on the chart for easy visualization of the strategy's entry points at midnight and 1 AM.
Usage Tips:
Ideal for traders focusing on overnight price movements and early morning trends.
Best suited for SILVER trading due to the 24-hour trading cycle.
We recommend backtesting the strategy with historical data to evaluate performance.
Disclaimer:
This strategy is provided for educational purposes and should not be considered as financial advice. Users should conduct their own research and exercise caution while trading. Past performance is not indicative of future results.
I´m not a signal service, however I´m sharing my signals. For free. If you wish to buy something, contact some other signalist, preferably with 5-10-15-20K followers, selling signals on the premium channel, but in reality not trading them themselves. If you will realise after few blown account that something is wrong, ask yourself why is that. Trading is not pushing the buy-sell button and drinking tequila on the beach. If you want to learn, you know what to do.

London BreakOut ClassicHey there, this is my first time publishing a strategy. The strategy is based on the London Breakout Idea, an incredibly popular concept with abundant information available online.
Let me summarize the London Breakout Strategy in a nutshell: It involves identifying key price levels based on the Tokyo Session before the London Session starts. Typically, these key levels are the high and low of the previous Tokyo session. If a breakout occurs during the London session, you simply follow the trend.
The purpose of this code
After conducting my research, I came across numerous posts, videos, and articles discussing the London Breakout Strategy. I aimed to automatically test it myself to verify whether the claims made by these so-called trading gurus are accurate or not. Consequently, I wrote this script to gain an understanding of how this strategy would perform if I were to follow its basic settings blindly.
Explanation of drawings on the chart:
Red or Green Box: A box is drawn on our chart displaying the exact range of the Tokyo trading session. This box is colored red if the trend during the session was downward and green if it was upward. The box is always drawn between the high and the low between 0:00 AM and 7:00 AM UTC. You can change the settings via the Inputs "Session time Tokyo" & "Session time zone".
Green Background: The green background represents the London trading session. My code allows us to make entries only during this time. If we haven't entered a trade, any pending orders are canceled. I've also programmed a timeout at 11 pm to ensure every trade is closed before the new Tokyo session begins.
Red Line: The red line is automatically placed in the middle of our previous Tokyo range. This line acts as our stop loss. If we cross this line after entering a trade but before reaching our take profit, we'll be stopped out.
When do we enter a trade?
We wait for a candle body to close outside of the previous Tokyo range to enter a trade with the opening of the next candle. We only enter one trade per day.
Where do we put our Take Profit?
The code calculates the exact distance between our entry point and the stop loss. We are trading a risk-reward ratio of 1:1 by default, meaning our take profit is always the same number of pips away from our entry as the stop loss. The Stop Loss is always defined by the red line on the chart. You can change the risk-reward ratio via the inputs setting "CRV", to see how the result changes.
What is the purpose of this script?
I wanted to backtest the London breakout strategy to see how it actually works. Therefore, I wrote this code so that everybody can test it for themselves. You can change the settings and see how the result changes. Typically, you should test this strategy on forex markets and on either 1Min, 5 Min, or 15 Min timeframe.
What are the results?
Over the last 3-6 months (over 100 trades), trading the strategy with my default settings hasn't proven to be very successful. Consequently, I do not recommend trading this strategy blindly. The purpose of this code is to provide you with a foundation for the London Breakout Strategy, allowing you to modify and enhance it according to your preferences. If you're contemplating whether to give it a try, you can assess the results from the past months by using this code as a starting point.

X48 - Strategy | BreakOut & Consecutive (11in1) + Alert | V.1.2================== Read This First Before Use This Strategy ==============
*********** Please be aware that this strategy is not a guarantee of success and may lead to losses.
*********** Trading involves risk and you should always do your own research before making any decisions.
================= Thanks Source Script and Explain This Strategy ===================
► Description
Write a detailed and meaningful description that allows users to understand how your script is original, what it does, how it does it and how to use it
This Strategy Are Combine Strategy and Indicators Alert Function For Systematic Trading User.
Strategy List, Thanks For Original Source Script , From Tradingview Build-in Script From fmzquant Github
// Channel BreakOut Strategy : Calculate BreakOut Zone For Buy and Sell.
// Consecutive Bars UP/Down Strategy : The consecutive bars up/down strategy is a trading strategy used to identify potential buy and sell signals in the stock market. This strategy involves looking for a series of bars (or candles) that are either all increasing or all decreasing in price. If the bars are all increasing, it can be a signal to buy, and if the bars are all decreasing, it can be a signal to sell. This strategy can be used on any timeframe, from a daily chart to an intraday chart.
// 15m Range Length SD : Range Of High and Low Candle Price and Lookback For Calculate Buy and Sell.
Indicators Are Simple Source Script (Almost I'm Chating With CHAT-GPT and Convert pinescript V4 to V5 again for complete almost script and combine after)
// SwingHigh and SwingLow Plot For SL (StopLoss by Last Swing).
// Engulfing and 3 Candle Engulfing Plot.
// Stochastic RSI for Plot and Fill Background Paint and Plot TEXT For BULL and BEAR TREND.
// MA TYPE MODE are plot 2 line of MA Type (EMA, SMA, HMA, WMA, VWMA) for Crossover and Crossunder.
// Donchian Fans MODE are Plot Dot Line With Triangle Degree Bull Trend is Green Plot and Bear Trend is Red Plot.
// Ichimoku Cloud Are Plot Cloud A-B For Bull and Bear Trend.
// RSI OB and OS for TEXT PLOT 'OB' , 'OS' you will know after OB and OS, you can combo with other indicators that's make you know what's the similar trend look like?
// MACD for Plot Diamond when MACD > 0 and MACD < 0, you can combo with other indicators that's make you know what's the similar trend look like?
Alert Can Alert Sent When Buy and Sell or TP and SL, you can adjust text to alert sent by your self or use default setting.
========== Let'e Me Explain How To Use This Strategy =============
========== Properties Setting ==========
// Capital : Default : 1,000 USDT For Alot Of People Are Beginner Investor = It's Capital Your Cash For Investment
// Ordersize : Default Are Setting 5% / Order We Call Compounded
========== INPUT Setting ==========
// First Part Use Must Choose Checkbox For Use of Strategy and Choose TP/SL by Swing or % (can choose both)
// In Detail Of Setting Are Not Too Much, Please Read The Header Of Setting Before Change The Value
// For The Indicator In List You Want To Add Just Check ✅ From MODE Setting, It's Show On Your Chart
// You Can Custom TP/SL % You Want
========== ##### No trading strategy is guaranteed to be 100% successful. ###### =========
For Example In My Systematic Trading
Select 1/3 Strategy Setting TP/SL % Match With Timeframe TP Long Are Not Set It's Can 161.8 - 423.6% but Short Position Are Not Than 100% Just Fine From Your Aset
Choose Indicators For Make Sure Trend and Strategy are the same way like Strategy are Long Position but MACD and Sto background is bear. that's mean this time not open position.
Donchian Fans is Simple Support and Ressistant If You Don't Know How To Plot That's, This indicator plot a simple for you ><.
Make Sure With Engulfing and 3 Candle Engulfing If You Don't Know, What's The Engulfing, This Indicator are plot for you too ><.
For a Big Trend You can use Ichimoku Cloud For Check Trend, Candle Upper Than Cloud or Lower Than Cloud for Bull and Bear Trend.

Investments/swing trading strategy for different assetsStop worrying about catching the lowest price, it's almost impossible!: with this trend-following strategy and protection from bearish phases, you will know how to enter the market properly to obtain benefits in the long term.
Backtesting context: 1899-11-01 to 2023-02-16 of SPX by Tvc. Commissions: 0.05% for each entry, 0.05% for each exit. Risk per trade: 2.5% of the total account
For this strategy, 5 indicators are used:
One Ema of 200 periods
Atr Stop loss indicator from Gatherio
Squeeze momentum indicator from LazyBear
Moving average convergence/divergence or Macd
Relative strength index or Rsi
Trade conditions:
There are three type of entries, one of them depends if we want to trade against a bearish trend or not.
---If we keep Against trend option deactivated, the rules for two type of entries are:---
First type of entry:
With the next rules, we will be able to entry in a pull back situation:
Squeeze momentum is under 0 line (red)
Close is above 200 Ema and close is higher than the past close
Histogram from macd is under 0 line and is higher than the past one
Once these rules are met, we enter into a buy position. Stop loss will be determined by atr stop loss (white point) and break even(blue point) by a risk/reward ratio of 1:1.
For closing this position: Squeeze momentum crosses over 0 and, until squeeze momentum crosses under 0, we close the position. Otherwise, we would have closed the position due to break even or stop loss.
Second type of entry:
With the next rules, we will not lose a possible bullish movement:
Close is above 200 Ema
Squeeze momentum crosses under 0 line
Once these rules are met, we enter into a buy position. Stop loss will be determined by atr stop loss (white point) and break even(blue point) by a risk/reward ratio of 1:1.
Like in the past type of entry, for closing this position: Squeeze momentum crosses over 0 and, until squeeze momentum crosses under 0, we close the position. Otherwise, we would have closed the position due to break even or stop loss.
---If we keep Against trend option activated, the rules are the same as the ones above, but with one more type of entry. This is more useful in weekly timeframes, but could also be used in daily time frame:---
Third type of entry:
Close is under 200 Ema
Squeeze momentum crosses under 0 line
Once these rules are met, we enter into a buy position. Stop loss will be determined by atr stop loss (white point) and break even(blue point) by a risk/reward ratio of 1:1.
Like in the past type of entries, for closing this position: Squeeze momentum crosses over 0 and, until squeeze momentum crosses under 0, we close the position. Otherwise, we would have closed the position due to break even or stop loss.
Risk management
For calculating the amount of the position you will use just a small percent of your initial capital for the strategy and you will use the atr stop loss for this.
Example: You have 1000 usd and you just want to risk 2,5% of your account, there is a buy signal at price of 4,000 usd. The stop loss price from atr stop loss is 3,900. You calculate the distance in percent between 4,000 and 3,900. In this case, that distance would be of 2.50%. Then, you calculate your position by this way: (initial or current capital * risk per trade of your account) / (stop loss distance).
Using these values on the formula: (1000*2,5%)/(2,5%) = 1000usd. It means, you have to use 1000 usd for risking 2.5% of your account.
We will use this risk management for applying compound interest.
In settings, with position amount calculator, you can enter the amount in usd of your account and the amount in percentage for risking per trade of the account. You will see this value in green color in the upper left corner that shows the amount in usd to use for risking the specific percentage of your account.
Script functions
Inside of settings, you will find some utilities for display atr stop loss, break evens, positions, signals, indicators, etc.
You will find the settings for risk management at the end of the script if you want to change something. But rebember, do not change values from indicators, the idea is to not over optimize the strategy.
If you want to change the initial capital for backtest the strategy, go to properties, and also enter the commisions of your exchange and slippage for more realistic results.
If you activate break even using rsi, when rsi crosses under overbought zone break even will be activated. This can work in some assets.
---Important: In risk managment you can find an option called "Use leverage ?", activate this if you want to backtest using leverage, which means that in case of not having enough money for risking the % determined by you of your account using your initial capital, you will use leverage for using the enough amount for risking that % of your acount in a buy position. Otherwise, the amount will be limited by your initial/current capital---
Some things to consider
USE UNDER YOUR OWN RISK. PAST RESULTS DO NOT REPRESENT THE FUTURE.
DEPENDING OF % ACCOUNT RISK PER TRADE, YOU COULD REQUIRE LEVERAGE FOR OPEN SOME POSITIONS, SO PLEASE, BE CAREFULL AND USE CORRECTLY THE RISK MANAGEMENT
Do not forget to change commissions and other parameters related with back testing results!
Some assets and timeframes where the strategy has also worked:
BTCUSD : 4H, 1D, W
SPX (US500) : 4H, 1D, W
GOLD : 1D, W
SILVER : 1D, W
ETHUSD : 4H, 1D
DXY : 1D
AAPL : 4H, 1D, W
AMZN : 4H, 1D, W
META : 4H, 1D, W
(and others stocks)
BANKNIFTY : 4H, 1D, W
DAX : 1D, W
RUT : 1D, W
HSI : 1D, W
NI225 : 1D, W
USDCOP : 1D, W

SeongMo_MA_V3(Elliot_helper)Made to make it easier to count Elliott waves.
If you renew your new high price, you'll continue your new high price
When the new low is renewed, the new low is continued.
If you are within the range of the previous candle, use the ratio of the difference between the median value of the previous candle and the closing price of the current candle to determine whether to continue the high or low price.
If a can with a tail that updates a new high price and a new low price at the same time comes out, the phrase "Check_candle!" appears to mean that you should check it with a lower time zone candle.

3Commas Bot DCA Backtester & Signals FREEThis is a DCA Strategy backtester + signals, built to emulate the 3Commas DCA bots. It uses your choice of 4 different buy signals, 2 of which can be adjusted in the settings. Everything is customizable so you can backtest specific settings with different buy signals and find the best performing strategy for your risk tolerance and capital. It can be used to backtest strategies on stocks as well, but just make sure your base order is larger than the share price for the entire backtesting range or it will not calculate properly.
You can use this template to code your own buy signals and then backtest them as a DCA strategy if you know some basic pine script.
The indicator shows all of your backtesting orders on the chart. The red line is your take profit level, the blue line is your average price level, the white line is your first order and the green lines are your average down orders. If you enable a stop loss in the settings your stop loss will be shown as an orange line once all of your average down orders have been hit, it will not be set until price has dipped below your covered trading range.
These levels update when things change during backtesting so you can visualize your strategy and how it would perform as well as see if your percentage deviation is large enough to cover dips. When backtesting trades are taken, the chart will show where they were taken(in backtesting) along with info on those trades such as the number each order is, the size of that order and the percentage deviation that order is from the initial buy.
SENDING SIGNALS TO 3COMMAS
Tradingview cannot sync this backtester to 3Commas and with the way alerts are setup for strategies on Tradingview, the best option for you to give signals to your bot would be to use this backtester to figure out what trigger you want to use and then setup that indicator separately to send alerts to your bot. All of the indicators used for signals in this backtester are available for free and can be configured to match this backtester and send alerts to 3Commas for you. Just make sure you set your alerts to once per bar close and don’t use less than a 15 second timeframe because then you could trigger the Tradingview threshold for alerts and get your alerts shut off.
You can also use this backtester with your own buy triggers if you know a little pine script. Just make copy of the script and code in your own buy signals and see how it backtests.
INFO PANEL FOR ANALYZING YOUR STRATEGY
The right hand side of the screen will show an info panel that shows a lot of different information so you can quickly see your bot settings and how it performed right on the screen.
In the top right corner you will see in purple your bot settings. These include your stoploss % if turned on, take profit %, average down order %, average down order % multiplier, volume multiplier, max number of orders allowed and size of your base order.
The top section of the first column “Current Trade” shows these stats: the open trade’s average price, the open trade’s take profit price, the open trade’s PNL, how far price is from your open tarde’s take profit level in percentage, your open position size and number of open orders.
The bottom section of the first column “Overall Performance” shows these stats: total number of trades taken during backtesting range, the largest amount of trades that were open at one time during backtesting, the max drawdown, the average number of bars per trade, gross profit, net profit, percent profit from your initial capital, current portfolio value and your initial capital.
CUSTOMIZABLE OPTIONS TO FIND THE PERFECT STRATEGY
Stoploss On/Off
This will turn your stoploss on or off. By default it is set to off and will not affect anything unless turned on.
Stoploss Percentage
This is the percentage below your final average down order price that will be set as a stoploss to keep your account from going too far in the red on big dips.
Take Profit Percentage - This is the percentage of profit you want the trade to hit before taking profit on your entire DCA trade. This level updates everytime you average down.
Average Down Percentage - This is the percentage that price has to drop from your initial order to initiate your first safety order. If the Average Down Percent Multiplier is set to 1 then this percentage will be the same for every average down order.
Average Down Percentage Multiplier - This multiplies your Average Down Percentage so each safety order needs a larger percentage deviation than the previous one. This keeps your buys closer together at the beginning and further apart when you hit more orders so you can extend your trading range but still be aggressive when price is going sideways.
Volume Multiplier Per New Order - This multiplies the size of each trade based on your base order. If you set it to a 2x multiplier then each average down order will be 2 times the size of the last one. So for example, a $100 base order with a 2x multiplier would have these values for the first 3 average down orders: 200, 400, 800.
Size Of Base Order - This is the size of your first position entry and will be used as a starting point for the volume multiplier. If your base order is $100 then it will buy $100 worth of whatever crypto you are backtesting this on. If you are looking at stock charts, you need to make sure your base order is higher than the share price across the entire backtesting range or it will not perform correctly.
Max Number Of Orders - This is the maximum number of orders the bot can take, including your base order. Adjust this to suit the amount of capital you are willing to allocate to your bot based on how much money it will require to run according to your bot settings.
TIPS ON HOW TO USE FOR BEST RESULTS
If you don’t have a lot of capital to work with, then use longer timeframes with a reasonable take profit percentage so that you don’t need a lot of average down orders. You can also try keeping the volume multiplier close to 1.
You can use the 3Commas dca bot settings page to see how much capital you will need for your strategy if you match it to the settings you have on this indicator. You can also check to see how much of a percentage deviation your bot is covering to make sure you have a reasonable range to trade in and orders to cover big dips. You can also check your coverage by seeing how far down the chart the green lines cover, which are your average down orders.
Make sure the initial capital in the properties tab of the settings has enough to cover all of your orders otherwise you will get unrealistic backtesting results. Also, make sure you leave the order size in the properties tab on contracts so it calculates your trades correctly. The only settings you need to touch in the properties tab is the initial capital. Unless you are trading somewhere that has lower commission fees, then you can change that to match, but leave all the other settings as is for it to function properly.
Increasing the volume multiplier will make your average price and take profit target follow the price action a lot closer as price falls, but it can also lead to having very large orders very quickly once you get into the 1.5-3x multiple range. Try using a high volume multiplier with less safety orders and you will get better results, however you need to have money on the sidelines to add on major dips to keep your bot turning a profit. Be very careful with this as greed and impatience will hurt your overall performance. This bot is meant to make money with lots of small wins so don’t get greedy and make sure you have enough money to cover large dips. If you are being aggressive with your bot, then I recommend only using 25% or less of your portfolio to trade aggressively and then use the smart trade feature on 3commas to add chunks of funds to your trades when price dips below your last safety order. Or if you want it to run without any supervision, then use lower volume multipliers and have lots of safety orders that can cover entire bear markets and still keep buying lower.
It’s a good idea to have some capital on the sidelines that you can add in when price dips quickly. This will help lower your average price and allow your bot to get out in profit quicker. 3Commas bot has a smart trade feature that will allow you to track your average price when adding extra funds and it will automatically update your other orders which is very convenient. Look at the longer timeframes when price dips and only add chunks at major areas where price is very likely to bounce. Or you can be aggressive when trading and add to your position when price dips and is at a likely bounce zone to maximize profits.
Only trade coins that have a good amount of liquidity as the larger your orders get, the harder it will be to sell if there isn’t much liquidity. Also, beware of how large your first order is as it will usually be a market order and can move the market if there is not much liquidity.
Since this bot takes a lot of trades and performs best when taking small profits consistently, you will need to factor in exchange fees. The bot is set to .5% commission(you can change this) on the buy and sell orders as most exchanges charge that amount. Some exchanges offer no fee trading on certain coins so be sure to look around for those so you can keep the commissions and maximize profits.
I strongly encourage you to try out a lot of different setting combinations across multiple different coins and do it across a few months to see how it would have performed under various market conditions. This will help you get a better idea of how much of a percentage deviation you’ll need to be able to cover to keep your bot running and making constant profits. You can also use the deep backtesting feature of the strategy panel to see how it would have done, but just beware that the info panel of the indicator will not reflect deep backtesting results, only the normal backtesting range.
MARKETS
This backtester can be used on any market including crypto, stocks, forex & futures. You just need to make sure your base order is larger than the share price when using this on things besides crypto.
TIMEFRAMES
This backtester can be used on all timeframes.

