Market Waves Alpha All-In-One IndicatorMarket Waves Alpha Indicator is a part of the Market Waves All-In-One indicators. It provides indicators on top of the candles which give accurate information on where the market it heading. It is important to familiarize yourself with the different keys available in Market Waves Alpha Indicator . These indicators appear above each candle, but it is important to wait until the candle actually closes before reacting on them. To make things a little easier, we are going to look at each indicator on its own and compare it with market price to see how it performs.
Blood & Red Diamond
These are suppose to be showing you when there is bearish momentum in the trend. Blood & Red Diamonds mean strong bearish momentum.
Yellow Cross – Market Manipulation
This indicator can identify when there is market manipulation about to occur, so be careful with your trade! Let’s see it in action:
Red Cross – Bearish Indicator
The red cross above the candle shows that there is bearish signals showing, so be careful!
Green Dot
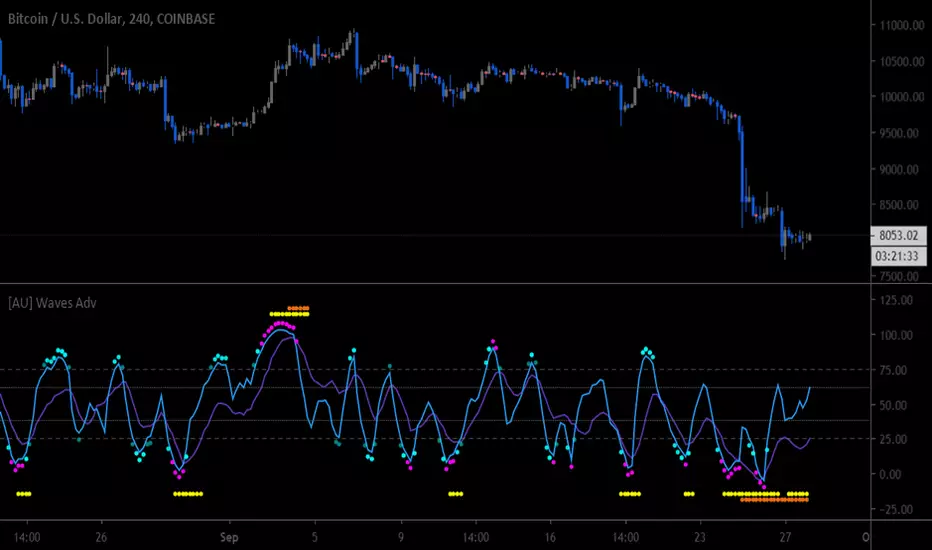
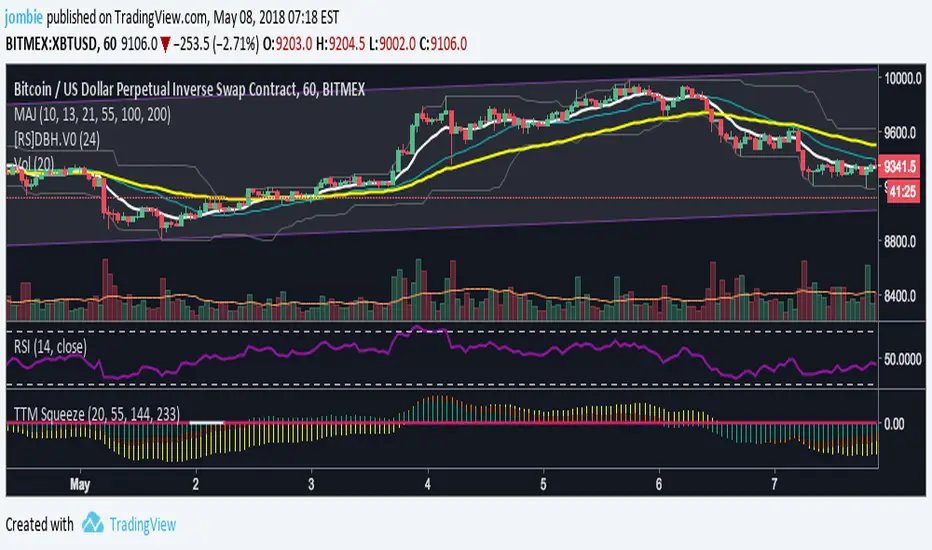
The green dot that appears above the candles on Market Waves Alpha Indicator is suppose to where there is bullish intent:
The image above shows 2 green dots that appeared on 1 hour time frame. Clearly, the green dot appear followed by a large spike in price.
Blue Triangle
The blue triangle on Market Waves Alpha Indicator lets you know when there is a trend change, so if price action currently looks bullish the triangle lets you know that we are now in a bearish zone. Let’s take a look at this indicator:
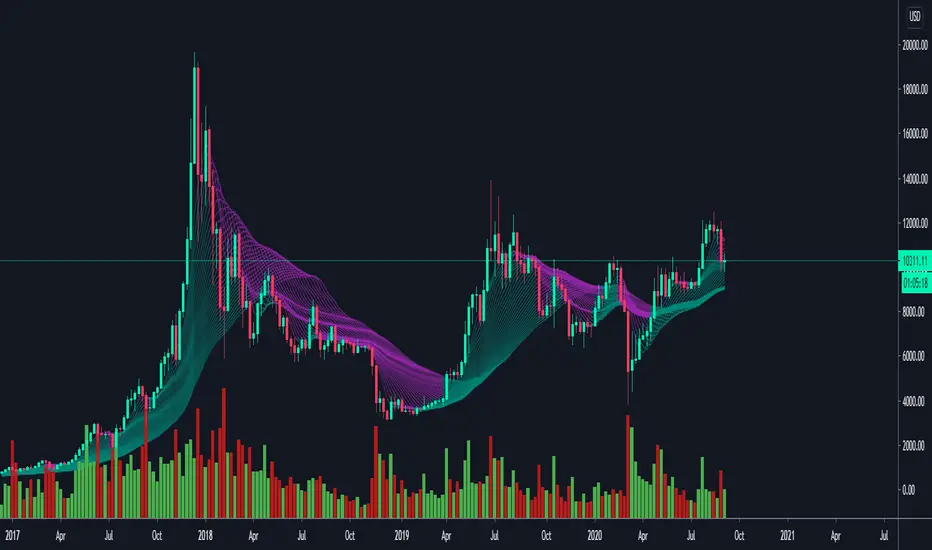
EMA Ribbon
EMA ribbon can be used to identify the trend. Price is above the EMA ribbon when the trend is bullish and below the EMA ribbon when the trend is bearish.
This indicator is recommended to be used with Market Waves Omega Indicator for additional confirmation:
Buscar en scripts para "wave"
M waves Mk3 'Magical M's v1
V2
V3
So I forgot this existed so here is the Opened sourced code (pm me for older sorce code there are 600+ Saves)(pm me for other scrips course code too lazy to republish everything)
Changes: Simplified and annotated code/upgraded to v4 format
as always adjust before using
i use this indicator combined with the other frequency one to help me identify time and direction of next move.
Pair with rsi
Pair with detrended tsi (have unpublished script might share later)
‘Redraw’ safe
Slightly detrented(adjustable) to avoid traps
quick how to use:
Meant as and adjustable indicator to “tune" to personal risk/reward preference
Green means buy red means sell
arrow indicators for long term sell and buy
Highly customizable (candles too)
Check out my profile for previous versions they are less customizable but also easier to get started with
similar to rsi you want to buy/sell when the indicator turns green/red and lines are as pinched as posible (the lines that are being filled).
keep an eye on the other line that moves around ;) if its not matching the other 2 moving averages and the main color indicator chances are its a trap(works both ways)
use the candles to help you keep your eye on the indicator when scalping (look at the original post for some color ideas)


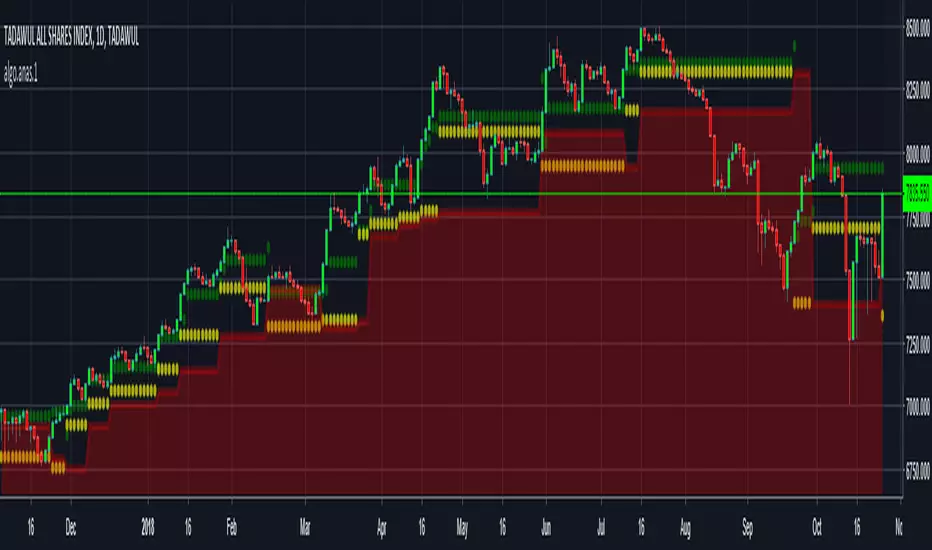
Price Action based indicator to visualize waves and trendsANAS indicator is a proprietary script that quickly analyze price action and plot 3 price levels around each bar. Namely, green level, yellow level, and red zone. You will easily be able to identify current trend, support/resistance levels, wave count, targets and stops by studying different patterns and scenarios evolving around each bar. When applying the indicator to the same symbol on two different time frames, you differently got an edge!
Nothing can explain things more than giving it a try.
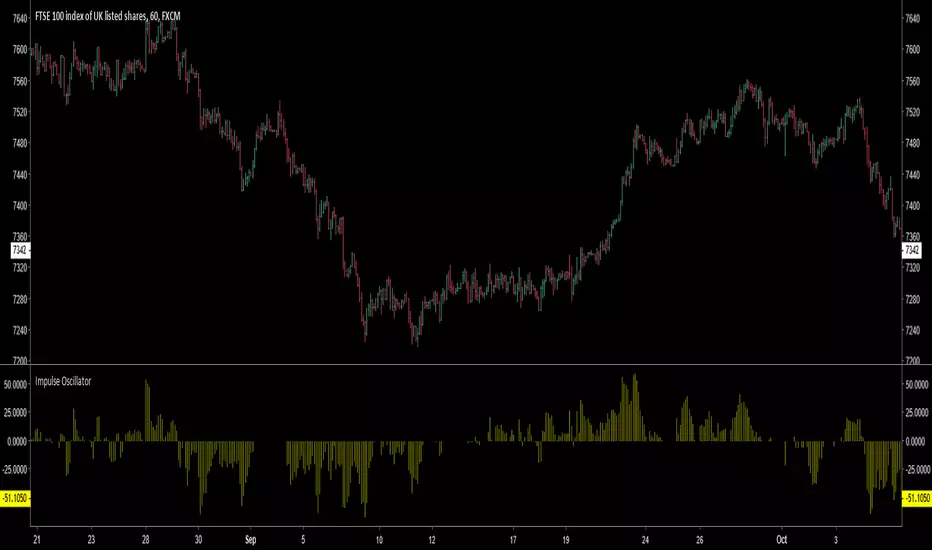
Impulse Oscillator without legs for Price Action & Elliott WavesHi Traders,
I have a newcomer for impulsetrading.
This indicator is an oscillator that show without legs impulses of Price Action .
For the expertise: you can use it for counting elliott waves !
Have fun and winning trades!
Kumo WavesKumo Waves is included in the Richimoku Traiding System.
Kumo Waves (Indentify divergences, trends, investor sentiment. Know First. Act Faster. A must-have for every trader!)
*As some indicators you may come across are using the repainting mode (which consists in correcting the false signal back in time).
You'll never see such thing in the Richimoku Trading System. What's on the charts is displayed in real time, no cheating...
Feel free to test Kumo Waves or the Richimoku Trading System For 12 hours! Study the chart history on all timeframes. Study all details incl. divergences, trend and investor sentiment etc.
FAQ.
How to access Kumo Waves in tradingview?
To access your indicator simply click on “Indicators” at the top of your Chart, and click on “Invite-Only Scripts”. Click on the indicator to activate it. That’s it!
Will Kumo Waves work for Stock and Index trading?
Sure! It works on all Forex, Stocks, Indexes, Metals and Crypto's!
Does this indicator work with a free TradingView Account?
Yes you can use Kumo Waves or the Richimoku Indicator Trading System with a free TradingView account.
Does the indiators work on all timeframes?
Yes, the indicators can be used on all time frames!


MACD Waves SignalsThia is a standard MACD inclucing thoses signals:
- White line, you are at the possible bottom or top of a flag or a reversal. See it, a warning.
- Green line , possible bullish reversal.
- Red line , possible bearish reversal.
How to use :
- Simply do your waves analysis using the standard MACD of the indicator.
- At critical prices in your analysis, a corresponding bar can help to validate your forecast.
- Do not do your forecast only based on signals.
Happy trading!

Multiple Moving Averages (Rainbow Waves)Two moving averages with toggle for Rainbow Wave mode (total of 16 equally spaced moving averages)

EMA Wave and GRaB Candles by JustUncleLThis is a specialised Price Action Channel (PAC) or Wave that mirrors the indicator used by Raghee Horner, the "34EMA Wave and GRaB Candles".
The Wave consist of:
34 period exponential moving average on the high
34 period exponential moving average on the close
34 period exponential moving average on the low
The GRaB candles colour scheme:
Lime = Bull candle closed above Wave
Green = Bear candle closed above Wave
Red = Bull candle closed below Wave
DarkRed = Bear candle closed below Wave
Aqua = Bull candle closed inside Wave
Blue = Bear candle closed inside Wave
Optionally display a trend direction indication along bottom of chart.
References:
For some details on how Raghee uses this indicator check out this:
www.forexfactory.com
Also her various training and webinar videos on Youtube
Note: This code is licensed under open source GPLv3 terms and conditions. Any modifications to it should be made public and linked to the original code.

MC Waves OscillatorMC Waves Oscillator © is one of the five MC Fractal Studies ©
MC Fractal Studies (c) disassemble the market data in an objective way and organize charts information in order to identify all the various Waves on all the various fractal scales, that make up the typical market charts, and show them to the eyes of investors in an inclusive but detailed way.
The ability to view and examine the multi-scale fractal market structure of a chart can immensely help an investor, giving him an edge that can be used to increase trading performance.

MC Waves SizeMC Waves Size © is one of the five MC Fractal Studies ©
MC Fractal Studies (c) disassemble the market data in an objective way and organize charts information in order to identify all the various Waves on all the various fractal scales, that make up the typical market charts, and show them to the eyes of investors in an inclusive but detailed way.
The ability to view and examine the multi-scale fractal market structure of a chart can immensely help an investor, giving him an edge that can be used to increase trading performance.

MC Wave Structure OnChartMC Wave Structure OnChart © is one of the five MC Fractal Studies ©
MC Fractal Studies (c) disassemble the market data in an objective way and organize charts information in order to identify all the various Waves on all the various fractal scales, that make up the typical market charts, and show them to the eyes of investors in an inclusive but detailed way.
The ability to view and examine the multi-scale fractal market structure of a chart can immensely help an investor, giving him an edge that can be used to increase trading performance.

Elliot Wave OscillatorEWO Indicator, helps to indentify waves
Similar like LazyBear's Indicator: ElliotWave Oscillator
I extended and changed the following:
Allow custom SMA interval default 5 and 35. Dont use EMAs
Choose input source: default close, f.e. use HL2
Show difference of SMAs in percent based on current candle default "true", this is very useful for historical charts

[RS]MTF Donchian Range Wave Sync V1EXPERIMENTAL: using Donchian channels with diferent lengths to extract multiple time frame's to extract price in range rates. the title may be a tiny bit misleading tho -_-''
update: reversed colors, joined the line zone space to make the waves visually stand out more.

Bullish Structure (PAID) by @Crypto_alphabitTVC:GOLD
This script is for bullish structure........
___________________________________
to confirm the bullish structure , the price has to confirm the second higher low to confirm the uptrend ( ⬜️ The key level ) then the other levels will be automatic calculated with mathematic formula .
This indicator contains some important levels as below ....
__________________________________________________
🟥Stop Loss / lowest point
This level is the lowest point or 0 level & you can consider it as Stop Loss
🟫Strong support(0)
This level is very strong support and the price may not come back to that price after making the key level
⬜️The key Level
This level is the second higher low so the bullish structure confirmed for uptrend
🟪accumulation level(1) , 🟪accumulation level(2) , 🟪accumulation level(3)
The price is slowly moving between the 3 accumulation levels but if the price crossed the 3 levels with momentum , means we are in a very strong uptrend
🟫Strong Support(1) , 🟫Strong Support(2)
Those 2 levels are very strong support and strong resistance in the same time
⬜️Resistance
This level is very important as if the price closed above it so it is high probability that the price will go to the safe Exit
🟩Safe Exit
This is safest exit
🟨Golden Exit
This level is the golden exit if the price reached
🟦Extra Exit(1) , 🟦Extra Exit(2) , 🟦Extra Exit(3)
The price may or may not reach the 3 extra exit levels , it depends on the chart analysis, Gaps and momentum .
🟦Final Exit
This is the final target for that wave
In this indicator you can change some inputs to make it perfect as below ....
__________________________________________________
* Lookback Period for High/Low
* Line Width
* Show/ Hide Price Labels
* Label Size
* Extend Drawing for X Bars
* Swing Sensitivity ( Very important)
*** To confirm the bullish momentum you can add MACD indicator as a helper ***
*** To confirm the targets you can match the targets with Gaps ***
________________________________________________________________
This script is by @Crypto_alphabit

CPR + Elliott Wave 3 Combo (Ultra Safe)This will help you to identify the stage of a script. In Elliot wave patter, 3rd wave is the longest length. This will identify the 3rd wave

PIPSTA - Elliott Wave# 🎯 SK-Trading ABC - Stefan Style ULTIMATE
## Overview
This indicator implements an advanced ABC Elliott Wave pattern detection system with the unique "Stefan Style" approach. It identifies high-probability swing trading setups with multiple entry zones, automatic risk-reward calculation, and comprehensive alert system for hands-free trading.
---
## 🔑 Key Features
### 1️⃣ **Intelligent ABC Pattern Recognition**
- Automatic detection of bullish and bearish ABC structures
- Validates retracement ratios (38.2% - 78.6%) for quality setups
- Configurable swing length for different timeframes
- Works on all markets: Forex, Stocks, Crypto, Indices
### 2️⃣ **Dual-Zone Entry System**
#### 🟣 **GKL-Zone (0→A) - Aggressive Entries**
- Available BEFORE pattern activation
- 4 Fibonacci entry levels: 0.5, 0.559, 0.618, 0.667
- For traders who want early positioning
- Purple-colored zone with clear labels
#### 🔵 **BC-Zone (B→A2) - Main Entry System** ⭐
- The "Stefan Style" innovation
- Activates AFTER close breaks Point A
- Tracks A2 (new high/low after activation)
- Entries based on B→A2 retracement (not traditional B→A)
- Tighter risk, better reward ratios
- Blue-colored zone - this is your PRIMARY trading area
### 3️⃣ **Smart Activation Logic**
✅ **Close-Based Activation** (Default)
- Waits for candle CLOSE beyond Point A
- Reduces false breakouts
- More reliable signals
⚡ **A2 Tracking with Locking**
- Monitors new extreme after activation
- Locks A2 on first activation to prevent whipsaws
- Creates stable entry zone
### 4️⃣ **Comprehensive Alert System** 🔔
Never miss a trade with 15+ alert types:
**Setup Alerts:**
- ✅ Pattern Activation (with entry instructions)
- 📍 4 GKL Entry levels (pre-activation)
- 🎯 4 BC-Zone Entry levels (post-activation)
**Trade Management Alerts:**
- 🛑 Stop Loss breach (auto-invalidation)
- 💰 Take Profit 1 (1.618 extension - move to BE)
- 💰 Take Profit 2 (1.809 extension)
- 💰💰 Take Profit 3 (2.0 extension - full target)
All alerts are **alert.freq_once_per_bar** to prevent spam!
### 5️⃣ **Built-in Risk Management**
- Fixed pip-based stop loss (default: 20 pips)
- Minimum RR ratio filter (default: 2.5:1)
- Auto-calculates R-multiples (2R, 3R markers)
- Shows individual RR for each entry level
- Visual SL and TP lines on chart
### 6️⃣ **Professional Dashboard** 📊
Real-time information panel showing:
- ✅ Trade Status: "TRADE BC-ZONE" or "WAIT"
- 📈 Trend Direction
- 🎯 Active Zone (GKL vs BC)
- 💵 All entry levels with prices
- 📍 Stop Loss and Take Profit levels
- 📏 Distance from current price to entries
- ⚖️ Individual RR ratio for each entry
### 7️⃣ **Visual Clarity**
- Color-coded zones and levels
- Clear 0-A-B-C labeling with prices
- "Consumed zones" tracking (grays out touched levels)
- Projection box for C target (1.618-2.0)
- GKL-Box for new cycle after C is reached
- A2 tracking line (dashed orange)
- Trade route arrow visualization
---
## ⚙️ **Settings & Customization**
### Structure Settings
- **Swing Length**: 5-30 (default: 10) - adjust for timeframe
- **Max Sequences**: 1-5 patterns displayed simultaneously
### Display Options
- Toggle C Target Box (1.618-2.0 extension)
- Toggle Activation Line
- Toggle R-Multiple markers
- Toggle GKL-Box after Point C
- Toggle GKL Pre-Activation Zone
- Toggle BC-Zone (main entry area)
### Trade Settings
- **Stop Loss**: 5-100 pips (default: 20)
- **Minimum RR**: 1.0-5.0 (default: 2.5)
### SK System Specific
- ✅ **Close-based Activation**: More reliable than wick breaks
- **Show GKL Pre-Zone**: See aggressive entries before activation
- **Show BC-Zone**: Your main trading area (B→A2)
---
## 📚 **How to Trade This System**
### 🟢 **Conservative Approach** (Recommended)
1. **Wait for Pattern Formation**: 0→A→B structure appears
2. **Wait for Activation Alert**: "🚀 BULLISH/BEARISH ACTIVATED"
3. **Check Dashboard**: Look for "✅ TRADE BC-ZONE"
4. **Set Limit Orders**: In BC-Zone (B→A2) at 0.5, 0.559, 0.618, 0.667 levels
5. **Set Stop Loss**: Below/Above Point B (shown in dashboard)
6. **Set Take Profits**: TP1 (1.618), TP2 (1.809), TP3 (2.0)
7. **Manage Trade**: Move SL to BE at TP1, partial profits at each TP
### ⚡ **Aggressive Approach** (Advanced)
1. **Enter GKL-Zone Pre-Activation**: Use purple zone (0→A retracements)
2. **Risk**: Pattern may not activate
3. **Reward**: Better entry prices if pattern works
4. **Alert**: "🟢/🔴 GKL ENTRY X REACHED - Aggressiv"
### 🎓 **Best Practices**
- ✅ Trade in direction of higher timeframe trend
- ✅ Use multiple entry levels (scale in)
- ✅ Respect minimum RR ratio
- ✅ Let TP3 run for full extension
- ❌ Don't chase after BC-zone is consumed
- ❌ Don't ignore activation requirement
- ❌ Don't trade against major news events
---
## 📊 **Recommended Timeframes**
- **H1 (1-Hour)**: Swing trades, 1-3 day holds
- **H4 (4-Hour)**: Multi-day swings
- **D1 (Daily)**: Position trades, weeks to months
- **Lower timeframes**: Possible but more noise
---
## 🎯 **What Makes This Different?**
### Traditional ABC vs. Stefan Style:
**Traditional ABC:**
- Entries: 50-61.8% retracement of A→B
- Based on original wave measurements
**Stefan Style (This Indicator):**
- Waits for activation (close beyond A)
- Tracks A2 (new extreme after activation)
- Entries: 50-66.7% of B→A2 (the BC-Zone)
- Tighter entries, better RR ratios
- More adaptive to actual price action
### Why BC-Zone Works:
After Point A is broken, the market often makes a new extreme (A2) before retracing. By using B→A2 as your entry reference, you're entering at better prices with tighter stops than traditional methods.
---
## 🔔 **Alert Setup Instructions**
1. Click "Add Alert" on TradingView
2. Condition: Select this indicator
3. Message: Use the built-in alert text (includes prices and instructions)
4. Options: "Once Per Bar Close" (already handled by indicator)
5. Send to: Email, SMS, Webhook, etc.
**You'll receive alerts for:**
- New setups detected
- Activation confirmations
- Entry level touches
- SL breaches
- TP levels reached
---
## 📈 **Performance Tips**
1. **Reduce Visual Load**: Disable unused features in settings
2. **Limit Sequences**: Set Max Sequences to 1-2 for cleaner charts
3. **Timeframe Sync**: Match swing length to your timeframe:
- M15: Swing 5-8
- H1: Swing 8-12
- H4: Swing 10-15
- D1: Swing 12-20
---
## ⚠️ **Disclaimers**
- This indicator is for **educational purposes** only
- Not financial advice - trade at your own risk
- Past performance doesn't guarantee future results
- Always use proper risk management (1-2% per trade)
- Test on demo account first
- Works best in trending conditions, avoid ranging markets
---
## 🛠️ **Technical Details**
- **Pine Script Version**: v6
- **Indicator Type**: Overlay
- **Resources**: Max 150 boxes, 200 lines, 120 labels
- **Pattern Detection**: Pivot-based with ratio validation
- **Alert Frequency**: Once per bar to prevent spam
---
## 📞 **Support & Community**
Join our Telegram channel for:
- Strategy discussions
- Setup examples
- Updates and improvements
- Community support
**Telegram**: @simpleforextools
---
## 🔄 **Version History**
**Current Version**: Ultimate Edition
- ✅ Dual-zone entry system
- ✅ Close-based activation
- ✅ A2 tracking with locking
- ✅ 15+ alert types
- ✅ Consumed zones tracking
- ✅ Professional dashboard
- ✅ RR calculation per entry
- ✅ GKL pre-activation zone
---
## 🏆 **Who Is This For?**
✅ **Perfect for:**
- Swing traders
- Elliott Wave practitioners
- Alert-based traders
- Systematic rule-followers
- Traders who scale into positions
❌ **Not ideal for:**
- Scalpers (too slow)
- Complete beginners (complex system)
- Range-bound market traders
---
## 💡 **Pro Tips**
1. **Confluence is King**: Best results when BC-Zone aligns with:
- Support/Resistance levels
- Fibonacci from higher timeframe
- Round numbers
- Previous structure
2. **Multi-Timeframe Approach**:
- HTF (H4/D1): Identify trend
- LTF (H1): Execute entries
- Use indicator on execution timeframe
3. **Risk Management**:
- Never risk more than 1-2% per trade
- Use multiple entries = divide risk across levels
- Move SL to BE aggressively after TP1

Advanced Elliott Wave PlotterAdvanced Elliott Wave plotter, Parameters can be adjusted.
AI Generated, so no particular credits to anyone.
