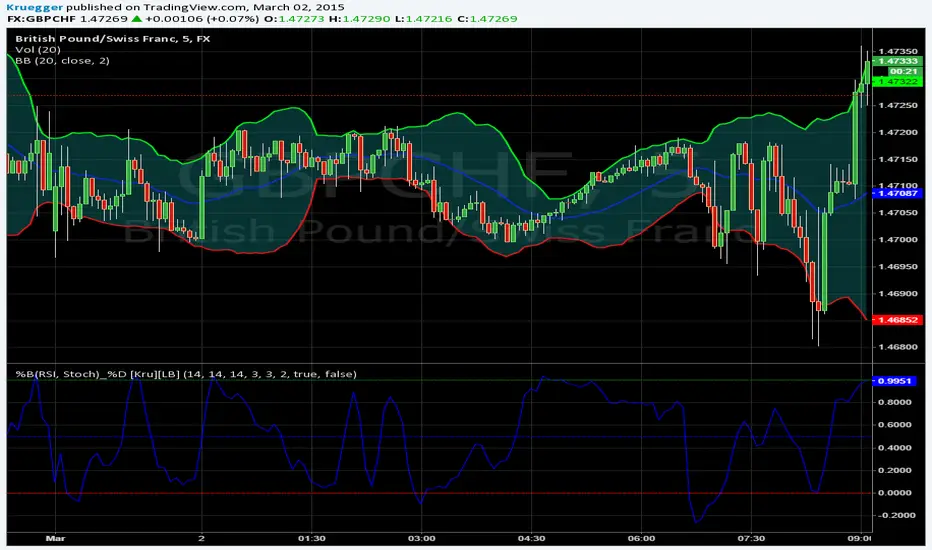
Trend, Stoch, Price Action or in short: TSPCombining the three most important factors that a trader usually needs in a single indicator.
Red = Trend
Blue = Stoch
Orange = Price Action
Buscar en scripts para "stoch"

Cosine smoothed stochasticDescription
The "Cosine Smoothed Stochastic" indicator leverages advanced Fourier Transform techniques to smooth the traditional Stochastic Oscillator. This approach enhances the signal's reliability and reduces noise, providing traders with a more refined and actionable indicator.
The Stochastic Oscillator is a popular momentum indicator that measures the current price relative to the high-low range over a specified period. It helps identify overbought and oversold conditions, signaling potential trend reversals. By smoothing this indicator with Fourier Transform techniques, we aim to reduce false signals and improve its effectiveness.
The indicator comprises three main components:
Cosine Function: A custom function to compute the cosine of an input scaled by a frequency tuner.
Kernel Function: Utilizes the cosine function to create a smooth kernel, constrained to positive values within a specific range.
Kernel Regression and Multi Cosine: Perform kernel regression over a lookback period, with the multi cosine function summing these regressions at varying frequencies for a composite smooth signal.
Additionally, the indicator includes a volume oscillator to complement the smoothed stochastic signals, providing insights into market volume trends.
Features
Fourier Transform Smoothing: Advanced smoothing technique to reduce noise.
Volume Oscillator: Dynamic volume-based oscillator for additional market insights.
Customizable Inputs: Users can configure key parameters like regression lookback period, tuning coefficient, and smoothing length.
Visual Alerts: Buy and sell signals based on smoothed stochastic crossovers.
Usage
The indicator is designed for trend-following and momentum-based trading strategies . It helps identify overbought and oversold conditions, trend reversals, and potential entry and exit points based on smoothed stochastic values and volume trends.
Inputs
Cosine Kernel Setup:
varient: Choose between "Tuneable" and "Stepped" regression types.
lookbackR: Lookback period for regression.
tuning: Tuning coefficient for frequency adjustment.
Stochastic Calculation:
volshow: Toggle to show the volume oscillator.
emalength: Smoothing period for the Stochastic Oscillator.
lookback_period, m1, m2: Parameters for the Stochastic Oscillator lookback and moving averages.
How It Works
Stochastic Oscillator:
Computes the stochastic %K and smoothes it with an EMA.
Further smoothes %K using the multi cosine function.
Volume Oscillator:
Calculates short and long EMAs of volume and derives the oscillator as the percentage difference.
Plots volume oscillator columns with dynamic coloring based on the oscillator's value and change.
Visual Representation:
Plots smoothed stochastic lines with colors indicating bullish, bearish, overbought, and oversold conditions.
Uses plotchar to mark crossovers between current and previous values of d.
Displays overbought and oversold levels with filled regions between them.
Chart Example
To understand the indicator better, refer to the clean and annotated chart provided. The script is used without additional scripts to maintain clarity. The chart includes:
Smoothed Stochastic Lines: Colored according to trend conditions.
Volume Oscillator: Plotted as columns for visual volume trend analysis.
Overbought/Oversold Levels: Clearly marked levels with filled regions between them.
Alert Conditions
The indicator sets up alerts for buy and sell signals when the smoothed stochastic crosses over or under its previous value. These alerts can be used for automated trading systems or manual trading signals.
breakthrough of the indicators method :
Initialization and Inputs:
The indicator starts by defining necessary inputs, such as the lookback period for regression, tuning coefficient, and smoothing parameters for the Stochastic Oscillator and volume oscillator.
Cosine Function and Kernel Creation:
The cosine function is defined to compute the cosine of an input scaled by a frequency tuner.
The kernel function utilizes this cosine function to create a smoothing kernel, which is constrained to positive values within a specific range.
Kernel Regression:
The kernel regression function iterates over the lookback period, calculating weighted sums of the source values using the kernel function. This produces a smoothed value by dividing the accumulated weighted values by the total weights.
Multi Cosine Smoothing:
The multi cosine function combines multiple kernel regressions at different frequencies, summing these results and averaging them to achieve a composite smoothed value.
Stochastic Calculation and Smoothing:
The traditional Stochastic Oscillator is calculated, and its %K value is smoothed using an EMA.
The smoothed %K is further refined using the multi cosine function, resulting in a more reliable and less noisy signal.
Volume Oscillator Calculation:
The volume oscillator calculates short and long EMAs of the volume and derives the oscillator as the percentage difference between these EMAs. The result is plotted with dynamic coloring to indicate volume trends.
Plotting and Alerts:
The indicator plots the smoothed stochastic lines , overbought/oversold levels, and volume oscillator on the chart.
Buy and sell alerts are set up based on crossovers of the smoothed stochastic values, providing traders with actionable signals.

Multi-RSI with Stochastic Oscillator - flack0xA sophisticated momentum analysis tool combining 4 customizable RSI oscillators with an innovative Close/Close Stochastic implementation. Designed for traders seeking comprehensive momentum insights across multiple timeframes in a single, organized indicator.
Key Features:
4 Independent RSI Oscillators with default periods: 2, 3, 9, 27
Innovative Close/Close Stochastic - Compares closing prices to closing price ranges (not high/low)
Complete Customization - Individual control over periods, colors, line widths, and visibility
Reference Levels - Customizable overbought (70), oversold (30), and midline (50) levels
Smart Alert System - Crossover notifications for key momentum shifts
Unique Close/Close Stochastic Methodology:
Unlike traditional Stochastic oscillators that use high/low ranges.
Benefits of Close/Close Approach:
Eliminates Gap Noise - Ignores overnight gaps and intraday wicks
Smoother Signals - Reduces whipsaws common in traditional Stochastic
Position-Relevant - Focuses on actual settlement prices traders care about
Cleaner Momentum Reading - Pure closing price momentum without intraday volatility

Ehlers Two-Pole StochasticThis indicator implements John Ehlers' Two-Pole Stochastic Filter, a smoother alternative to the traditional stochastic oscillator. Instead of relying on raw %K values, it applies a second-order IIR filter (recursive smoothing) to reduce noise and improve trend clarity.
It outputs a single line oscillating between 0 and 1, with less lag and false signals compared to standard stochastic implementations.
Key Features:
Uses a two-pole filter to smooth the normalized stochastic (%K).
Ideal for detecting clean reversals and trend continuations.
Designed for minimal visual noise and greater signal confidence.
Interpretation:
Values near 1.0 may suggest overbought conditions.
Values near 0.0 may suggest oversold conditions.
Crosses above 0.5 can signal bullish shifts, and below 0.5 bearish shifts.
Recommended Settings:
Default smoothing factor (alpha) is 0.7 — higher values make the output more responsive, while lower values smooth further.
Inspired by concepts from Cybernetic Analysis for Stocks and Futures by John F. Ehlers.
Multi-Timeframe Stochastic OverviewPurpose of the Multi-Timeframe Stochastic Indicator:
The Multi-Timeframe Stochastic Indicator provides a consolidated view of market conditions across multiple timeframes (M1, M5, M15, H1) based on the Stochastic Oscillator, a popular technical analysis tool. The main objective is to allow traders to quickly assess momentum and potential trend reversals across different timeframes on a single chart, helping to make informed trading decisions.
---
General Purpose of Stochastic Oscillator:
The Stochastic Oscillator measures the relationship between a security's closing price and its price range over a given period, aiming to identify momentum, overbought/oversold levels, and potential reversal points. It works on the assumption that:
1. In uptrends, prices tend to close near their highs.
2. In downtrends, prices tend to close near their lows.
It consists of two lines:
%K (fast line): Represents the raw Stochastic value.
%D (slow line): A moving average of %K, used to smooth the data for better signals.
The indicator is generally used to:
Identify Overbought (price above 80% threshold) and Oversold (price below 20% threshold) conditions.
Spot Bullish and Bearish divergences for potential trend reversals.
Evaluate momentum strength within a trend.
---
How This Multi-Timeframe Indicator Enhances Stochastic's Utility:
1. Multi-Timeframe Overview:
The indicator calculates Stochastic values for multiple timeframes (1-minute, 5-minute, 15-minute, and 1-hour) and displays their market conditions (e.g., Bullish, Bearish, Overbought, Oversold, or Indecision) in an organized table format.
This gives traders a broad perspective on short-term, mid-term, and long-term trends simultaneously.
2. Market Condition Summary:
Bullish: Indicates upward momentum (both %K and %D > 50%).
Bearish: Indicates downward momentum (both %K and %D < 50%).
Overbought: Suggests potential trend exhaustion (both %K and %D > 80%).
Oversold: Suggests a potential reversal to the upside (both %K and %D < 20%).
Indecision: Highlights uncertainty when %K and %D are on opposite sides of the 50% level.
3. Quick Decision-Making:
The color-coded table (green for Bullish/Overbought, red for Bearish/Oversold, orange for Indecision) allows traders to quickly identify dominant conditions and momentum alignment across timeframes, helping in trade confirmation.
4. Trend Analysis:
By observing alignment or divergence in market conditions across timeframes, traders can gauge the strength of a trend or anticipate reversals. For example:
If all timeframes show "Bullish," it suggests strong momentum.
If smaller timeframes are "Overbought" while larger ones are "Bearish," it warns of a possible pullback.
5. Customizable Parameters:
The indicator allows customization of Stochastic K, D, smoothing values, and overbought/oversold levels, enabling users to tailor the analysis to specific trading styles or market conditions.
---
Use Cases:
1. Scalping:
A scalper can use lower timeframes (e.g., M1, M5) to find overbought/oversold zones for quick trades.
2. Swing Trading:
Swing traders can align smaller timeframes with higher ones (e.g., M15 and H1) to confirm momentum before entering a trade.
3. Trend Reversals:
Overbought or oversold conditions across all timeframes may indicate a major reversal point, helping traders plan exits or countertrend entries.
4. Trend Continuation:
Consistent bullish or bearish conditions across all timeframes confirm the continuation of a trend, providing confidence to hold positions.
---
Summary:
This indicator enhances the traditional Stochastic Oscillator by giving a multi-timeframe snapshot of market momentum, overbought/oversold conditions, and trend direction. It enables traders to quickly assess the overall market state, spot opportunities, and make more informed trading decisions.

Adaptive RSI/Stochastic (ARSIS)As a trader, one of the most important aspects of technical analysis is identifying the dominant cycle of the market. The dominant cycle, also known as the market's "heartbeat," can provide valuable information on the current market trend and potential future price movements. One way to measure the dominant cycle is through the use of the MESA Adaptation - MAMA Cycle function, which is a part of the Dominant Cycle Estimators library.
I have developed an "Adaptive RSI/Stochastic" indicator that incorporates the MAMA Cycle function to provide more accurate and reliable signals. The indicator uses the MAMA Cycle function to calculate the period of the data, which is then used as a parameter in the calculation of the RSI and Stochastic indicators. By adapting the calculation of these indicators to the dominant cycle of the market, the resulting signals are more in tune with the current market conditions and can provide a more accurate representation of the current trend.
The MAMA Cycle function is a powerful tool that utilizes advanced mathematical techniques to accurately calculate the dominant cycle of the market. It takes into account the dynamic nature of the market and adapts the calculation of the period to the current conditions. The result is a more accurate and reliable measurement of the market's dominant cycle, which can be used to improve the performance of other indicators and trading strategies.
In conclusion, the Adaptive RSI/Stochastic indicator that I have developed, which incorporates the MAMA Cycle function, is a valuable tool for any trader looking to improve their technical analysis. By adapting the calculation of the RSI and Stochastic indicators to the dominant cycle of the market, the resulting signals are more in tune with the current market conditions and can provide a more accurate representation of the current trend.
Huge thank you to @lastguru for making this possible!

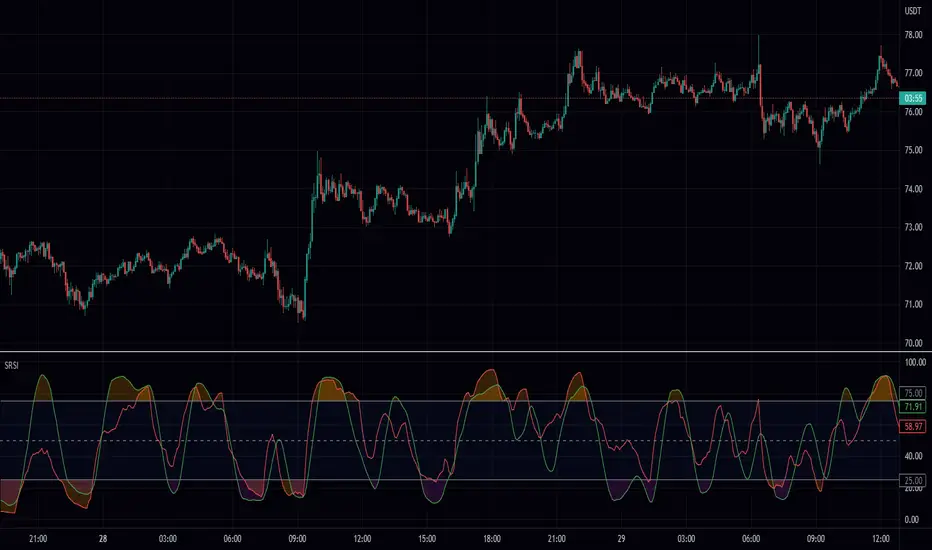
Smooth Stochastic and RSI ComboA lot of people run both stochastic and rsi on one chart so I figured I would make something that combines the two. This script takes both the rsi and the stochastic, smooths them both and then plots them both on top of each other. I have filled it to make an error range and I colored it with the direction of its mean. I hope this frees up some room on your screen! Enjoy!
ps this is not stochastic rsi, its both stochastic and rsi.
DMI Stochastic Momentum IndexConcepts
This is an improved version of the "DMI Stochastic Extreme Refurbished" indicator.
For more information on the main concepts of this indicator, please access this link:
The difference is that here, instead of using the traditional stochastic oscillator, I implemented the use of the Stochastic Momentum Index (SMI).
Stochastic Momentum Index (SMI)
The SMI is considered a refinement of the stochastic oscillator.
It calculates the distance of the current closing price as it relates to the median of the high/low range of price.
William Blau developed the SMI, which attempts to provide a more reliable indicator, less subject to false swings.
The original stochastic is limited to values from 0 to 100, while the SMI varies between the range of -100 to 100.
(Investopedia)
It is worth mentioning that the SMI presented in this script applies to the DMI value, not the screen price.

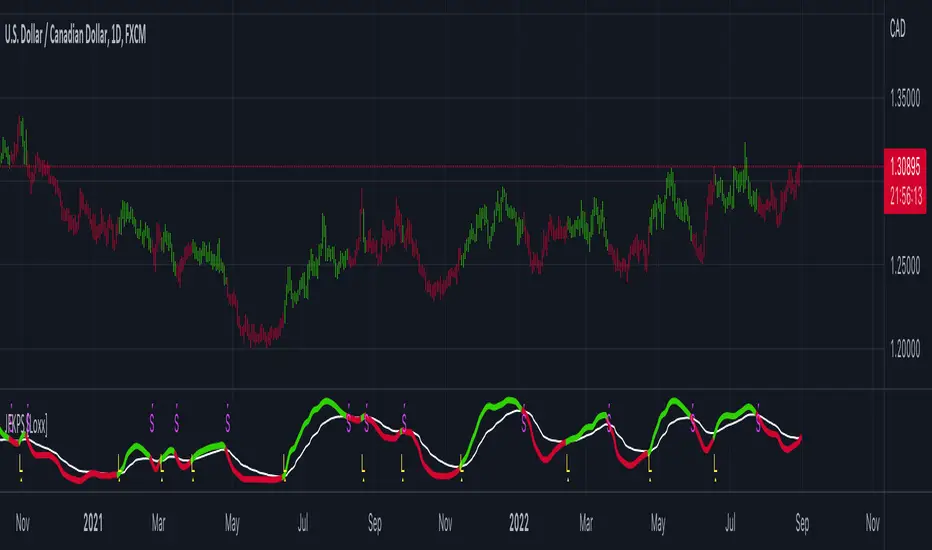
Jurik-Filtered Kase Permission Stochastic [Loxx]Jurik-Filtered Kase Permission Stochastic is a special implementation of Kase Permission Stochastic by Kase StatWare. This implementation uses a Jurik filter to smooth final output.
What is Kase StatWare?
Kase StatWare has been around since 1992 and is a technical analysis trading indicator package developed by the acclaimed market technician and former energy trader Cynthia A. Kase. StatWare’s self-optimizing indicators help professional and individual traders to form a precise and systematic approach to discretionary trading and trade risk management.
Kase StatWare creates subscription-based technical analysis tools mainly for Stocks and Futures trading which can be subscribed to at a monthly cost.
What is Kase Permission Stochastic?
The Kase Permission Stochastic is a momentum indicator that examines a synthetic longer bar length, that by default, is three (5x by default for this implementation here) times higher than the bar length it is plotted against.
Included
Alerts
Signals
Bar coloring
Jurik Smoothed Stochastic - TraderHalaiJurik Smoothed Stochastic
The stochastic indicator has been long used by traders to identify inflection points in the price and to give a direction on Bullish and Bearish bias.
This indicator aims to improve on the plots the %K value smoothed using a Jurik Filter instead of a simple moving average. This allows for a more adaptive K value average price, whilst also providing superior smoothing to traditional moving averages.
As the Jurik Filter is a proprietary and non-open-source implementation, this script uses a common filters library implementation of Jurik MA which is a suitable proxy to the actual Jurik MA filter.
Big thanks to LastGuru for making his version freely available. You can find his version of the Jurik Filters in the credits section below.
%K is the Jurik Smoothed Version of the original Stochastic Formula
%D is calculated using the following formula. This idea was borrowed from John Ehler’s stochastic implementation and can be seen below:
%D = 0.05 + 0.95 * K
Features
%K line, Overbought and Oversold level and Mid Line Level
Oversold / Overbought reversal indicators and signals - Shown in Red and Green
Bullish / Bearish Divergences – Including Hidden divergences to spot reversals and continuations of trend (Big thanks to the developers of the built-in RSI Divergence indicator) - Shown as below:
Bullish / Bearish crossover of %K with %D - Shown in Cyan and Fuschia
Alerts for all of the above conditions
Double Jurik smoothing mode - similar to slow Stochastic
Credits :
Massive shoutout to the following scripts:
LastGuru JurikMA implementation (Common Filters Library)
Divergence Indicator – Built into TradingView and coded by TradingView Developers
This script is published as open source to allow for criticism, further development of this strategy and use by the community. Feel free to use this indicator/source code as you see fit.
Enjoy! :)

Multi-Length Stochastic Average [LuxAlgo]This indicator returns the average of stochastic oscillators with periods ranging from 4 to length . This allows for a slightly more reactive oscillator as well as having information regarding the position of the price relative to rolling maximums/minimums of different periods.
We introduce settings that allow for pre and post-smoothing, with selectable smoothing methods and periods for both steps.
Settings
Length: Period of the indicator, determine the maximum period of the stochastic oscillator used in the average
Source: Source input of the indicator
Pre-Smoothing (1st Input): Degree of smoothing applied to the source input
Pre-Smoothing (2nd Input): Pre-Smoothing Method
Post-Smoothing (1st Input): Degree of smoothing applied to the final oscillator output
Post-Smoothing (2nd Input): Post-Smoothing Method
Smoothing methods include a simple moving average, a triangular moving average, and a least-squares moving average (this method can induce overshoots during the post-smoothing step). The user can also select "None".
Usages
The "multi-length" aspect of technical indicators is something that hasn't been deeply explored yet such indicators can give us information regarding both short-term and long-term information which was the motivation for the creation of the indicator.
The Multi-length Stochastic Average allows us to quantify the price position relative to a multitude of highest/lowest levels.
In the example above the oscillator returns the average of stochastic oscillators with periods ranging from 4 to 20, as well as multiple rolling minimums with periods ranging from 4 to 20. We can see that when the price is equal to all rolling minimums the oscillator is equal to 0, the oscillator would return 100 if the price were equal to all rolling maximums with periods in that same range.
The oscillator can be interpreted like any scaled oscillator and can be used to estimate trend direction as well as trend strength.
Here we only make of use pre-smoothing by using a period 20 simple moving average. The indicator graphical elements such as colors/circles can help us determine potential directions trends might take.
Circles are displayed when the oscillator crosses over/under the 20/80 level. Such conditions offer better timing than waiting for the oscillator to be greater/lower than 50 and are less subjective to noise than simply looking at the direction taken by the oscillator. However, it can suffer from potential retracements in a trend more easily, this is illustrated in the chart above.

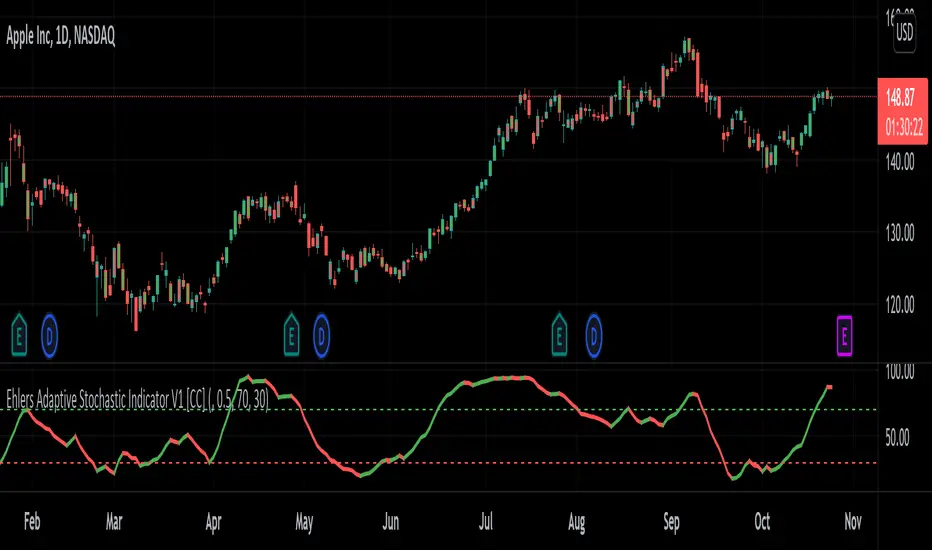
Ehlers Adaptive Stochastic Indicator V1 [CC]The Adaptive Stochastic Indicator V1 was created by John Ehlers (Rocket Science For Traders pgs 233-234) and this indicator uses the same calculations to find a cycle period that is then used for both the creation of the stochastic indicator but also for the smoothing to create a double smoothed stochastic indicator. Because it is calculated this way, this indicator is more reactive than almost any other stochastic indicator and provides clear buy and sell signals especially when the underlying stock is trending. It is interpreted in the same way as a normal stochastic indicator so great buy signals are when the indicator is below the oversold line and starts to move up and vice versa. Buy when the line turns green and sell when it turns red.
Let me know if there are any other indicators you would like to see me publish!
Stochastic OTTStochastic OTT is Anıl Özekşi's latest derived version of Optimized Trend Tracker on Stochastic Oscillator.
You might like to view the original version of the indicator if you don't know about OTT yet:
He tried to solve the fake signals of Stochastic Oscillator by adopting OTT on the indicator.
He advised users to set the stochastic smoothing parameters to 500 and 200 on his latest video about SOTT.
He personally uses 1 min charts on stock market so the parameters of the indicator might have to be optimized for other time frames nad markets.
He exaggerated the Stochastic to 1000's to have better signals of percent values of OTT.
Also hes used VIDYA in both calculations of OTT and Stochastic smoothing.
Hope you'll enjoy the SOTT in your profitable trades.
Kıvanç

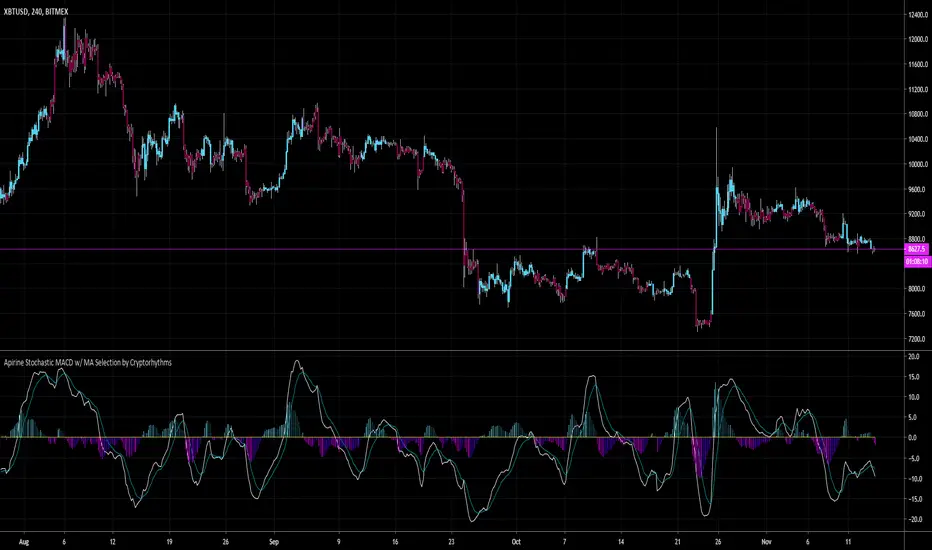
Apirine Stochastic MACD w/ MA Selection by Cryptorhythms📊 Apirine Stochastic MACD w/ MA Selection by Cryptorhythms
Intro
Had to re-release due to moderation.
This happens to be my first open source indicator, hope you all enjoy it!
Description
This indicated is ported from November 2019 issue of TASC. “The Stochastic MACD Oscillator” in this issue, author Vitali Apirine introduces a new indicator created by combining the stochastic oscillator and the MACD . He describes the new indicator as a momentum oscillator and explains that it allows the trader to define overbought and oversold levels similar to the classic stochastic but based on the MACD .
Options
-You can enable bar coloration for trade state (signal conditions setup in the "long" and "short" variables).
-You can choose histogram or columns for the convergence/divergence display.
-You can turn on/off and adjust the overbought / oversold zones.
-You can choose what type of moving average to use in the calculation from a small selection of options. This gives you more flexibility to adapt the indicator to your needs.
👍 We hope you enjoyed this indicator and find it useful! We post free crypto analysis, strategies and indicators regularly. This is our 70th script on Tradingview!
🤐Check my Signature for other information
RSI + StochasticRSI overbought and oversold histogram
Just indicator combo of oldschool slow stochastic and rsi, just looking a little bit better for someone.
Strategy is simple:
1) RSI is overbought or oversold (above 70, below 30)?
2) Stochastic line crosses its ema?
3) Stochastic and stochastic ema are in overbought = sell, oversold = buy.
Works good in volitile stocks/pairs and suits for fast scalping timeframes 1m 5m 15m
Strategy is old as the books, this is just a better visual for it.

CM Stochastic POP Method 1 - Jake Bernstein_V1A good friend ucsgears recently published a Stochastic Pop Indicator designed by Jake Bernstein with a modified version he found.
I spoke to Jake this morning and asked if he had any updates to his Stochastic POP Trading Method. Attached is a PDF Jake published a while back (Please read for basic rules, which also Includes a New Method). I will release the Additional Method Tomorrow.
Jake asked me to share that he has Updated this Method Recently. Now across all symbols he has found the Stochastic Values of 60 and 30 to be the most profitable. NOTE - This can be Significantly Optimized for certain Symbols/Markets.
Jake Bernstein will be a contributor on TradingView when Backtesting/Strategies are released. Jake is one of the Top Trading System Developers in the world with 45+ years experience and he is going to teach how to create Trading Systems and how to Optimize the correct way.
Below are a few Strategy Results....Soon You Will Be Able To Find Results Like This Yourself on TradingView.com
BackTesting Results Example: EUR-USD Daily Chart Since 01/01/2005
Strategy 1:
Go Long When Stochastic Crosses Above 60. Go Short When Stochastic Crosses Below 30. Exit Long/Short When Stochastic has a Reverse Cross of Entry Value.
Results:
Total Trades = 164
Profit = 50, 126 Pips
Win% = 38.4%
Profit Factor = 1.35
Avg Trade = 306 Pips Profit
***Most Consecutive Wins = 3 ... Most Consecutive Losses = 6
Strategy 2:
Rules - Proprietary Optimization Jake Will Teach. Only Added 1 Additional Exit Rule.
Results:
Total Trades = 164
Profit = 62, 876 Pips!!!
Win% = 38.4%
Profit Factor = 1.44
Avg Trade = 383 Pips Profit
***Most Consecutive Wins = 3 ... Most Consecutive Losses = 6
Strategy 3:
Rules - Proprietary Optimization Jake Will Teach. Only added 1 Additional Exit Rule.
Results:
Winning Percent Increases to 72.6%!!! , Same Amount of Trades.
***Most Consecutive Wins = 21 ...Most Consecutive Losses = 4
Indicator Includes:
-Ability to Color Candles (CheckBox In Inputs Tab)
Green = Long Trade
Blue = No Trade
Red = Short Trade
-Color Coded Stochastic Line based on being Above/Below or In Between Entry Lines.
Link To Jakes PDF with Rules
dl.dropboxusercontent.com

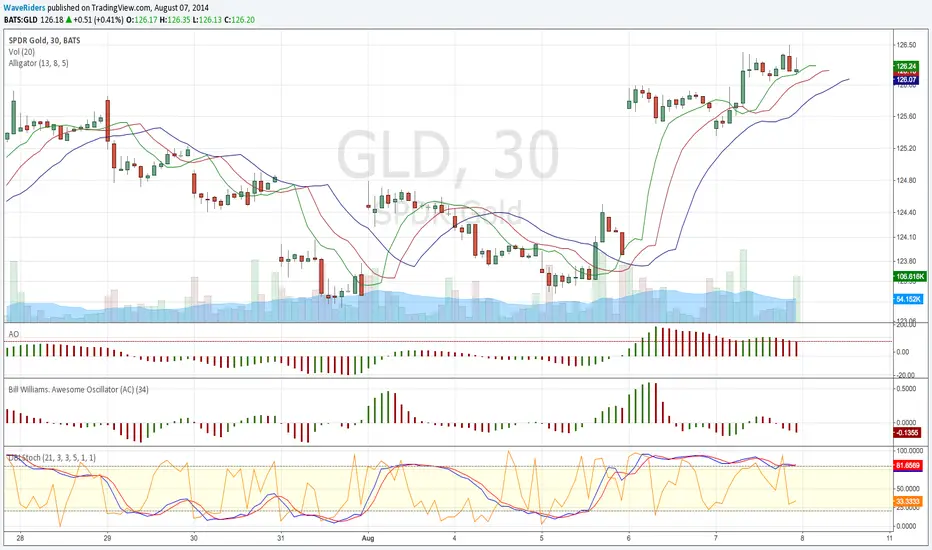
Double StochasticDouble Stochastic is use Slow Stochastic (21,3,3) and Fast Stochastic (5,1,1) to monitor price movement.
Slow Stochastic use for monitor cycle of price.
Fast Stochastic use for monitor price swing and divergence.
Both Stochastic turn together mean price will reverse for real.
Fast Stochastic turn away from Slow Stochastic mean price only minor swing.
.....
Designed by Wave Riders

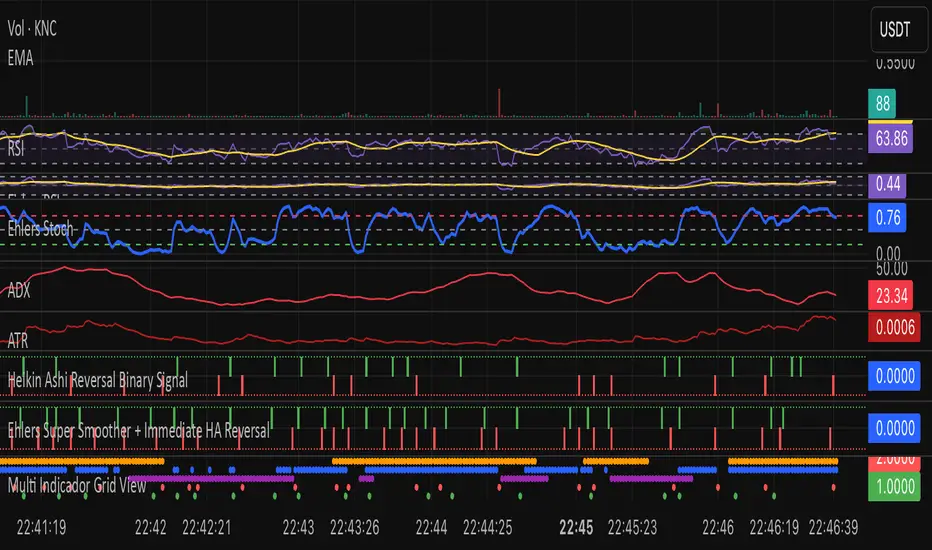
Stochastic RSI + RSI/ADX Stochastic RSI with RSI/ADX Display
DESCRIPTION:
Advanced momentum oscillator combining Stochastic RSI with Ehlers SuperSmoother filter for reduced noise and cleaner signals. Includes real-time RSI and ADX value displays for complete market analysis.
KEY FEATURES:
- Stochastic RSI applied to logarithmic price for normalized movements
- Ehlers SuperSmoother filter reduces lag while eliminating false signals
- Second derivative (curvature) analysis filters out low-probability setups
- Real-time RSI and ADX boxes with color-coded thresholds
- Buy/Sell signals only trigger with confirmed momentum and curvature alignment
COMPONENTS:
1. K Line (Blue): Smoothed Stochastic RSI
2. D Line (Orange): Signal line (SMA of K)
3. RSI Box: Green above 50, Red below 50
4. ADX Box: Green above 25 (trending), Red below 25 (ranging)
SIGNAL LOGIC:
BUY: K crosses above D + positive curvature + below midpoint (50)
SELL: K crosses below D + negative curvature + above midpoint (50)
PARAMETERS:
- K Smoothing: 10 (Ehlers filter period)
- D Smoothing: 3 (Signal line)
- RSI

Multitimeframe Stochastic RSIIndicator is Combining 4 different timeframe Stochastic RSI and show buy signal when all of them are oversold and sell signal when all of them are overbought.
Default settings are set up for 15 minute timeframe:
K1 - 15M (period = 14)
K2 - 30M (period = 28)
K3 - 1H (period = 56)
K4 - 2H (period = 112)
It indicates top and bottoms of given period.
Its good to use as a confirmation indicator.
Feel free to comment and use it.
Greetings!

MACD + StochasticMACD + Stochastic 14 Scenarios - Complete Signal Analysis
Combines MACD and Stochastic Oscillator to identify 14 different market scenarios based on crossover timing and indicator positioning.
🎯 Signal Strength Classification:
• STRONG (⭐⭐⭐⭐⭐): Both indicators cross together - highest confidence
• MODERATE (⭐⭐⭐⭐): One crosses while other confirms - good confidence
• WEAK (⭐⭐): Conflicting signals - low confidence
📊 Visual Features:
✓ Color-coded shapes on chart (triangles, circles, X marks)
✓ Scenario labels (1-16, excluding 12 & 14)
✓ Real-time info table showing current status
✓ Customizable signal display (show/hide by strength)
✓ Built-in alerts for all signal types
Perfect for swing traders and position traders looking for high-probability entries with dual indicator confirmation. Use on daily
timeframe for best results.
Includes toggleable display options for strong, moderate, and weak signals.

Stochastic MACDStochastic MACD Indicator: Quick Guide
This Pine Script indicator, "Stochastic MACD" (SMACD), blends MACD and Stochastic Oscillator principles to help you spot momentum shifts and potential reversals.
What it Shows:
SMACD Line: Tracks momentum.
Signal Line: Averages the SMACD line, creating crossovers.
Histogram: Visualizes momentum strength, changing color with direction.
Overbought/Oversold Levels: (Default 10 and -10) Help identify stretched market conditions. Adjustable in settings.
Visual Signals (Triangles):
Red Down Arrow (Overbought Signal): Appears when both SMACD and Signal lines are above the Overbought level (default 10) AND SMACD crosses the Signal line upwards. This suggests strong overbought conditions and a potential reversal down.
Green Up Arrow (Oversold Signal): Appears when both SMACD and Signal lines are below the Oversold level (default -10) AND SMACD crosses the Signal line upwards. This suggests potential buying opportunities from oversold conditions and a possible reversal up.
How to Use It:
Confirm Trends: Use the histogram and line directions.
Spot Reversals: Look for the red and green triangles for quick alerts.
Combine: Always use with other analysis like price action or support/resistance.
Important: This is an analytical tool, not financial advice. Trading involves risk.
