Buscar en scripts para "momentum"

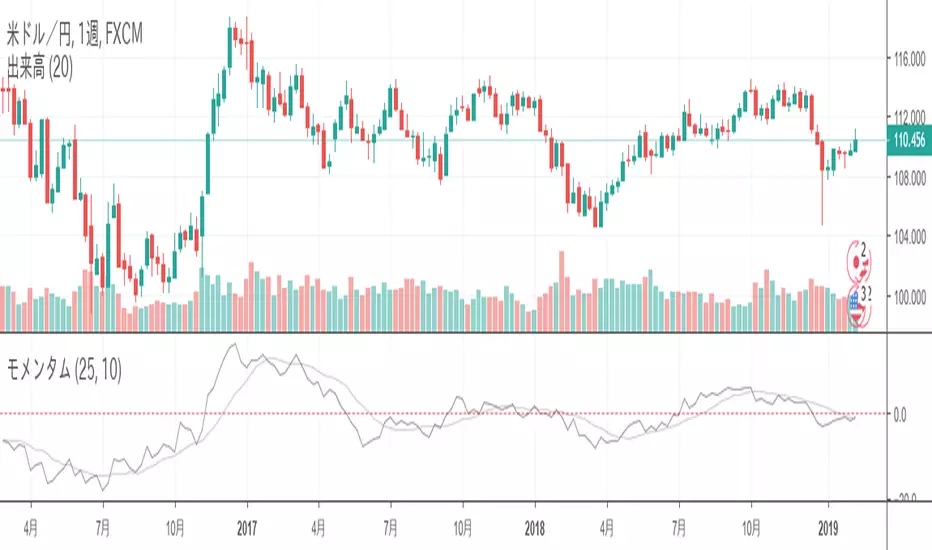
MomentumMomentum is differences between closing price and closing price on day before n day.
---
モメンタムは、n日前の終値と当日終値の差を数値化したものです。
モメンタムの移動平均線も同時に作成します。


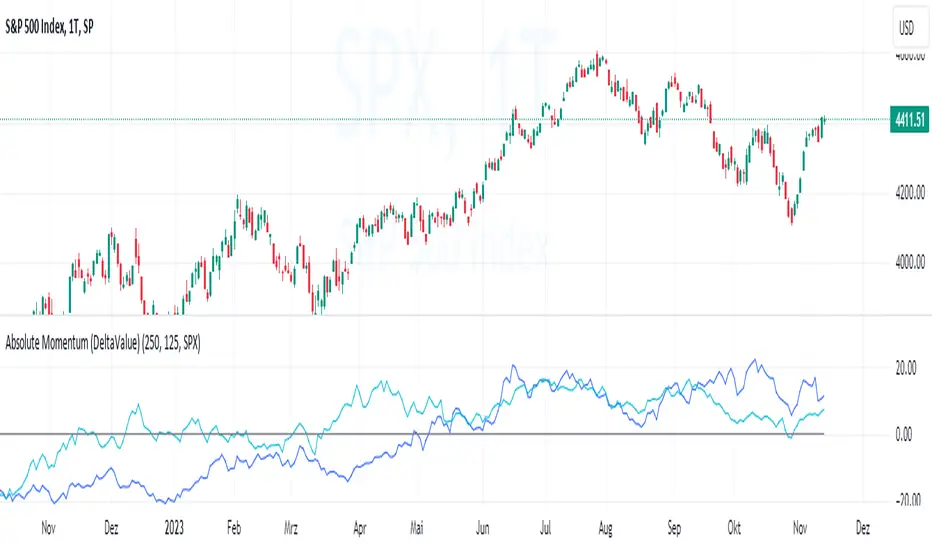
Absolute Momentum (Time Series Momentum)Absolute momentum , also known as time series momentum , focuses on the trend of an asset's own past performance to predict its future performance. It involves analyzing an asset's own historical performance, rather than comparing it to other assets.
The strategy determines whether an asset's price is exhibiting an upward (positive momentum) or downward (negative momentum) trend by assessing the asset's return over a given period (standard look-back period: 12 months or approximately 250 trading days). Some studies recommend calculating momentum by deducting the corresponding Treasury bill rate from the measured performance.
Absolute Momentum Indicator
The Absolute Momentum Indicator displays the rolling 12-month performance (measured over 250 trading days) and plots it against a horizontal line representing 0%. If the indicator crosses above this line, it signifies positive absolute momentum, and conversely, crossing below indicates negative momentum. An additional, optional look-back period input field can be accessed through the settings.
Hint: This indicator is a simplified version, as some academic approaches measure absolute momentum by subtracting risk-free rates from the 12-month performance. However, even with higher rates, the values will still remain close to the 0% line.
Benefits of Absolute Momentum
Absolute momentum, which should not be confused with relative momentum or the momentum indicator, serves as a timing instrument for both individual assets and entire markets.
Gary Antonacci , a key contributor to the absolute momentum strategy (find study below), emphasizes its effectiveness in multi-asset portfolios and its importance in long-only investing. This is particularly evident in a) reducing downside volatility and b) mitigating behavioral biases.
Moskowitz, Ooi, and Pedersen document significant 'time series momentum' across various asset classes, including equity index, currency, commodity, and bond futures, in 58 liquid instruments (find study below). There's a notable persistence in returns ranging from one to 12 months, which tends to partially reverse over longer periods. This pattern aligns with sentiment theories suggesting initial under-reaction followed by delayed over-reaction.
Despite its surprising ease of implementation, the academic community has successfully measured the effects of absolute momentum across decades and in every major asset class, including stocks, bonds, commodities, and foreign exchange (FX).
Strategies for Implementing Absolute Momentum:
To Buy a Stock:
Select a Look-Back Period: Choose a historical period to analyze the stock's performance. A common period is 12 months, but this can vary based on your investment strategy.
Calculate Excess Return: Determine the stock's excess return over this period. You can also assume a risk-free rate of "0" to simplify the process.
Evaluate Momentum:
If the excess return is positive, it indicates positive absolute momentum. This suggests the stock is in an upward trend and could be a good buying opportunity.
If the excess return is negative, it suggests negative momentum, and you might want to delay buying.
Consider further conditions: Align your decision with broader market trends, economic indicators, or fundamental analysis, for additional context.
To Sell a Stock You Own:
Regularly Monitor Performance: Use the same look-back period as for buying (e.g., 12 months) to regularly assess the stock's performance.
Check for Negative Momentum: Calculate the excess return for the look-back period. Again, you can assume a risk-free rate of "0" to simplify the process. If the stock shows negative momentum, it might be time to consider selling.
Consider further conditions:Align your decision with broader market trends, economic indicators, or fundamental analysis, for additional context.
Important note: Note: Entering a position (i.e., buying) based on positive absolute momentum doesn't necessarily mean you must sell it if it later exhibits negative absolute momentum. You can initiate a position using positive absolute momentum as an entry indicator and then continue holding it based on other criteria, such as fundamental analysis.
General Tips:
Reassessment Frequency: Decide how often you will reassess the momentum (monthly, quarterly, etc.).
Remember, while absolute momentum provides a systematic approach, it's recommendable to consider it as part of a broader investment strategy that includes diversification, risk management, fundamental analysis, etc.
Relevant Capital Market Studies:
Antonacci, Gary. "Absolute momentum: A simple rule-based strategy and universal trend-following overlay." Available at SSRN 2244633 (2013)
Moskowitz, Tobias J., Yao Hua Ooi, and Lasse Heje Pedersen. "Time series momentum." Journal of financial economics 104.2 (2012): 228-250
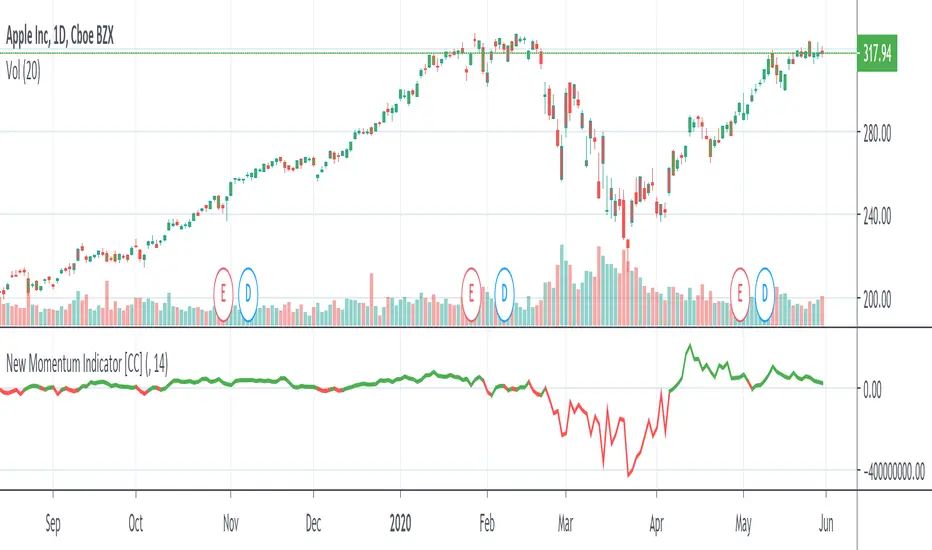
New Momentum IndicatorThe Momentum Indicator was created by Darryl W Maddox (Stocks & Commodities V. 9:4 (158-159)) and it is one of the simplest and most powerful indicators out there. Buy when the indicator goes over 0 and sell when it falls below 0
Let me know what other indicators you would like to see me write a script for!
ATR Momentum [QuantVue]ATR Momentum is a dynamic technical analysis tool designed to assess the momentum of a securities price movement. It utilizes the comparison between a faster short-term Average True Range (ATR) and a slower long-term ATR to determine whether momentum is increasing or decreasing.
This indicator visually represents the momentum relationship by plotting both ATR values as lines on a chart and applying color fill between the lines based on if momentum is increasing or decreasing.
When the short-term ATR is greater than the long-term ATR, representing increasing momentum, the area between them is filled with green.
Conversely, when the short-term ATR is less than the long-term ATR line, the area between them is filled with red. This red fill indicates decreasing momentum.
Don't hesitate to reach out with any questions or concerns.
We hope you enjoy!
Cheers.

Cyber Momentum StrategyStrategy base on the PRISM Oscillators Set as it foundation, with stop-loss algorithm integrated.
~ * ~ * ~ * ~ * ~ * ~ * ~ * ~ * ~ * ~ * ~ * ~ * ~ * ~ * ~ * ~ * ~ * ~ * ~ * ~ * ~
Note:
In no way is this intended as a financial/investment/trading advice. You are responsible for your own investment decisions and trades.
Please exercise your own judgement for your own trades base on your own risk-aversion level and goals as an investor or a trader. The use of OTHER indicators and analysis in conjunction (tailored to your own style of investing/trading) will help improve confidence of your analysis, for you to determine your own trade decisions.
~ * ~ * ~ * ~ * ~ * ~ * ~ * ~ * ~ * ~ * ~ * ~ * ~ * ~ * ~ * ~ * ~ * ~ * ~ * ~ * ~
Please check out my other indicators sets and series, e.g.
LIVIDITIUM (dynamic levels),
AEONDRIFT (multi-levels standard deviation bands),
FUSIONGAPS (MA based oscillators),
MAJESTIC (Momentum/Acceleration/Jerk Oscillators),
PRISM (pSAR based oscillator, with RSI/StochRSI as well as Momentum/Acceleration/Jerk indicators),
PDF (parabolic SAR /w HighLow Trends Indicator/Bar-color-marking + Dynamic Fib Retrace and Extension Level)
and more to come.
Constructive feedback and suggestions are welcome.
To continue to keep this strategy free to use, especially if it has benefited your trades, please consider tipping a little of any gains you've made to my HRT fund. =D
cybernetwork @ EOS
37DzRVwodp5UZBYjCKvVoZ5bDdDqhr7798 @ BTC
MPr8Zhmpsx2uh3F5R4WD98MRJJpwuLBhA3 @ LTC
1Je6c1vvSCW7V2vA6RYDt6CEvqGYgT44F4 @ BCH
AS259bXGthuj4VZ1QPzD39W3ut4fQV5giC @ NEO
rDonew8fRDkZFv7dZYe5w3L1vJSE51zFAx @ Ripple XRP
0xc0161d27201914FC0bAe5e350a193c8658fc4742 @ ETH
GAX6UDAJ52OGZW4FVVG3WLGIOJLGG2C7CTO5ZDUK2P6M6QMYBJMSJTDL @ Stellar XLM
xrb_16s8cj8eoangfa96shsnkir3wctdzy76ajui4zexek6xmqssweu85rdjxrt4 @ Nano
~ JuniAiko
(=^~^=)v~

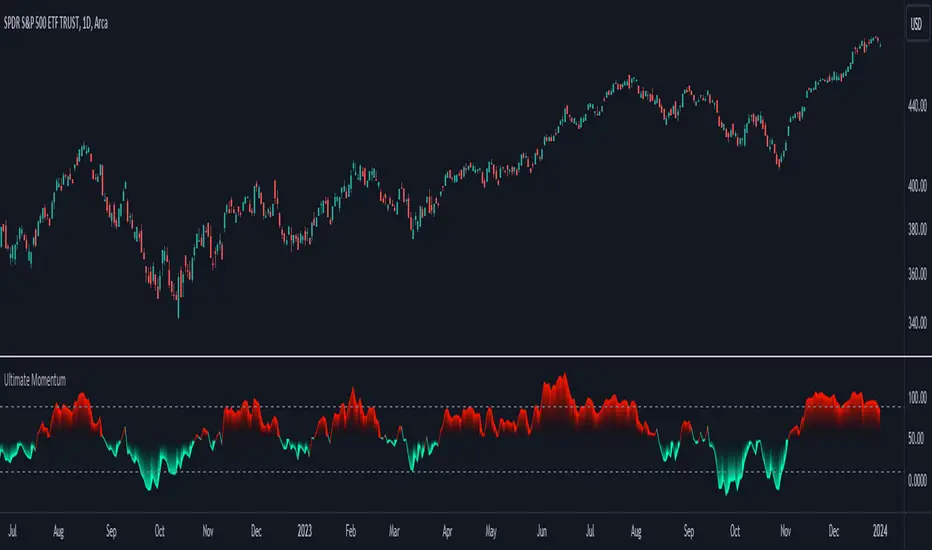
Ultimate Momentum"Ultimate Momentum" – Elevating Your Momentum Analysis
Experience a refined approach to momentum analysis with "Ultimate Momentum," a sophisticated indicator seamlessly combining the strengths of RSI and CCI. This tool offers a nuanced understanding of market dynamics with the following features:
1. Harmonious Fusion: Witness the dynamic interplay between RSI and CCI, providing a comprehensive understanding of market nuances.
2. Optimized CCI Dynamics: Delve confidently into market intricacies with optimized CCI parameters, enhancing synergy with RSI for a nuanced perspective on trends.
3. Standardized Readings: "Ultimate Momentum" standardizes RSI and CCI, ensuring consistency and reliability in readings for refined signals.
4. Native TradingView Integration: Immerse yourself in the reliability of native TradingView codes for RSI and CCI, ensuring stability and compatibility.
How RSI and CCI Work Together:
RSI (Relative Strength Index): Captures price momentum with precision, measuring the speed and change of price movements.
CCI (Commodity Channel Index): Strategically integrated to complement RSI, offering a unique perspective on price fluctuations and potential trend reversals.
Why "Ultimate Momentum"?
In a crowded landscape, "Ultimate Momentum" stands out, redefining how traders interpret momentum. Gain a profound understanding of market dynamics, spot trend reversals, and make informed decisions.
Your Insights Matter:
Share your suggestions to enhance "Ultimate Momentum" in the comments. Your feedback is crucial as we strive to deliver an unparalleled momentum analysis tool.
ADX Momentum Shaded CandlesDescription:
The "ADX Momentum Shaded Candles" indicator (ADXMSC) is an overlay indicator that enhances candlestick charts by adding shading based on the momentum derived from the Average Directional Index (ADX). This indicator provides visual cues about the strength of bullish and bearish momentum by adjusting the transparency of the candlesticks.
How it Works:
The indicator utilizes the ADX indicator to calculate the values of +DI (Directional Indicator Plus) and -DI (Directional Indicator Minus) based on user-defined parameters. It then determines the transparency levels for the bullish and bearish candlesticks based on the calculated values of +DI and -DI. Higher values of +DI or -DI result in lower transparency levels, while lower values increase transparency.
Transparency Calculation:
The transparency of the bullish and bearish candlesticks is adjusted based on the values of +DI and -DI, which reflect the momentum of the price movement. Transparency is inversely proportional to these values, with higher values resulting in lower transparency. To calculate transparency, the indicator uses the formula 100 minus the value of +DI or -DI multiplied by 2. This ensures that higher values of +DI or -DI produce more opaque candlesticks.
Usage:
To effectively use the "ADX Momentum Shaded Candles" indicator (ADXMSC), follow these steps:
1. Apply the indicator to your chart by adding it from the available indicators.
2. Observe the candlesticks on the chart:
- Bullish candlesticks are represented by the original bullish color with adjusted transparency.
- Bearish candlesticks are represented by the original bearish color with adjusted transparency.
3. Analyze the transparency levels of the candlesticks to assess the strength of bullish and bearish momentum. Less transparent candlesticks indicate stronger momentum, while more transparent ones suggest weaker momentum.
4. Combine the visual information from the shaded candlesticks with other technical analysis tools, such as support and resistance levels, trend lines, or oscillators, to confirm potential trade opportunities.
5. Customize the indicator's parameters, such as the ADX length and smoothing, to suit your trading preferences.
6. Implement appropriate risk management strategies, including setting stop-loss orders and position sizing, to manage your trades effectively and protect your capital.

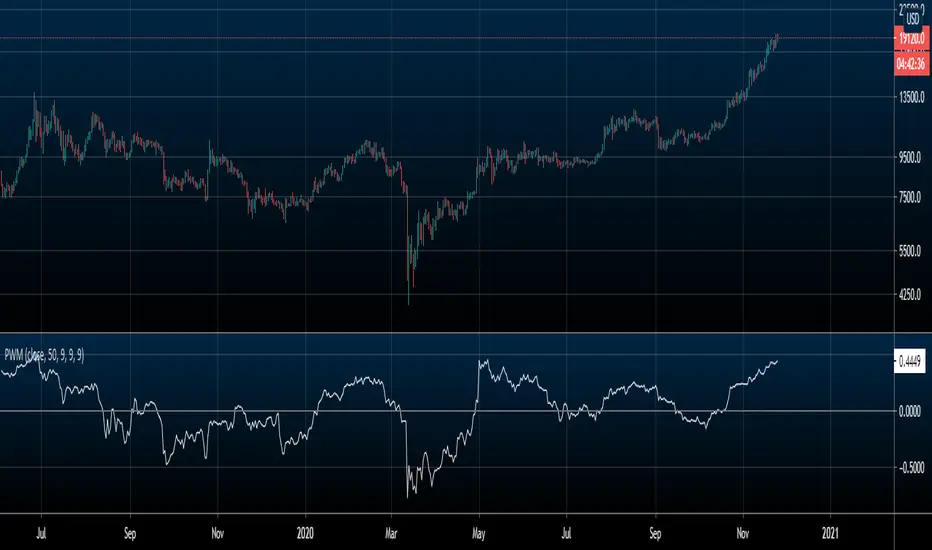
Price Weighted MomentumThis indicator is a momentum indicator that is standardized by price. A.K.A (momentum / price)
The purpose of this indicator is to compare momentum between different assets regardless of price.
EX: Bitcoin will always have more momentum than XLE because it's price is $19000 (as of writing this) compared to XLE's price of $40 (as of writing this). But if you divide the momentum by price, you get a standardized value to better compare the 2.
This indicator can be used to compare everything on TradingView.
HOW TO USE/INTERPRET
Positive values denote an uptrend
Negative values denote a downtrend
A value of 0 (or very very close to 0) denotes sideways price action
WHAT'S INCLUDED
Price Weighted Momentum (Unsmoothed by default)
Optional smoothing with either a simple or exponential moving average
Side note: I only added functionality of smoothing for EMA and SMA for my personal uses, but if you want a version of this with another way of smoothing (e.g. HMA, SSMA, etc.) that you would like, the cost of me adding that for you is a follow on Twitter. Just DM me there :)
TS - Momentum OscillatorWhat is it?
RMI & EMA based momentum oscillator to act as a supporting indicator to the rest of the Tradespot indicator suite. Combined trading is made intuitive and accessible to traders of all levels.
Momentum can help you confirm an existing trade, whether to hold position and avoid fakeouts. or it may let you know when the market is losing steam for example and could be a good point to take profit.
Access
This is one of the indicators in our greater trading suite that we offer. Just PM me for access!

CSI Cycle Swing MomentumAdaptive Ultra-Smooth Momentum (Cycle-Swing Indicator – CSI)
The Cycle-Swing Indicator (CSI) is an advanced, adaptive momentum oscillator designed to extract clean, reliable signals from market data by focusing on the swing of the dominant market cycle rather than raw momentum. By identifying and aligning with the current dominant cycle, the CSI produces a momentum curve that is exceptionally smooth, responsive, and context-aware.
Key Advantages
The CSI offers several improvements over traditional momentum-based indicators:
Ultra-smooth signal line without sacrificing responsiveness
Zero-lag behavior, enabling timely entries and exits
Pronounced turning-point precision, enhancing signal clarity
Adaptive to real market cycles, automatically adjusting to changing conditions
Reliable deviation and divergence detection, even in noisy environments
Why Standard Indicators Fall Short
Conventional oscillators often struggle in real-world market conditions:
Excessive noise leads to frequent false signals.
Added smoothing reduces noise but introduces significant lag, delaying actionable insights.
Fixed-length parameters make indicators highly sensitive to user settings—you never truly know the "right" length.
The CSI solves all these challenges through its adaptive cyclic algorithm, which automatically aligns itself with the market’s dominant cycle—no manual tuning required.
Practical Example
In the example chart, the CSI highlights clear turning points and deviations with far less noise than the standard momentum indicator, demonstrating its superior clarity and responsiveness.
How to Use
The CSI is fully adaptive and requires no parameters. Simply apply it to any symbol and timeframe—the indicator automatically detects the dominant cycle and produces an ultra-smooth, cycle-aligned momentum curve.
Included features:
Adaptive upper and lower bands identifying extreme conditions
Automatic divergence detection (toggle on/off)
Works on any timeframe and any asset
Adaptive length - no input parameter required
How to Read the Indicator
The CSI functions similarly to a traditional momentum oscillator but with enhanced adaptive context:
Look for divergences between price and the CSI signal line — powerful early warnings of weakening trends or impending shifts.
Note on Divergence Signals:
The divergence markers displayed on the chart are generated using embedded pivot-based detection. Because pivots must be confirmed by price action, divergence signals can only be plotted after a pivot forms. For real-time monitoring on the latest bar, users should watch for early-forming divergences as they develop, since confirmed pivot-based divergences will always appear with a slight delay. Script parameters are available for precise adjustment of pivot detection behaviour.
Info: Legacy vs. Pro Version
This is the actively maintained and continuously enhanced edition of my free, open-source indicator “Cycle Swing Momentum”. The Pro Version will remain fully up to date with the latest Pine Script standards and will receive ongoing refinements and feature improvements, all while preserving the core logic and intent of the original tool. The legacy version will continue to be available for code review and educational purposes, but it will no longer receive updates. The legacy open-source version is always available in the public TV indicator repository.
Script de pago

Volatility-Targeted Momentum Portfolio [BackQuant]Volatility-Targeted Momentum Portfolio
A complete momentum portfolio engine that ranks assets, targets a user-defined volatility, builds long, short, or delta-neutral books, and reports performance with metrics, attribution, Monte Carlo scenarios, allocation pie, and efficiency scatter plots. This description explains the theory and the mechanics so you can configure, validate, and deploy it with intent.
Table of contents
What the script does at a glance
Momentum, what it is, how to know if it is present
Volatility targeting, why and how it is done here
Portfolio construction modes: Long Only, Short Only, Delta Neutral
Regime filter and when the strategy goes to cash
Transaction cost modelling in this script
Backtest metrics and definitions
Performance attribution chart
Monte Carlo simulation
Scatter plot analysis modes
Asset allocation pie chart
Inputs, presets, and deployment checklist
Suggested workflow
1) What the script does at a glance
Pulls a list of up to 15 tickers, computes a simple momentum score on each over a configurable lookback, then volatility-scales their bar-to-bar return stream to a target annualized volatility.
Ranks assets by raw momentum, selects the top 3 and bottom 3, builds positions according to the chosen mode, and gates exposure with a fast regime filter.
Accumulates a portfolio equity curve with risk and performance metrics, optional benchmark buy-and-hold for comparison, and a full alert suite.
Adds visual diagnostics: performance attribution bars, Monte Carlo forward paths, an allocation pie, and scatter plots for risk-return and factor views.
2) Momentum: definition, detection, and validation
Momentum is the tendency of assets that have performed well to continue to perform well, and of underperformers to continue underperforming, over a specific horizon. You operationalize it by selecting a horizon, defining a signal, ranking assets, and trading the leaders versus laggards subject to risk constraints.
Signal choices . Common signals include cumulative return over a lookback window, regression slope on log-price, or normalized rate-of-change. This script uses cumulative return over lookback bars for ranking (variable cr = price/price - 1). It keeps the ranking simple and lets volatility targeting handle risk normalization.
How to know momentum is present .
Leaders and laggards persist across adjacent windows rather than flipping every bar.
Spread between average momentum of leaders and laggards is materially positive in sample.
Cross-sectional dispersion is non-trivial. If everything is flat or highly correlated with no separation, momentum selection will be weak.
Your validation should include a diagnostic that measures whether returns are explained by a momentum regression on the timeseries.
Recommended diagnostic tool . Before running any momentum portfolio, verify that a timeseries exhibits stable directional drift. Use this indicator as a pre-check: It fits a regression to price, exposes slope and goodness-of-fit style context, and helps confirm if there is usable momentum before you force a ranking into a flat regime.
3) Volatility targeting: purpose and implementation here
Purpose . Volatility targeting seeks a more stable risk footprint. High-vol assets get sized down, low-vol assets get sized up, so each contributes more evenly to total risk.
Computation in this script (per asset, rolling):
Return series ret = log(price/price ).
Annualized volatility estimate vol = stdev(ret, lookback) * sqrt(tradingdays).
Leverage multiplier volMult = clamp(targetVol / vol, 0.1, 5.0).
This caps sizing so extremely low-vol assets don’t explode weight and extremely high-vol assets don’t go to zero.
Scaled return stream sr = ret * volMult. This is the per-bar, risk-adjusted building block used in the portfolio combinations.
Interpretation . You are not levering your account on the exchange, you are rescaling the contribution each asset’s daily move has on the modeled equity. In live trading you would reflect this with position sizing or notional exposure.
4) Portfolio construction modes
Cross-sectional ranking . Assets are sorted by cr over the chosen lookback. Top and bottom indices are extracted without ties.
Long Only . Averages the volatility-scaled returns of the top 3 assets: avgRet = mean(sr_top1, sr_top2, sr_top3). Position table shows per-asset leverages and weights proportional to their current volMult.
Short Only . Averages the negative of the volatility-scaled returns of the bottom 3: avgRet = mean(-sr_bot1, -sr_bot2, -sr_bot3). Position table shows short legs.
Delta Neutral . Long the top 3 and short the bottom 3 in equal book sizes. Each side is sized to 50 percent notional internally, with weights within each side proportional to volMult. The return stream mixes the two sides: avgRet = mean(sr_top1,sr_top2,sr_top3, -sr_bot1,-sr_bot2,-sr_bot3).
Notes .
The selection metric is raw momentum, the execution stream is volatility-scaled returns. This separation is deliberate. It avoids letting volatility dominate ranking while still enforcing risk parity at the return contribution stage.
If everything rallies together and dispersion collapses, Long Only may behave like a single beta. Delta Neutral is designed to extract cross-sectional momentum with low net beta.
5) Regime filter
A fast EMA(12) vs EMA(21) filter gates exposure.
Long Only active when EMA12 > EMA21. Otherwise the book is set to cash.
Short Only active when EMA12 < EMA21. Otherwise cash.
Delta Neutral is always active.
This prevents taking long momentum entries during obvious local downtrends and vice versa for shorts. When the filter is false, equity is held flat for that bar.
6) Transaction cost modelling
There are two cost touchpoints in the script.
Per-bar drag . When the regime filter is active, the per-bar return is reduced by fee_rate * avgRet inside netRet = avgRet - (fee_rate * avgRet). This models proportional friction relative to traded impact on that bar.
Turnover-linked fee . The script tracks changes in membership of the top and bottom baskets (top1..top3, bot1..bot3). The intent is to charge fees when composition changes. The template counts changes and scales a fee by change count divided by 6 for the six slots.
Use case: increase fee_rate to reflect taker fees and slippage if you rebalance every bar or trade illiquid assets. Reduce it if you rebalance less often or use maker orders.
Practical advice .
If you rebalance daily, start with 5–20 bps round-trip per switch on liquid futures and adjust per venue.
For crypto perp microcaps, stress higher cost assumptions and add slippage buffers.
If you only rotate on lookback boundaries or at signals, use alert-driven rebalances and lower per-bar drag.
7) Backtest metrics and definitions
The script computes a standard set of portfolio statistics once the start date is reached.
Net Profit percent over the full test.
Max Drawdown percent, tracked from running peaks.
Annualized Mean and Stdev using the chosen trading day count.
Variance is the square of annualized stdev.
Sharpe uses daily mean adjusted by risk-free rate and annualized.
Sortino uses downside stdev only.
Omega ratio of sum of gains to sum of losses.
Gain-to-Pain total gains divided by total losses absolute.
CAGR compounded annual growth from start date to now.
Alpha, Beta versus a user-selected benchmark. Beta from covariance of daily returns, Alpha from CAPM.
Skewness of daily returns.
VaR 95 linear-interpolated 5th percentile of daily returns.
CVaR average of the worst 5 percent of daily returns.
Benchmark Buy-and-Hold equity path for comparison.
8) Performance attribution
Cumulative contribution per asset, adjusted for whether it was held long or short and for its volatility multiplier, aggregated across the backtest. You can filter to winners only or show both sides. The panel is sorted by contribution and includes percent labels.
9) Monte Carlo simulation
The panel draws forward equity paths from either a Normal model parameterized by recent mean and stdev, or non-parametric bootstrap of recent daily returns. You control the sample length, number of simulations, forecast horizon, visibility of individual paths, confidence bands, and a reproducible seed.
Normal uses Box-Muller with your seed. Good for quick, smooth envelopes.
Bootstrap resamples realized returns, preserving fat tails and volatility clustering better than a Gaussian assumption.
Bands show 10th, 25th, 75th, 90th percentiles and the path mean.
10) Scatter plot analysis
Four point-cloud modes, each plotting all assets and a star for the current portfolio position, with quadrant guides and labels.
Risk-Return Efficiency . X is risk proxy from leverage, Y is expected return from annualized momentum. The star shows the current book’s composite.
Momentum vs Volatility . Visualizes whether leaders are also high vol, a cue for turnover and cost expectations.
Beta vs Alpha . X is a beta proxy, Y is risk-adjusted excess return proxy. Useful to see if leaders are just beta.
Leverage vs Momentum . X is volMult, Y is momentum. Shows how volatility targeting is redistributing risk.
11) Asset allocation pie chart
Builds a wheel of current allocations.
Long Only, weights are proportional to each long asset’s current volMult and sum to 100 percent.
Short Only, weights show the short book as positive slices that sum to 100 percent.
Delta Neutral, 50 percent long and 50 percent short books, each side leverage-proportional.
Labels can show asset, percent, and current leverage.
12) Inputs and quick presets
Core
Portfolio Strategy . Long Only, Short Only, Delta Neutral.
Initial Capital . For equity scaling in the panel.
Trading Days/Year . 252 for stocks, 365 for crypto.
Target Volatility . Annualized, drives volMult.
Transaction Fees . Per-bar drag and composition change penalty, see the modelling notes above.
Momentum Lookback . Ranking horizon. Shorter is more reactive, longer is steadier.
Start Date . Ensure every symbol has data back to this date to avoid bias.
Benchmark . Used for alpha, beta, and B&H line.
Diagnostics
Metrics, Equity, B&H, Curve labels, Daily return line, Rolling drawdown fill.
Attribution panel. Toggle winners only to focus on what matters.
Monte Carlo mode with Normal or Bootstrap and confidence bands.
Scatter plot type and styling, labels, and portfolio star.
Pie chart and labels for current allocation.
Presets
Crypto Daily, Long Only . Lookback 25, Target Vol 50 percent, Fees 10 bps, Regime filter on, Metrics and Drawdown on. Monte Carlo Bootstrap with Recent 200 bars for bands.
Crypto Daily, Delta Neutral . Lookback 25, Target Vol 50 percent, Fees 15–25 bps, Regime filter always active for this mode. Use Scatter Risk-Return to monitor efficiency and keep the star near upper left quadrants without drifting rightward.
Equities Daily, Long Only . Lookback 60–120, Target Vol 15–20 percent, Fees 5–10 bps, Regime filter on. Use Benchmark SPX and watch Alpha and Beta to keep the book from becoming index beta.
13) Suggested workflow
Universe sanity check . Pick liquid tickers with stable data. Thin assets distort vol estimates and fees.
Check momentum existence . Run on your timeframe. If slope and fit are weak, widen lookback or avoid that asset or timeframe.
Set risk budget . Choose a target volatility that matches your drawdown tolerance. Higher target increases turnover and cost sensitivity.
Pick mode . Long Only for bull regimes, Short Only for sustained downtrends, Delta Neutral for cross-sectional harvesting when index direction is unclear.
Tune lookback . If leaders rotate too often, lengthen it. If entries lag, shorten it.
Validate cost assumptions . Increase fee_rate and stress Monte Carlo. If the edge vanishes with modest friction, refine selection or lengthen rebalance cadence.
Run attribution . Confirm the strategy’s winners align with intuition and not one unstable outlier.
Use alerts . Enable position change, drawdown, volatility breach, regime, momentum shift, and crash alerts to supervise live runs.
Important implementation details mapped to code
Momentum measure . cr = price / price - 1 per symbol for ranking. Simplicity helps avoid overfitting.
Volatility targeting . vol = stdev(log returns, lookback) * sqrt(tradingdays), volMult = clamp(targetVol / vol, 0.1, 5), sr = ret * volMult.
Selection . Extract indices for top1..top3 and bot1..bot3. The arrays rets, scRets, lev_vals, and ticks_arr track momentum, scaled returns, leverage multipliers, and display tickers respectively.
Regime filter . EMA12 vs EMA21 switch determines if the strategy takes risk for Long or Short modes. Delta Neutral ignores the gate.
Equity update . Equity multiplies by 1 + netRet only when the regime was active in the prior bar. Buy-and-hold benchmark is computed separately for comparison.
Tables . Position tables show current top or bottom assets with leverage and weights. Metric table prints all risk and performance figures.
Visualization panels . Attribution, Monte Carlo, scatter, and pie use the last bars to draw overlays that update as the backtest proceeds.
Final notes
Momentum is a portfolio effect. The edge comes from cross-sectional dispersion, adequate risk normalization, and disciplined turnover control, not from a single best asset call.
Volatility targeting stabilizes path but does not fix selection. Use the momentum regression link above to confirm structure exists before you size into it.
Always test higher lag costs and slippage, then recheck metrics, attribution, and Monte Carlo envelopes. If the edge persists under stress, you have something robust.

🔥 QUANT MOMENTUM SKORQUANT MOMENTUM SCORE – Description (EN)
Summary: This indicator fuses Price ROC, RSI, MACD, Trend Strength (ADX+EMA) and Volume into a single 0-100 “Momentum Score.” Guide bands (50/60/70/80) and ready-to-use alert conditions are included.
How it works
Price Momentum (ROC): Rate of change normalized to 0-100.
RSI Momentum: RSI treated as a momentum proxy and mapped to 0-100.
MACD Momentum: MACD histogram normalized to capture acceleration.
Trend Strength: ADX is direction-aware (DI+ vs DI–) and blended with EMA state (above/below) to form a combined trend score.
Volume Momentum: Volume relative to its moving average (ratio-based).
Weighting: All five components are weighted, auto-normalized, and summed into the final 0-100 score.
Visuals & Alerts: Score line with 50/60/70/80 guides; threshold-cross alerts for High/Strong/Ultra-Strong regimes.
Inputs, weights and thresholds are configurable; total weights are normalized automatically.
How to use
Timeframes: Works on any timeframe—lower TFs react faster; higher TFs reduce noise.
Reading the score:
<50: Weak momentum
50-60: Transition
60-70: Moderate-Strong (potential acceleration)
≥70: Strong, ≥80: Ultra Strong
Practical tip: Use it as a filter, not a stand-alone signal. Combine score breakouts with market structure/trend context (e.g., pullback-then-re-acceleration) to improve selectivity.
Disclaimer: This is not financial advice; past performance does not guarantee future results.

MLB Momentum IndicatorMLB Momentum Indicator is a no‐lookahead technical indicator designed to signal intraday trend shifts and potential reversal points. It combines several well‐known technical components—Moving Averages, MACD, RSI, and optional ADX & Volume filters—to deliver high‐probability buy/sell signals on your chart.
Below is an overview of how it works and what each part does:
1. Moving Average Trend Filter
The script uses two moving averages (fast and slow) to determine the primary trend:
isUpTrend if Fast MA > Slow MA
isDownTrend if Fast MA < Slow MA
You can select the MA method—SMA, EMA, or WMA—and customize lengths.
Why it matters: The indicator only gives bullish signals if the trend is up, and bearish signals if the trend is down, helping avoid trades that go against the bigger flow.
2. MACD Confirmation (Momentum)
Uses MACD (with user‐defined Fast, Slow, and Signal lengths) to check momentum:
macdBuySignal if the MACD line crosses above its signal line (bullish)
macdSellSignal if the MACD line crosses below its signal line (bearish)
Why it matters: MACD crossovers confirm an emerging momentum shift, aligning signals with actual price acceleration rather than random fluctuation.
3. RSI Overbought/Oversold Filter
RSI (Relative Strength Index) is calculated with a chosen length, plus Overbought & Oversold thresholds:
For long signals: the RSI must be below the Overbought threshold (e.g. 70).
For short signals: the RSI must be above the Oversold threshold (e.g. 30).
Why it matters: Prevents buying when price is already overbought or shorting when price is too oversold, filtering out possible poor‐risk trades.
4. Optional ADX Filter (Trend Strength)
If enabled, ADX must exceed a chosen threshold (e.g., 20) for a signal to be valid:
This ensures you’re only taking trades in markets that have sufficient directional momentum.
Why it matters: It weeds out choppy, sideways conditions where signals are unreliable.
5. Optional Volume Filter (High‐Participation Moves)
If enabled, the indicator checks whether current volume is above a certain multiple of its moving average (e.g., 1.5× average volume).
Why it matters: High volume often indicates stronger institutional interest, validating potential breakouts or reversals.
6. ATR & Chandelier (Visual Reference)
For reference only, the script can display ATR‐based stop levels or a Chandelier Exit line:
ATR (Average True Range) helps gauge volatility and can inform stop‐loss distances.
Chandelier Exit is a trailing stop technique that adjusts automatically as price moves.
Why it matters: Though this version of the script doesn’t execute trades, these lines help you see how far to place stops or how to ride a trend.
7. Final Bullish / Bearish Signal
When all conditions (trend, MACD, RSI, optional ADX, optional Volume) line up for a long, a green “Long” arrow appears.
When all conditions line up for a short, a red “Short” arrow appears.
Why it matters: You get a clear, on‐chart signal for each potential entry, rather than needing to check multiple indicators manually.
8. Session & Date Filtering
The script allows choosing a start/end date and an optional session window (e.g. 09:30–16:00).
Why it matters: Helps limit signals to a specific historical backtest range or trading hours, which can be crucial for day traders (e.g., stock market hours only).
Putting It All Together
Primary Trend → ensures you trade in line with the bigger direction.
MACD & RSI → confirm momentum and avoid overbought/oversold extremes.
ADX & Volume → optional filters for strong trend strength & genuine interest.
Arrows → each potential buy (Long) or sell (Short) signal is clearly shown on your chart.
Use Cases
5‐Minute Scalping: Shorter RSI/MACD lengths to catch small, frequent intraday moves.
Swing Trading: Larger MAs, bigger RSI thresholds, and using ADX to filter only major trends.
Cautious Approach: Enable volume & ADX filters to reduce false signals in choppy markets.
Benefits & Limitations
Benefits:
Consolidates multiple indicators into one overlay.
Clear buy/sell signals with optional dynamic volatility references.
Flexible user inputs adapt to different trading styles/timeframes.
Limitations:
Like all technical indicators, it can produce false signals in sideways or news‐driven markets.
Success depends heavily on user settings and the particular market’s behavior.
Summary
The MLB Momentum Indicator combines a trend filter (MAs), momentum check (MACD), overbought/oversold gating (RSI), and optional ADX/Volume filters to create clear buy/sell arrows on your chart. This approach encourages trading in sync with both trend and momentum, and helps avoid suboptimal entries when volume or trend strength is lacking. It can be tailored to scalp micro‐moves on lower timeframes or used for higher‐timeframe swing trading by adjusting the input settings.

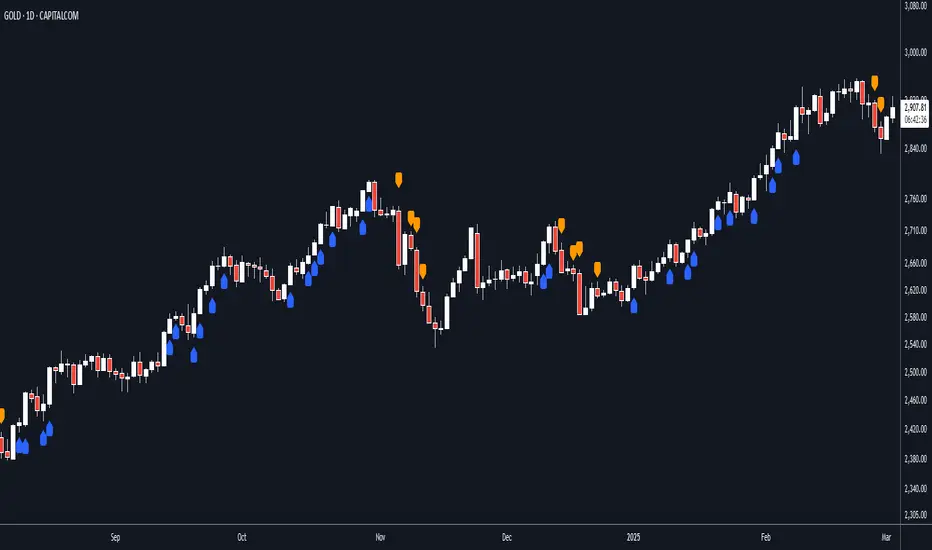
ATR + Momentum Shifts w/Take ProfitThis script is a technical analysis indicator designed to assist in identifying potential entry points and setting take profit levels in trading. It combines the Average True Range (ATR) indicator, momentum shifts, and customizable take profit levels to provide insights into potential market movements.
Differences from Currently Published Ones:
This script is unique due to its use of a combination of elements:
ATR and Momentum: The script combines the ATR indicator to provide dynamic support and resistance levels with the momentum indicator to identify shifts in the underlying momentum.
Customizable Take Profit Levels: It offers the ability to set take profit levels based on customizable multipliers of the ATR, helping traders manage potential profits.
How to Use:
ATR Bands: The script plots upper and lower ATR bands as potential dynamic support and resistance levels.
Shift Arrows: Arrows are plotted below bars for potential long entry opportunities (green triangle) and above bars for potential short entry opportunities (yellow triangle).
Take Profit Levels: The script also plots take profit levels both above and below the source price based on the ATR multipliers set in the inputs.
Markets and Conditions:
This script can be used across various financial markets, including stocks, forex, commodities, and cryptocurrencies. It's most effective in trending markets where momentum shifts can signal potential reversals or continuation of trends. Traders should consider the following conditions:
Trend Confirmation: Look for momentum shifts in the direction of the prevailing trend for higher probability setups.
Volatility: Higher volatility can amplify ATR movements and subsequently affect the placement of ATR bands and take profit levels.
Risk Management: Always implement proper risk management strategies to protect your capital.
Additional Considerations:
Customization: Traders can adjust input parameters like ATR length, momentum length, and take profit multipliers to match their trading style and market conditions.
Combining with Other Indicators: Consider using this indicator in conjunction with other technical indicators or chart patterns for confirmation.

Adaptive Squeeze Momentum (Zeiierman)█ Overview
Adaptive Squeeze Momentum (Zeiierman) is a hybrid oscillator that models the market’s transition between trend-efficient and inefficient (choppy or reversal-prone) regimes. It fuses a price efficiency framework, volatility-adaptive responsiveness, and a bounded directional trend score, then intelligently blends them through a dynamic transition band to emphasize either smooth, directional structure or spiky inefficiency.
Unlike traditional momentum tools, it does not simply measure speed or volatility. It measures how efficiently the price is moving. This multidimensional approach allows it to identify when markets are compressed and ready to expand, or stretched and ready to revert.
In essence, Adaptive Squeeze Momentum (Zeiierman) gives traders a deep structural perspective of efficiency, momentum, and compression energy, helping to expose hidden squeezes, early reversals, and trend continuations with remarkable accuracy.
⚪ Why This One Is Unique
Adaptive Squeeze Momentum (Zeiierman) stands out because it doesn’t rely on static momentum or volatility measures alone. It merges price efficiency, volatility adaptivity, and trend structure into one cohesive system capable of detecting:
Early squeeze build-ups and directional releases
Reversals emerging from inefficiency spikes
Shifts between clean trends and noisy, unstable ranges
Adaptive behavior across changing volatility conditions
In essence, it acts as a self-adjusting market intelligence tool, revealing when the price is efficient, exhausted, or preparing for significant expansion.
█ Main Features
⚪ Adaptive Squeeze Momentum Oscillator
The Adaptive Squeeze Momentum (Zeiierman) captures how price structure transitions between compression, expansion, and inefficiency. It merges a volatility-adaptive momentum engine with an efficiency-aware structure filter, creating a responsive oscillator that reflects not just how fast the market moves, but how efficiently it moves.
Adaptive Momentum: Reacts dynamically to changing volatility regimes
Efficiency Awareness: Distinguishes stable, directional flow from unstable or noisy price action
Volatility Squeeze Detection: Identifies buildup (compression) and breakout (release) conditions
Directional Context: Shows momentum alignment, exhaustion, or imbalance through color-coded histograms
This hybrid model provides a multidimensional view of trend quality, squeeze pressure, and inefficiency, ideal for precision-based trend following and structural reversal recognition.
⚪ Understanding the Squeeze
A squeeze occurs when volatility contracts, prices compress, and market energy builds, much like a coiled spring preparing to release. Once volatility expands, that stored energy transforms into directional movement, often marking the beginning of a significant breakout or new trend phase.
Traditional squeeze indicators focus only on volatility contraction. Adaptive Squeeze Momentum (Zeiierman) goes further by incorporating efficiency analysis to evaluate how organized or chaotic the buildup is. This reveals not only when a squeeze may fire but also whether the ensuing release is likely to be sustainable or structurally weak.
Visual Interpretation:
Lighter Dots: Represent low-volatility compression, energy building within an efficient or balanced structure.
Yellow Dots: Mark volatility release, the expansion phase where momentum accelerates.
⚪ Inefficiency Columns
Efficient Price Action
Efficient moves are clean, directional, and purposeful. Price advances with minimal back-and-forth noise, revealing strong conviction and structural alignment. In the indicator, these appear as smooth, non-blue histogram columns. Such periods indicate organized, high-probability momentum where breakouts, trends, and continuations are supported by efficient order flow.
Inefficient Price Action
Inefficient moves are noisy, erratic, and spiky, showing that price is fighting its own structure. Liquidity is thin, reactions are emotional, and momentum lacks balance. In the oscillator, inefficiency is displayed through blue columns, path-break spikes, or OB/OS inefficiency crosses (green/red). These elements act as early warnings of structural instability, suggesting the market may be overextended, losing organization, or entering a mean-reversion or reversal phase.
█ How to Use
⚪ Trend Following
When oscillator bars are above or below zero and growing in color intensity, momentum is expanding, confirming active, efficient trends. When colors fade, momentum is decelerating, signaling potential exhaustion or consolidation.
Interpretation:
Sustained smooth growth above zero indicates strong, efficient bullish momentum.
Sustained smooth growth below zero indicates efficient bearish continuation.
Color fading or a zero-line cross suggests trend fatigue or rotation.
Tip: Confirm trend continuation when yellow squeeze-release dots appear in the same direction. They often precede sustained breakouts following compression.
⚪ Inefficiency Reversals or Breakouts
Adaptive Squeeze Momentum (Zeiierman) excels at detecting instability within active trends, highlighting when moves lose internal efficiency and become unsustainable. When bars change color, outbreak columns appear, or Overbought/Oversold Inefficiency Crosses (green/red) appear, the structure is shifting toward potential reversal or exhaustion.
Blue Inefficiency Columns:
Above Zero: Indicates inefficient buying pressure where markets push higher impulsively or emotionally. Often signals an overstretched or unstable rally prone to short-term corrections or FOMO-driven peaks.
Below Zero: Reflects inefficient selling pressure where panic-driven or disorderly sell-offs often precede exhaustion and recovery phases.
Main Oscillator Inefficiency:
Spiky Column Above Zero
When the main oscillator suddenly surges upward and prints a tall, spiky column above the zero line without turning blue, it signals an inefficient and overextended push to the upside. This type of move breaks the oscillator’s usual smooth rhythm, showing that buyers are becoming overaggressive or emotional, often driven by FOMO or reactive momentum chasing.
Even though the column remains green, the abrupt path break reveals that the move is losing internal structure and may be unsustainable. Such inefficient upward bursts often indicate upside exhaustion or an overshoot, where the market temporarily loses control.
From here, two scenarios can unfold:
A sustained breakout if structure confirms (for example, a valid squeeze release or strong volume support).
A snapback or reversal if follow-through fails on the next bars and the oscillator begins to fade (growth → fall).
Spiky Column Below Zero
When the oscillator sharply dives and prints a tall, spiky column below the zero line without turning blue, it reflects an inefficient and emotional push to the downside. This behavior typically emerges during panic-driven selling, where traders aggressively dump positions, breaking the oscillator’s normal rhythm.
Even though the color remains red, this kind of path-break spike shows that the market has become disordered or overstretched. These inefficient downward thrusts often suggest bear exhaustion, capitulation, or a temporary overshoot below fair structure.
From this point, two potential outcomes can occur:
A sustained breakdown if the move is supported by strong volume or new structural lows.
A rebound or mean reversion occurs when momentum fails to extend, indicating that selling pressure has burned out.
Setting Tip: To focus purely on the oscillator’s structural peaks, set Inefficiency Detection and Inefficiency Duration to identical values, then adjust Inefficiency Price Peaks to control sensitivity. Use lower values for crisp detection and higher values for smoother blending.
Overbought and Oversold Inefficiency Signals
Green Overbought Cross: Signals that buyers are driving the market too aggressively, often from emotional extension or FOMO. This imbalance typically leads to short-term pauses, pullbacks, or corrections.
Red Oversold Cross: Signals panic-driven or emotionally imbalanced selling, marking structural exhaustion. Often precedes rebounds or base formations as volatility normalizes.
Interpretation: Both crosses identify where momentum is inefficient rather than simply overbought or oversold, helping detect exhaustion before conventional oscillators do.
⚪ Squeeze Builds and Releases (Volatility Expansion)
The squeeze system highlights volatility cycles when the market compresses, builds energy, and releases it through expansion.
Lighter Dots: Compression, where volatility contracts, structure tightens, and energy builds.
Yellow Dots: Release, where volatility expands, triggering directional movement.
Interpretation: Light dots signal potential breakout setups. When followed by a yellow dot and an aligned oscillator direction, they confirm momentum ignition —the moment the market transitions from equilibrium to expansion.
█ How It Works
⚪ Inefficiency Logic
The indicator evaluates how efficiently the price progresses relative to internal volatility. When market flow loses directional clarity, it transitions into an inefficiency state, represented by blue columns or sudden outbreaks within the oscillator. These moments reveal when the underlying structure becomes unstable or overly reactive, often preceding reversals or false momentum bursts.
Calculation: Applies an adaptive efficiency model that compares directional movement to internal dispersion and classifies it within a controlled stability band. A dual-threshold hysteresis with smooth interpolation ensures stable transitions between efficient (trend) and inefficient (spike) phases.
⚪ Directional Tendency Core
The directional tendency component models the underlying slope of market intent, expressing the balance between structured progression and reactive drift. It transforms directional bias into a bounded, volatility-normalized range that remains consistent across instruments and timeframes.
Calculation: Constructs a normalized directional field derived from trend displacement over an adaptive window, filtered through a nonlinear bounding transform and dynamic smoothing to control lag and oscillation.
⚪ Squeeze Engine
The squeeze system isolates compression and release cycles, the rhythmic build-up and discharge of volatility. Compression phases represent equilibrium and contraction, while release phases signify volatility expansion and directional acceleration.
Calculation: Integrates a volatility-adjusted energy model with directional gating. Compression forms during sustained contraction, while release occurs as volatility and momentum expand.
⚪ OB/OS Inefficiency Extremes
The OB/OS inefficiency system detects imbalanced extremes in order flow, when price pushes too far in one direction without structural support. These regions often precede exhaustion or rapid mean reversion.
Calculation: Generates an efficiency-weighted propagation field that identifies directional overextension. Threshold analysis and adaptive state classification determine overbought (green) and oversold (red) inefficiency zones.
⚪ Final Oscillator Composition
The final oscillator is an adaptive blend of inefficiency, directional tendency, and volatility state. It continuously morphs between spike-dominant and trend-dominant behavior based on the evolving efficiency environment. This produces a responsive structural map that visualizes the interplay between market stability, momentum, and compression energy.
Calculation: Combines the signed inefficiency signal and the bounded trend vector through a soft-weighted blending function governed by the efficiency band.
-----------------
Disclaimer
The content provided in my scripts, indicators, ideas, algorithms, and systems is for educational and informational purposes only. It does not constitute financial advice, investment recommendations, or a solicitation to buy or sell any financial instruments. I will not accept liability for any loss or damage, including without limitation any loss of profit, which may arise directly or indirectly from the use of or reliance on such information.
All investments involve risk, and the past performance of a security, industry, sector, market, financial product, trading strategy, backtest, or individual's trading does not guarantee future results or returns. Investors are fully responsible for any investment decisions they make. Such decisions should be based solely on an evaluation of their financial circumstances, investment objectives, risk tolerance, and liquidity needs.
Script de pago

Simple Volatility MomentumOverview:
The Simple Volatility Momentum indicator calculates the mean and standard deviation of the changes of price (returns) using various types of moving averages (Incremental, Rolling, and Exponential). With quantifying the dispersion of price data around the mean, statistical insights are provided on the volatility and the movements of price and returns. The indicator also ranks the mean absolute value of the changes of price over a specified time period which helps you assess the strength of the "trend" and "momentum" regardless of the direction of returns.
Simple Volatility Momentum
This indicator can be used for mean reversion strategies and "momentum" or trend based strategies.
The indicator calculates the average return as the momentum metric and then gets the moving average of the average return and standard deviations from average return average. On the options you can determine if you want to use 1 or 2 standard deviation bands or have both of them enabled.
Settings:
Source: By default it's at close.
M Length: This is the length of the "momentum".
Rank Length: This is the length of the rank calculation of absolute value of the average return
MA Type: This is the different type of calculations for the mean and standard deviation. By default its at incremental.
Smoothing factor: (Only used if you choose the exponential MA type.)
The absolute value of the average return helps you see the strength of the "momentum" and trend. If there is a low ranking of the absolute value of the average return then you can eventually expect it to increase which means that the average return is trending, leading to trending price moves. If the Mean ABS rank value is at or near the maximum value 100 and the average return is at -2 standard deviation from the mean, you can see it as the negative momentum or trend being "finished". Similarly, if the Mean ABS value is near or at the maximum value 100 and the average return is at +2 standard deviation from the mean, you can view the uptrend, as "finished" and the Mean ABS rank can't really go higher than 100.
Moving Average Calculations type:
Incremental: Incremental moving averages use an incremental approach to update the moving average by adding the newest data point and subtracting the oldest one.
Exponential: The exponential moving average gives more weight to recent data points while still considering older ones. This is achieved by applying a smooth factor to the previous EMA value and the current data point. EMA's react more quickly to recent changes in the data compared to simple moving averages, making them useful for short term trends and momentum in financial markets.
Rolling: The moving average is calculated by taking the average of a fixed number of data points within a defined window. As new data becomes available, the window moves forward and the average is recalculated. Rolling Moving Averages are useful for smoothing out short-fluctuations and identifying trends over time.
Important thing to note about indicators involving bands and "momentum" or "trend" or prices:
For the explanation we will assume that stock returns follow a normal distribution and price follows a log normal distribution. Please note that in the live market this assumption isn't always true. Many people incorrectly use standard deviations on prices and trade them as mean reversion strategies or overbought or oversold levels which is not what standard deviations are meant for. Assuming you have applied the log transformation on the standard deviation bands (if your input is raw price then you should use a log transformation to remove the skewness of price), and you have a range of 2 standard deviations from the mean, under the empirical rule with enough occurrences 95% of the values will be within the 2 standard deviation range. This doesn't mean that if price falls to the bottom of the 2 standard deviation bound, there is a 95% chance it will revert back to mean, this is incorrect and not how standard deviations or mean reversion works.
"MOMENTUM"
In finance "momentum" refers to the rate of change of a time series data point. It shows the persistence or tendency for a data series to continue moving in its current direction. In finance, "momentum" based strategies capitalize on the observed tendency of assets that have performed well (or poorly) in the recent past to continue performing well (or poorly) in the near future. This persistence is often observed in various financial instruments including stocks, currencies and commodities.
"Momentum" is commonly calculated with the average return, and relies on the assumption that assets with positive "momentum" or a positive average return will likely continue to perform well in the short to medium term, while assets with a negative average return are expected to continue underperforming. This average return or expected value is derived from historical observations and statistical analysis of previous price movements. However, real markets are subject to levels of efficiencies, market fluctuations, randomness, and may not always produce consistent returns over time involving momentum based strategies.
Mean Reversion:
In finance, the average return is an important parameter in mean reversion strategies. Using statistical methodologies, mean reversion strategies aim to exploit the deviations from the historical average return by identifying instances where current prices and their changes diverge from their expected levels based on past performance. This approach involves statistical analysis and predictive modelling techniques to check where and when the average rate of change is likely to revert towards the mean. It's important to know that mean reversion is a temporary state and will not always be present in a specific timeseries.
Using the average return over price offers several advantages in finance and trading since it is less sensitive to extreme price movements or outliers compared to raw price data. Price itself contains a distribution that is usually positively-skewed and has no upper bound. Mean reversion typically occurs in distributions where extreme values are followed by a tendency for the variable to return towards its mean over time, however the probability distribution of price has no tendency for values to revert towards any specific level. Instead, values may continue to increase without a bound. Returns themself contain more stationary behavior than price levels. Mean reversion strategies rely on the assumption that deviations from the mean will eventually revert back to the mean. Returns, being more likely to exhibit stationary, are better suited for mean reversion based strategies.
The distribution of returns are often more symmetrically distributed around their mean compared to price distributions. This symmetry makes it easier to identify deviations from the mean and assess the likelihood of mean reversion occurrence. Returns are also less sensitive to trends and long-term price movements compared to price levels. Mean reversion strategies aim to exploit deviations from mean, which can be obscured when analyzing raw price data since raw price is almost always trending. Returns can filter out the trend component of price movements, making it easier to identify opportunities.
Stationary Process: Implication that properties like mean and variance remain relatively constant over time.

TradeChartist Mean Momentum Drift Oscillator (MMDO)™TradeChartist Mean Momentum Drift Oscillator (MMDO) is the Oscillator version of the ™TradeChartist Mean Momentum Drift Bands (MMDB) indicator with some added visual features to spot Momentum, divergences and Price action using ™TradeChartist Zone Visualizer model.
===================================================================================================================
Features of ™TradeChartist MMDO
==============================
Price zone detection using ™TradeChartist Zone Visualizer model.
No User input required.
3 Visual colour schemes - Chilli, Flame and Custom.
Clear Visualization of Overbought and Oversold zones.
Colour Bars based on Momentum strength.
MDDO highs and lows tracker helps detect divergences.
===================================================================================================================
Example Charts
1. MMDO used along with ™TradeChartist MMDB (Mean Momentum Drift Bands) on 4hr chart of BINANCE:BTCUSDT
2. MMDO on 1hr chart of OANDA:EURUSD to confirm Drift Bands breakout entries on MMDB
3. MMDO on 1hr chart of BINANCE:LUNAUSDT
===================================================================================================================
Best Practice: Test with different settings first using Paper Trades before trading with real money
===================================================================================================================

Volatility Based Momentum by QTX Algo SystemsVolatility Based Momentum by QTX Algo Systems
Overview
This indicator is designed to determine whether a market trend is genuinely supported by both momentum and volatility. It produces per-candle signals when a smoothed momentum oscillator is above its moving average, a Price – Moving Average Ratio confirms overall trend strength by remaining above a preset level with a positive slope, and when at least one of two distinct volatility metrics is rising. This integrated approach offers traders a consolidated and dynamic view of market energy, delivering more actionable insights than a simple merger of standard indicators.
How It Works
The indicator fuses two complementary volatility measures with dual momentum assessments to ensure robust signal generation. One volatility metric evaluates long-term market behavior by analyzing the dispersion of logarithmic price changes, while the other—derived from a Bollinger Band Width Percentile—captures recent price variability and confirms that market volatility remains above a minimum threshold. A trading signal is generated only when at least one of these volatility measures shows a sustained upward trend over several candles.
For momentum, a double‐smoothed Stochastic Momentum Index provides a refined, short-term view of price action, filtering out market noise. In addition, the PMARP serves as a confirmation tool by comparing the current price to its moving average, requiring that its value remains above a defined level with a positive slope to indicate a strong trend. Together, these elements ensure that a signal is only produced when both the market’s momentum and volatility are in alignment.
Although the components used are based on well-known technical analysis methods, the thoughtful integration of these elements creates a tool that is more than the sum of its parts. By combining long-term volatility assessment with a real-time measure of recent price variability—and by merging short-term momentum analysis with a confirmation of overall trend strength—the indicator delivers a more reliable and comprehensive view of market energy. This holistic approach distinguishes it from standard indicators.
How to Use
Traders can adjust the volatility threshold setting to tailor the indicator to their preferred market or timeframe. The indicator displays per-candle signals when both the refined momentum criteria and the dynamic volatility conditions are met. These signals are intended to be used as part of a broader trading strategy, in conjunction with other technical analysis tools for confirming entries and exits.
Disclaimer
This indicator is for educational purposes only and is intended to support your trading strategy. It does not guarantee performance, and past results are not indicative of future outcomes. Always use proper risk management and perform your own analysis before trading.
TEWY - Magic Momentum IndicatorMy goal is to equip every trader and investor with the essential tools necessary to confidently navigate the complexities of the financial markets, enabling them to consistently identify opportunities and maintain a position of strength on the winning side of their trades. This indicator stands as a potent tool, offering the capability to effectively assess longer-term momentum trends.
Allow me to provide some context regarding the genesis of this indicator. By keenly observing the pattern of momentum loss preceding each trend reversal, coupled with the notable decrease in the rate of price change, I've formulated this indicator. This design is rooted in the understanding that these dynamics hold key insights into the market's shifting trends.
So, I've developed this indicator with the purpose of granting you the ability to select and construct optional combinations of up to two comparable symbols. Through this, you gain a comprehensive and insightful perspective on the ever-evolving dynamics of the market.
This indicator acts like an oscillator and momentum line serves as a key determinant. When the line is positioned above 0, it signifies a positive momentum; conversely, if it rests below 0, it indicates a sideways to negative trend. This mechanism offers a clear and intuitive means of gauging prevailing market conditions.
Should you have any inquiries or require further clarification regarding this indicator, please do not hesitate to reach out to me via direct message. I am here to provide you with the necessary guidance and support to ensure your experience with this tool is both seamless and enriching. Your understanding and satisfaction remain my utmost priority.
By TEWY - Trade Easy With Yogesh
I am Yogesh

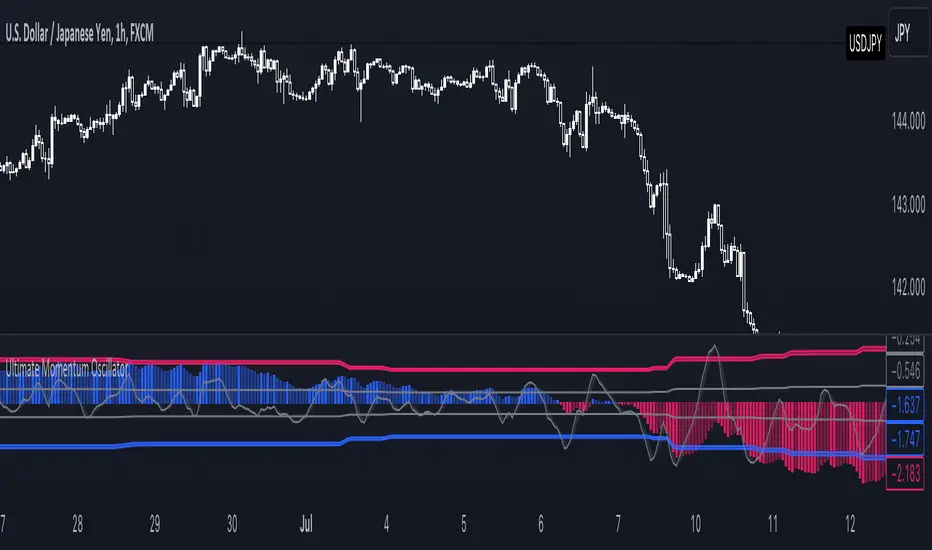
Ultimate Momentum OscillatorThe Ultimate Momentum Oscillator is a tool designed to help traders identify the current trend direction and the momentum of the prices.
This oscillator is composed of one histogram and one line, paired with the two overbought and the two oversold levels.
The histogram is a trend-based algorithm that allows the user to read the market bias with multiple trend lengths combined.
The line is a momentum-based formula that allows traders to identify potential reversal and the speed of the price.
This tool can be used to:
- Identify the current trend direction
- Identify the momentum of the price
- Identify oversold and overbought levels